Pair Trading Strategy
- Indikatoren
- Ledi Haryadi
- Version: 1.422
- Aktualisiert: 8 Mai 2025
- Aktivierungen: 5
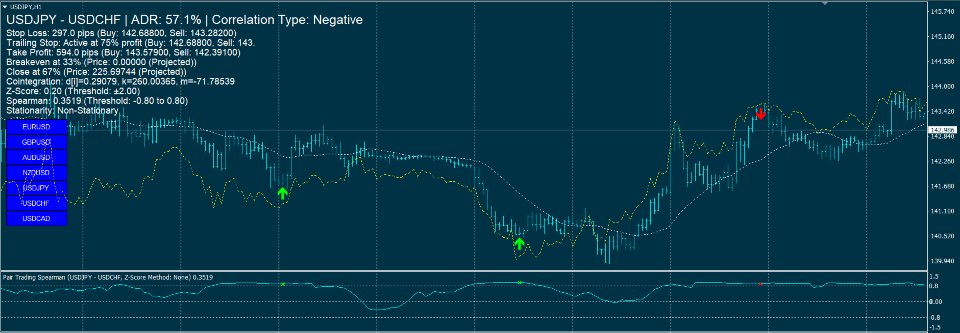
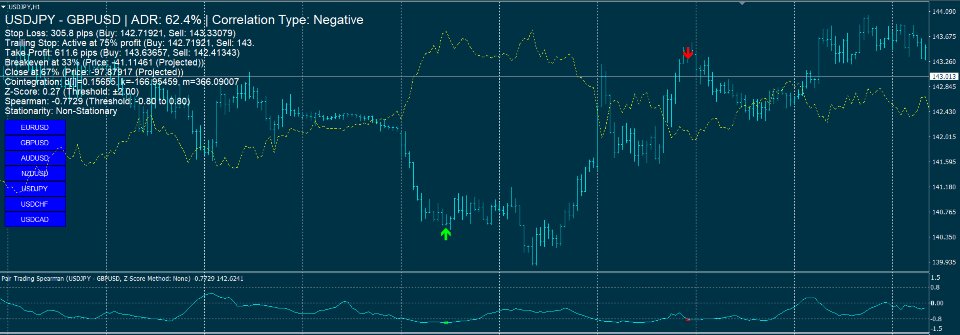
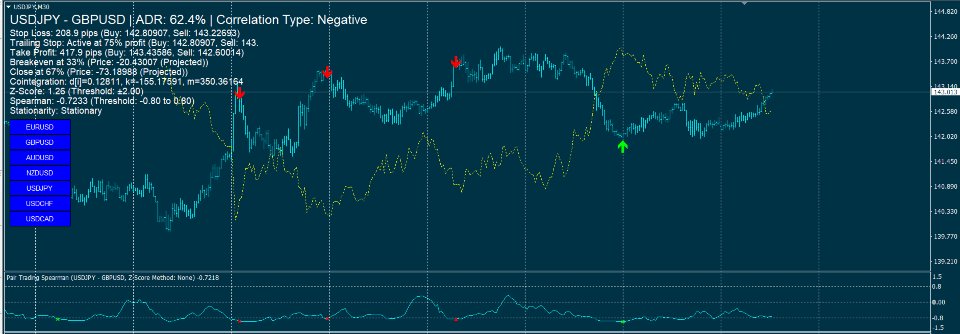
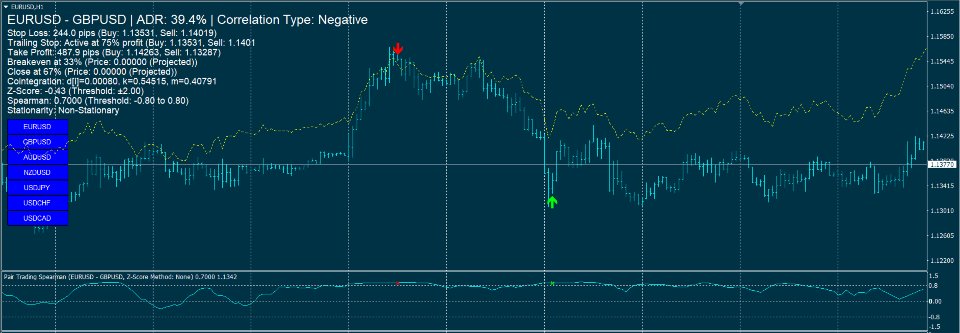
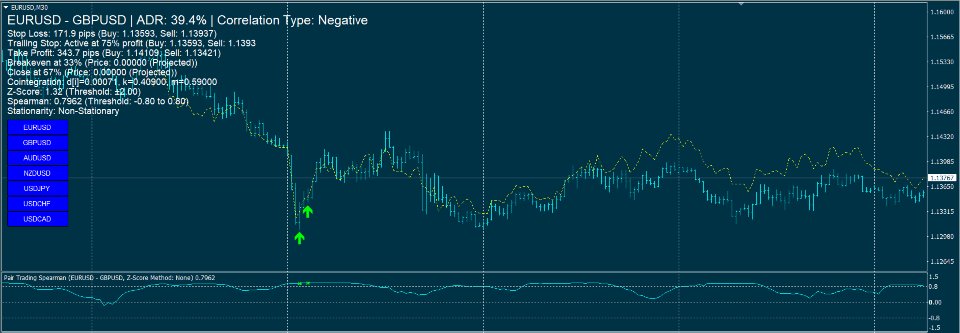
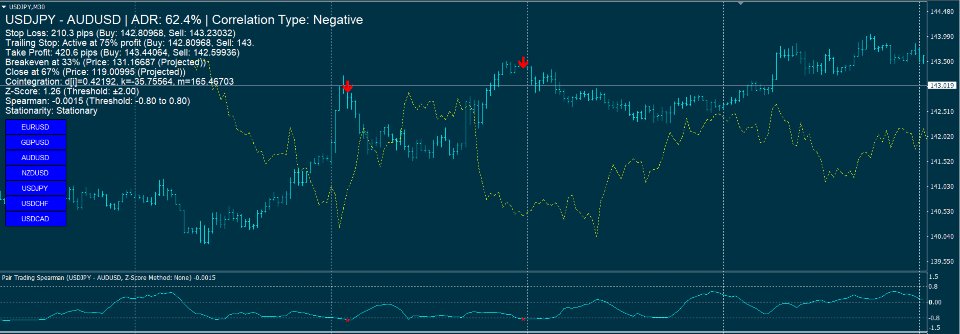
Pair Trading Strategy Based on Spearman Correlation and Stationary Z-Score is A single-pair indicator focusing on one primary symbol (chart symbol) and one secondary symbol for the MetaTrader 4 (MT4) platform, designed to support pairs trading by analyzing the correlation between two currency pairs. It employs Spearman’s rank correlation coefficient, Z-Score calculations, and stationarity testing to generate trading signals, displayed in a subwindow and on the main chart. The indicator integrates technical filters and risk management features, with a focus on user customization.
Key Features
- Correlation Analysis:
- Calculates Spearman’s rank correlation coefficient to assess the relationship between a primary symbol (chart symbol) and a secondary symbol (default: EURUSD).
- Identifies negative (default threshold: -0.95) and positive (default threshold: 0.95) correlations to generate trading signals.
- Displays correlation values in a subwindow as a line plot with levels at ±0.9 and 0.
- Z-Score and Stationarity:
- Computes Z-Score to measure the spread deviation between pairs, using a configurable lookback period (default: 100 bars) and threshold (default: 2.5).
- Supports stationarity testing via the Augmented Dickey-Fuller (ADF) test, with options for no transformation, first differencing, or logarithmic transformation.
- Allows users to require stationary spreads for signal generation (default: enabled), with configurable ADF test intervals (default: 60 seconds).
- Technical Filters:
- Uses Moving Average (MA, default period: 20), Relative Strength Index (RSI, default period: 14), and Bollinger Bands (default period: 20, deviations: 2.0) to filter signals.
- Offers a Bollinger-only filter mode or no filter option, with optional Bollinger arrow display in the subwindow.
- Configurable RSI levels for buy (default: 30) and sell (default: 70) signals.
- Signal Generation and Visualization:
- Generates buy/sell signals based on correlation, Z-Score, MA, RSI, and Bollinger conditions, displayed as arrows in the subwindow, main chart, or both (configurable).
- Supports positive and negative correlation signals, with distinct logic for each (e.g., buy Symbol1/sell Symbol2 for negative correlation).
- Arrows on the main chart have adjustable sizes (1–5, default: 1).
- Overlay Chart:
- Optionally displays the secondary symbol’s price movement on the main chart, with mirroring for negative correlations (default: enabled).
- Normalizes price ranges over a configurable bar count (default: 100 bars) for visual comparison.
- Risk Management:
- Includes Stop Loss (based on ATR, default period: 14, multiplier: 1.5), Trailing Stop (default start: 75% of target profit), and Take Profit (default reward:risk ratio: 2.0).
- Monitors breakeven (default: 33%) and close (default: 67%) correlation levels, calculated using cointegration parameters.
- Displays risk management data (stop loss, take profit, trailing stop, breakeven, close levels) on the main chart.
- Alerts and Notifications:
- Provides alerts for new signals (current bar, closed bar, or both) and risk management updates (stop loss, take profit, etc.).
- Supports pop-up alerts and push notifications, with configurable settings to enable/disable.
- Prevents repeated alerts using timestamp tracking.
- Additional Features:
- Calculates Average Daily Range (ADR, default period: 14 days) as a percentage for market context, displayed on the chart.
- Implements data retrieval with retry attempts (default: 3) and timeouts (default: 500ms for data, 1000ms for ADF) to handle connectivity issues.
- Displays cointegration parameters (d, k, m) and stationarity status on the chart.
- Customization:
- Offers extensive input parameters for adjusting lookback periods, thresholds, filter settings, arrow locations, and display options (e.g., font size, arrow size).
- Allows enabling/disabling features like RSI, Bollinger Bands, Z-Score, ADF test, overlay chart, and risk management tools.
Usage
- Initialization: Sets the primary symbol to the chart’s symbol and validates the secondary symbol’s availability. Initializes buffers, arrays, and ADF test if enabled.
- Operation: Calculates correlations, Z-Scores, and technical indicators per bar, updating signals, arrows, and chart overlays. Refreshes on-chart information every 60 seconds.
- Visualization: Plots Spearman correlation in a subwindow, places signal arrows on the main chart or subwindow, and displays risk and correlation data on the chart.
- Deinitialization: Removes all indicator objects (arrows, labels, overlay lines) upon removal.
Notes
- Requires sufficient historical data for calculations (minimum bars based on lookback and filter periods).
- Ensures robust data handling with retry mechanisms and timeout controls.
- The overlay chart feature is optional and can be disabled for performance.
- When using Pair Trading Strategy Based on Spearman , make sure to limit the bars in the Max bars in chart option to below 2000, for example 500.
