Reza Aghajanpour / Vendedor
Productos publicados
** All Symbols x All Timeframes scan just by pressing scanner button ** After 17 years of experience in the markets and programming, Winner indicator is ready. I would like to share with you! *** Contact me to send you instruction and add you in "123 scanner group" for sharing or seeing experiences with other users. Introduction The 123 Pattern Scanner indicator with a special enhanced algorithm is a very repetitive common pattern finder with a high success rate . Interestingly, this Winner in
** Todos los símbolos x Todos los plazos de exploración con sólo pulsar el botón del escáner ** *** Ponte en contacto conmigo para enviarte instrucciones y añadirte en "123 scanner group" para compartir o ver experiencias con otros usuarios. Después de 17 años de experiencia en los mercados y la programación, Winner indicador está listo. ¡Me gustaría compartirlo con usted! Introducción El indicador 123 Pattern Scanner con un algoritmo especial mejorado es un buscador de patrones comunes muy rep
** Todos los Símbolos x Todos los Plazos escanean con sólo pulsar el botón del escáner ** *** Ponte en contacto conmigo para enviarte las instrucciones y añadirte en "M W Scanner group" para compartir o ver experiencias con otros usuarios. Introducción: Doble Top(M) y Doble Bottom(W) es un tipo común muy repetitivo de los patrones de reversión de precios. Double Top se asemeja al patrón M e indica una reversión bajista mientras que Double Bottom se asemeja al patrón W e indica una reversión alci
Introducción : AI Swing EA es un trader totalmente automatizado con SL Fijo y alta tasa de ganancias. GRAN descuento : El precio es de $ 250, Pero ahora es sólo $ 49, La oferta está activa por un tiempo limitado. Señal Real: https: //www.mql5.com/en/signals/2271390 No Martingale, No Grid Ponte en contacto conmigo para enviarte instrucciones y añadirte al grupo. La próxima generación del modelo OpenAI rápidamente ganó la atención significativa con su amplia gama de capacidades y versatilidad, Uti
Introduction : AI Swing EA is a fully automated trader with Fixed SL and high win rate. BIG Discount : The price is $250, But now it is just $49, The offer is active for a limited time. Real Live Signal: https://www.mql5.com/en/signals/2271390 No Martingale, No Grid Contact me to send you instruction and add you in group. The next generation OpenAI model quickly gained significant attention with its broad range of capabilities and versatility, We used its expertise in assisting prediction pr
** Todos los símbolos x Todos los plazos escanean con sólo pulsar el botón del escáner ** - Descuento : no son 50$, son sólo 39$. *** Contacta conmigo para enviarte instrucciones y añadirte en "Head & Shoulders Scanner group" para compartir o ver experiencias con otros usuarios. Introducción: El Patrón de Cabeza y Hombros es un tipo común muy repetitivo de patrones de reversión de precios. El patrón aparece en todos los marcos de tiempo y puede ser utilizado por todo tipo de traders e inversioni

** All Symbols x All Time frames scan just by pressing scanner button ** *** Contact me to send you instruction and add you in "Harmonic Scanner group" for sharing or seeing experiences with other users. Introduction Harmonic Patterns are best used to predict turning point. Harmonic Patterns give you high win rate and high opportunities for trade in during one day. This indicator detects the best and successful patterns base on Harmonic Trading books . The Harmonic Patterns Scanner Scans All ch

** Todos los símbolos x Todos los plazos escanean con sólo pulsar el botón del escáner ** Descuento: El precio es de $ 50, pero ahora es sólo $ 35, oferta por tiempo limitado está activo.
*** Ponte en contacto conmigo para enviarte instrucciones y añadirte en "Trend Reversal group" para compartir o ver experiencias con otros usuarios. Introducción: Las líneas de tendencia son el análisis técnico más famoso en el trading . Las líneas de tendencia se forman continuamente en los gráficos de los me
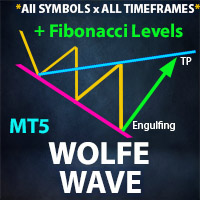
** Todos los Símbolos x Todos los Plazos escanean con solo presionar el botón del escáner ** *** Ponte en contacto conmigo para enviarte instrucciones y añadirte al "grupo Wolfe Wave Scanner" para compartir o ver experiencias con otros usuarios.
Introducción: Una Onda de Wolfe se crea con patrones de cinco ondas en el precio. Muestra la oferta y la demanda y una lucha hacia un precio de equilibrio. Estas ondas de acciones de precios pueden ayudar a los operadores a identificar los límites de la
Después de 17 años de experiencia en los mercados y la programación, Winner indicador está listo. ¡Me gustaría compartirlo con usted! Descuento: Sólo 4 de 5 copia es de 39 $. *** Contacta conmigo para enviarte las instrucciones y añadirte al grupo para compartir o ver experiencias con otros usuarios. Mayor capitalización de mercado pertenece a Oro, Bitcoin y US30, por lo que tienen muchos comerciantes y grandes para su uso en scalping. Asistente de Oro y Bitcoin obtendrá beneficios en los marcos

** Todos los Símbolos x Todos los Plazos escanean con sólo pulsar el botón del escáner ** *** Ponte en contacto conmigo para enviarte las instrucciones y añadirte al "grupo Channel Scanner" para compartir o ver experiencias con otros usuarios. Introducción: El patrón de Canal se describe como el área localizada entre dos líneas de tendencia. Esta zona se utiliza para medir un rango de negociación. En este caso, la línea de tendencia superior conecta los máximos del precio mientras que la línea d
** All Symbols x All Timeframes scan just by pressing scanner button ** - Discount : it is not 50$, it is just 39$. *** Contact me to send you instruction and add you in "Head & Shoulders Scanner group" for sharing or seeing experiences with other users. Introduction: Head and Shoulders Pattern is a very repetitive common type of price reversal patterns. The pattern appears on all time frames and can be used by all types of traders and investors. The Head and Shoulders Sc
** Todos los símbolos x Todos los marcos de tiempo de exploración con sólo pulsar el botón del escáner ** Descuento: El precio es de $ 50, pero ahora es sólo $ 35, oferta por tiempo limitado está activo.
*** Contacta conmigo para enviarte instrucciones y añadirte en "Swing scanner group" para compartir o ver experiencias con otros usuarios. Swing EA: https://www.mql5.com/en/market/product/124747 Introducción: Swing Scanner es el indicador diseñado para detectar oscilaciones en la dirección de l
** Todos los Símbolos x Todos los Plazos escanean con sólo pulsar el botón del escáner **. *** Contáctame para enviarte instrucciones y agregarte en "Market Structure group" para compartir o ver experiencias con otros usuarios. Introducción: La estructura del mercado es importante tanto para los operadores nuevos como para los profesionales, ya que puede influir en la liquidez y la acción del precio de un mercado. También es una de las técnicas más utilizadas para comprender tendencias, identifi
** All Symbols x All Time frames scan just by pressing scanner button ** Discount: The price is $50$, But now it is just $35, Limited time offer is active.
*** Contact me to send you instruction and add you in "Swing scanner group" for sharing or seeing experiences with other users. Swing EA: https://www.mql5.com/en/market/product/124747 Introduction: Swing Scanner is the indicator designed to detect swings in the direction of the trend and possible reversal swings. The indicator studies sev

** All Symbols x All Timeframes scan just by pressing scanner button ** *** Contact me to send you instruction and add you in "Wolfe Wave Scanner group" for sharing or seeing experiences with other users. Introduction: A Wolfe Wave is created with five-wave patterns in price. It shows supply and demand and a fight towards a balance price. T hese waves of price actions can help traders identify the boundaries of the trend . Also It helps forecast how the price will move in the near future
** Todos los Símbolos x Todos los Plazos escanear sólo pulsando el botón del escáner ** ***Contacta conmigo para enviarte instrucciones y añadirte en "RSI scanner group" para compartir o ver experiencias con otros usuarios. Introducción La divergencia RSI es una técnica principal utilizada para determinar la inversión de la tendencia cuando es el momento de vender o comprar porque es probable que los precios bajen o suban en los gráficos. El indicador de Divergencia RSI puede ayudarle a localiz

The next generation G P T AI model quickly gained significant attention with its broad range of capabilities and versatility, We used its expertise in assisting prediction prices in formulating and applying improved trading strategies. Our AI core is capable of extracting data insights from financial news, Sentiment Analysis , specific formula, Oscillators and indicators status and other unstructured data sources. This information can then be used in conjunction with other datasets to make our

Ponte en contacto conmigo para enviarte las instrucciones y añadirte al grupo.
El patrón QM (Quasimodo) se basa en los conceptos de Read The Market (RTM). El propósito de este modelo es hacer frente a los grandes jugadores del mercado (instituciones financieras y bancos), Como ustedes saben en los mercados financieros, los grandes comerciantes tratan de engañar a los pequeños comerciantes, pero RTM evitar que los comerciantes atrapados. Este estilo se forma en términos de velas de precios y se
** All Symbols x All Timeframes scan just by pressing scanner button ** *** Contact me to send you instruction and add you in "M W Scanner group" for sharing or seeing experiences with other users. Introduction: Double Top(M) and Double Bottom(W) is a very repetitive common type of price reversal patterns. Double Top resembles M pattern and indicates bearish reversal whereas Double Bottom resembles W pattern and indicates a bullish reversal that they have high win rate. The M W Scanne
** All Symbols x All Timeframes scan just by pressing scanner button ** *** Contact me to send you instruction and add you in "Market Structure group" for sharing or seeing experiences with other users. Introduction: Market structure is important for both new and professional traders since it can influence the liquidity and price action of a market (Breakout and Retest). It’s also one of the most commonly used techniques to understand trends, identify potential reversal points, and get a feel f

** All Symbols x All Timeframes scan just by pressing scanner button ** Discount: The price is $50$, But now it is just $35, Limited time offer is active.
*** Contact me to send you instruction and add you in "Trend Reversal group" for sharing or seeing experiences with other users. Introduction: Trendlines are the most famous technical analysis in trading . Trend lines continually form on the charts of markets across all the different timeframes providing huge opportunities for trader

** Todos los Símbolos x Todos los Plazos escanean con sólo presionar el botón del escáner . *** Ponte en contacto conmigo para enviarte las instrucciones y añadirte al "grupo de escáneres ABCD" para compartir o ver experiencias con otros usuarios. Introducción Este indicador escanea patrones de retroceso AB=CD en todos los gráficos. El ABCD es el fundamento básico de todos los patrones armónicos y altamente repetitivo con una alta tasa de éxito . El indicador ABCD Scanner es un patrón ABCD de re
¡Esto es diamante! Ponte en contacto conmigo para enviarte instrucciones y añadirte al grupo.
Diamond Pattern se basa en los conceptos de Read The Market(RTM). El propósito de este modelo es hacer frente a los grandes jugadores del mercado (instituciones financieras y bancos), Como ustedes saben en los mercados financieros, los grandes comerciantes tratan de engañar a los pequeños comerciantes, pero RTM evitar que los comerciantes atrapados. Este estilo se forma en términos de velas de precio

** All Symbols x All Timeframes scan just by pressing scanner button ** *** Contact me to send you instruction and add you in "All Divergences scanner group" for sharing or seeing experiences with other users. Introduction Divergence is a main technique used to determine trend reversing when it’s time to sell or buy because prices are likely to drop or pick in the charts. All Divergence indicator can help you locate the top and bottom of the market. This indicator finds Regular divergences for

** Todos los Símbolos x Todos los Marcos de Tiempo escanean con sólo presionar el botón del escáner ** *** Contáctame para enviarte instrucciones y agregarte en "Harmonic Scanner group" para compartir o ver experiencias con otros usuarios. Introducción Los patrones armónicos son los más utilizados para predecir el punto de inflexión. Los patrones armónicos le dan una alta tasa de ganancias y altas oportunidades para el comercio en un día. Este indicador detecta los mejores y exitosos patrones ba

** Todos los símbolos x Todos los marcos de tiempo escanear con sólo pulsar el botón del escáner ** *** Contacta conmigo para enviarte instrucciones y añadirte en "Order Block group" para compartir o ver experiencias con otros usuarios. Introducción: Los bancos centrales y las instituciones financieras impulsan principalmente el mercado, el bloqueo de órdenes se considera un comportamiento del mercado que indica acumulación de órdenes de bancos e instituciones, entonces el mercado tiende a hacer
** All Symbols x All Timeframes scan just by pressing scanner button ** *** Contact me to send you instruction and add you in "RSI scanner group" for sharing or seeing experiences with other users.
Introduction RSI divergence is a main technique used to determine trend reversing when it’s time to sell or buy because prices are likely to drop or pick in the charts. The RSI Divergence indicator can help you locate the top and bottom of the market. This indicator finds Regular divergence for pul
* All Symbols x All Timeframes scan just by pressing scanner button ** *** Contact me to send you instructions and add you in "Candle Scanner group" for sharing or seeing experiences with other users. Introduction: Candles tell their story. When looking at a candle, it’s best viewed as a contest between buyers and sellers. Candlestick patterns are used to predict the future direction of price movement. Candlesticks are an easy way to understand the price action. You can use candlesticks to decid

** All Symbols x All Timeframes scan just by pressing scanner button ** *** Contact me to send you instruction and add you in "ABCD scanner group" for sharing or seeing experiences with other users. Introduction This indicator scans AB=CD retracement patterns in all charts. The ABCD is the basic foundation for all harmonic patterns and highly repetitive with a high success rate . The ABCD Scanner indicator is a scanner reversal ABCD pattern that helps you identify when the price is about to ch

Contact me to send you instruction and add you in group.
QM (Quasimodo) Pattern is based on Read The Market(RTM) concepts. The purpose of this model is to face the big players of the market (financial institutions and banks), As you know in financial markets, big traders try to fool small traders, but RTM prevent traders from getting trapped. This style is formed in terms of price candles and presented according to market supply and demand areas and no price oscillator is used in it. RTM conc

Market Heartbeat in your hand! Introduction The Market Heartbeat indicator with a special enhanced algorithm (volume, money flow, cycle of market and a secret value) is a very repetitive trend finder with a high success rate . Interestingly, this Winner indicator indicates that the trend has changed its direction or the end of a trend retracement or even appears at the range market. The Market Heartbeat can use in scalping trading or trend trading. It finds immediately with alarm, notification a

Introduction RSI divergence is a main technique used to determine trend reversing when it’s time to sell or buy because prices are likely to drop or pick in the charts. The RSI Divergence indicator can help you locate the top and bottom of the market. This indicator finds Regular divergence for pullback the market and also finds hidden RSI Divergence to show continuing trend. This indicator shows divergence on the RSI that is a strong hint for an excellent entry point and finds immediately with
FREE

** All Symbols x All Time frames scan just by pressing scanner button ** *** Contact me to send you instruction and add you in "Order Block group" for sharing or seeing experiences with other users. Introduction: The central banks and financial institutions mainly drive the market, Order block is considered a market behavior that indicates accumulation of orders from banks and institutions, then the market tends to make a sharp move(Imbalance) on either side once the order block is completed. O

¡Market Heartbeat está en su mano! Introducción El indicador Market Heartbeat con un algoritmo especial mejorado ( volumen, flujo de dinero, ciclo de mercado y un valor secreto) es un buscador de tendencias muy repetitivo con una alta tasa de éxito . Curiosamente , este indicador Winner indica que la tendencia ha cambiado de dirección o el final de un retroceso de tendencia o incluso aparece en el rango de mercado. El latido del corazón del mercado puede utilizar en el comercio de scalping o el

** All Symbols x All Time frames scan just by pressing scanner button ** *** Contact me to send you instruction and add you in "Divergence group" for sharing or seeing experiences with other users. Introduction MACD divergence is a main technique used to determine trend reversing when it’s time to sell or buy because prices are likely to drop or pick in the charts. The MACD Divergence indicator can help you locate the top and bottom of the market. This indicator finds Regular divergence for pul
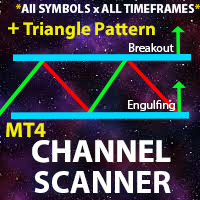
** All Symbols x All Timeframes scan just by pressing scanner button ** *** Contact me to send you instruction and add you in "Channel Scanner group" for sharing or seeing experiences with other users. Introduction: The Channel pattern is described as the area located between two trend lines. This area is used for a measure of a trading range. In this case, the upper trend line connects price highs while the lower trend line connects price lows. Also when it comes to breakout points, it helps t
This is diamond! Contact me to send you instruction and add you in group.
Diamond Pattern is based on Read The Market(RTM) concepts. The purpose of this model is to face the big players of the market (financial institutions and banks), As you know in financial markets, big traders try to fool small traders, but RTM prevent traders from getting trapped. This style is formed in terms of price candles and presented according to market supply and demand areas and no price oscillator is used in it.
Gold Avatar is a Fully Automated for Trading XAUUSD/Gold. It will be 300$, it is now just 199$. ** New Update = Version 3 ** Contact me immediately after the purchase to send you instruction and add you in group. Default Settings for XAUUSD M15 FEATURES: Easy-to-use, just add EA on chart without any setting.
News Filter and Auto GMT Time are supported XAUUSD - M15
Sets are provided
Limited number of Buyers Free Demo available to download Recommend deposit 100 USD (Cent account) or 1 000 U

** Todos los símbolos x Todos los marcos de tiempo escanear con sólo pulsar el botón del escáner **. *** Contacta conmigo para enviarte instrucciones y añadirte en "Divergence group" para compartir o ver experiencias con otros usuarios. Introducción La divergencia MACD es una técnica principal utilizada para determinar la inversión de tendencia cuando es el momento de vender o comprar porque los precios son propensos a caer o recoger en los gráficos. El indicador de Divergencia MACD puede ayudar
Señales publicadas
1. AI Swing EA
- Incremento
- 25%
- Suscriptores
- 0
- Semanas
- 31
- Trades
- 57
- Rentables
- 100%
- Facto de Beneficio
- n/a
- Reducción máxima
- 13%