• Aperçu
  • Avis (7)
  • Commentaires (30)
  • Nouveautés

BoxChart MT5

5

The market is unfair if only because 10% of participants manage 90% of funds. An ordinary trader has slim changes to stand against these "vultures". This problem can be solved. You just need to be among these 10%, learn to predict their intentions and move with them.

Volume is the only preemptive factor that faultlessly works on any timeframe and symbol. First, the volume appears and is accumulated, and only then the price moves. The price moves from one volume to another. Areas of volume accumulation form reliable support/resistance levels and are regularly "tested" by the price providing the best market entry opportunity. The method of trading using this indicator comes down to trading from one strong area to another.


Indicator operation principle

The BoxChart indicator calculates volume clusters, sorts them according to their completeness and marks them in appropriate colors. In addition, the indicator sums all clusters and displays the result on the price axis as a horizontal volume scale (the market profile).

The indicator works on all timeframes available in the terminal, but uses historical data of smaller periods (relative to the current one) M1, M5, H1, H4 and D1 for calculations. Before launching the indicator, download the history of these timeframes by scrolling the chart to the left. If there are no data, the indicator displays the appropriate message and perform drawings only where the data are available.

The indicator performs all drawings only in the chart view area but you can scroll the chart to the history. The clusters may "blink" when scrolling the chart. This is a normal behavior since they are being re-sorted.

Clusters having the same color but different length (within a single price line) are approximately similar by their volume.


Indicator buttons

  • BSP – increase/decrease a fixed step of a price grid. Set in "old" points. If 0, the calculation step is taken from the parameter set by the BSPP button.
  • BSPP - increase/decrease a dynamic step of a price grid. Set in monitor pixels.
  • PV – enable/disable the volume profile.
  • PL – volume profile to the left/right.
  • BD - in this mode, each cluster contains the volume concentration rather than the volume itself. The cluster volume may be relatively small or even imperceptible, but its high concentration per time unit indicates high activity on this candle (candles) and on the given price level.
  • OI - enable/disable the open interest mode obtained mathematically by consecutive zeroing of mutually absorbing volumes. Only the volumes unaffected by the operation are left to be displayed in the clusters and the profile.
  • NM – enable/disable the mode of line-by-line splicing of adjacent clusters.
  • VT – volume scale:
    • VT – tick volumes
    • VR – real volumes
    • VN – without volumes (volumes are emulated according to the TPO principle).
  • BV – enable/disable period frames.
  • RS – reset to default settings.


Inputs

  • DigitsFontSize – font size of labels on clusters.
  • BordersFontSize – font size of labels above the period frames.
  • Auto sorting of clusters is performed in increments of 1/6. As a result, we have six color graduations. The color matching of these cluster graduations can be adjusted with color variables: LowestBoxColor - up to 1/6, LowBoxColor - up to 2/6, MiddleBoxColor - up to 3/6, MediumBoxColor - up to 4/6, HighBoxColor - up to 5/6, HighestBoxColor - up to 6/6 of the maximum accumulation in the visible area.
  • The manual sorting of clusters is set by users via the following inputs: HighestBoxValue, HighBoxValue, MediumBoxValue, MiddleBoxValue, LowBoxValue and LowestBoxValue that set the upper cluster volume level, above which the cluster receives the appropriate color.

The remaining inputs refer to other color settings, and their purpose is clear from their name.

Avis 7
Maria Angelova
263
Maria Angelova 2024.02.27 10:40 
 

Thank you for a great indicator, it gives a lot of information.

1600005347
217
1600005347 2022.04.08 15:52 
 

good work

karl_luydi
82
karl_luydi 2020.09.28 22:31 
 

Hello Evgeny! I am passing by to thank you for the excellent BoxChart mt5 indicator. I have several 5 star paid indicators, but in my view this one surpassed all. It is very accurate to make entries based on the color code. Really enjoyed! May the Lord God bless you greatly !!!

Produits recommandés
Was: $249  Now: $149   Market Profile defines a number of day types that can help the trader to determine market behaviour. A key feature is the Value Area, representing the range of price action where 70% of trading took place. Understanding the Value Area can give traders valuable insight into market direction and establish the higher odds trade. It is an excellent addition to any system you may be using. Inspired by Jim Dalton’s book “Mind Over Markets”, this indicator is designed to suit the
VR Grid Mt5
Vladimir Pastushak
3.25 (8)
L'indicateur VR Grid est conçu pour créer une grille graphique avec des paramètres définis par l'utilisateur. Contrairement à la grille standard , VR Grid est utilisée pour créer des niveaux circulaires . Selon le choix de l'utilisateur, le pas entre les niveaux ronds peut être arbitraire. De plus, contrairement à d'autres indicateurs et utilitaires, VR Grid maintient la position de la grille même lorsque la période de temps change ou que le terminal est redémarré. Les paramètres, les fichiers d
FREE
Blahtech Supply Demand MT5
Blahtech Limited
4.54 (13)
Was: $299  Now: $149  Supply Demand uses previous price action to identify potential imbalances between buyers and sellers. The key is to identify the better odds zones, not just the untouched ones. Blahtech Supply Demand indicator delivers functionality previously unavailable on any trading platform. This 4-in-1 indicator not only highlights the higher probability zones using a multi-criteria strength engine, but also combines it with multi-timeframe trend analysis, previously confirmed swings
This indicator allows you to enjoy the two most popular products for analyzing request volumes and market deals at a favorable price: Actual Depth of Market Chart Actual Tick Footprint Volume Chart This product combines the power of both indicators and is provided as a single file. The functionality of Actual COMBO Depth of Market AND Tick Volume Chart is fully identical to the original indicators. You will enjoy the power of these two products combined into the single super-indicator! Below is
L'indicateur construit les cotations actuelles, qui peuvent être comparées aux cotations historiques et, sur cette base, faire une prévision de l'évolution des prix. L'indicateur dispose d'un champ de texte pour une navigation rapide jusqu'à la date souhaitée. Option : Symbole - sélection du symbole que l'indicateur affichera ; SymbolPeriod - sélection de la période à partir de laquelle l'indicateur prendra des données ; IndicatorColor - couleur de l'indicateur ; HorisontalShift - décalage
VolumeProfile MT5
Robert Hess
4.14 (7)
Description: The Volume Profile displays detailed informations of historical trading activities at certain price levels (Market Profile). Locate the areas with the best prices in the market and get an advantage over other market participants. Features: Customizable Market Profile Shows the "fair" Value Area with 70% of all Volume Shows critical low volume zones Shows VPOC, VAL and VAH Points integrated resource management to reduce the load while working with multiple charts Works on all timefr
The professional tool of stock traders in now available on MetaTrader 5 . The Actual depth of market chart indicator visualizes the depth of market in the form of a histogram displayed on a chart, which refreshes in the real-time mode. Meet new updates according to user requests! Now Actual Depth of Market indicator displays the current ratio of volume of buy and sell requests (B/S ratio). It shows the share of volume of each type of requests in the entire flow of requests as well as the absolu
Order Book, known also as Market Book, market depth, Level 2, - is a dynamically updated table with current volumes of orders to buy and to sell specific financial instument at price levels near Bid and Ask. MetaTrader 5 provides the means for receiving market book from your broker, but in real time only, without access to its history. The indicator OrderBook Cumulative Indicator accumulates market book data online and visualizes them on the chart. In addition, the indicator can show the market
Mt5 Market Profile
Mcblastus Gicharu Ndiba
Market Profile Introducing the Market Profile MetaTrader Indicator—your gateway to mastering market dynamics with precision and insight. This powerful tool delivers a classic Market Profile analysis, revealing price density over time and highlighting crucial levels, including the value area and control value for any trading session.  Compatible with timeframes from M1 to D1, it adapts to daily, weekly, monthly, or even intraday sessions, offering you unmatched flexibility. Lower timeframes prov
Volume Profile V6
Andrey Kolesnik
4.5 (2)
The volume profile indicator of the market + a S mart oscillator . It works on almost all instruments - currency pairs , stocks , futures , cryptocurrency , on real volumes and on tick ones . You can set both the automatic definition of the profile range , for example , for a week or a month , etc . , and set the range manually by moving the boundaries ( two vertical lines red and blue ) . It is shown as a histogram . The width of the histogram at this level means , conditionally , the number of
Avant d'installer l'indicateur HeatMap assurez vous d'utiliser un broker qui vous donne accès au Depth of market (DOM) !! Cet indicateur crée sur votre graphiques une heatmap vous permettant de voir les ordres limites d'achat ou de vente facilement et en temps réel. Vous avez la possibilité de changer de réglage et les couleurs de la HeatMap afin de s'adapter à  tous les marchés et à tous les graphiques. Voici un exemple de réglage que vous pouvez utiliser  avec le SPX500 sur le broker AMPGloba
To download MT4 version please click here . - This is the exact conversion from TradingView: "Trend Direction Force Index - TDFI [wm]" By "causecelebre". - The screenshot shows similar results from tradingview and Metatrader when tested on ICMarkets on both platforms. - This indicator uses multiple levels of averaging to detect trend strength. - You can optimize filter low and filter high levels to achieve best results. - You have access to buffers to use in EAs. - This is a light-load processin
An ICT fair value gap is a trading concept that identifies market imbalances based on a three-candle sequence. The middle candle has a large body while the adjacent candles have upper and lower wicks that do not overlap with the middle candle. This formation suggests that there is an imbalance where buying and selling powers are not equal. Settings Minimum size of FVG (pips) -> FVGs less than the indicated pips will be not be drawn Show touched FVGs Normal FVG color -> color of FVG that hasn't
FREE
AW Candle Patterns
AW Trading Software Limited
L'indicateur AW Candle Patterns est une combinaison d'un indicateur de tendance avancé combiné à un puissant scanner de modèles de bougies. C'est un outil utile pour reconnaître et mettre en évidence les trente modèles de chandeliers les plus fiables. De plus, c'est un analyseur de tendance actuel basé sur des barres colorées avec un       panneau de tendance multi-période plug-in qui peut être redimensionné et positionné. Une possibilité unique d'ajuster l'affichage des motifs en fonction du fi
PivotWave
Jeffrey Quiatchon
Introducing PivotWave – your ultimate trading companion that redefines precision and market analysis. Designed with traders in mind, PivotWave is more than just an indicator; it’s a powerful tool that captures the pulse of the market, identifying key turning points and trends with pinpoint accuracy. PivotWave leverages advanced algorithms to provide clear visual signals for optimal entry and exit points, making it easier for traders to navigate volatile market conditions. Whether you are a begin
Le niveau Premium est un indicateur unique avec une précision de plus de 80 % des prédictions correctes ! Cet indicateur a été testé par les meilleurs Trading Specialists depuis plus de deux mois ! L'indicateur de l'auteur que vous ne trouverez nulle part ailleurs ! À partir des captures d'écran, vous pouvez constater par vous-même la précision de cet outil ! 1 est idéal pour le trading d'options binaires avec un délai d'expiration de 1 bougie. 2 fonctionne sur toutes les paires de devises
UPD1 Profile Levels MT5
Vitaliy Kuznetsov
5 (3)
L'indicateur trouve les niveaux de volume de prix maximum et minimum (profil de marché) sur l'histogramme de travail pour le nombre de barres spécifié.   Profil composite. La hauteur de l'histogramme est entièrement automatique et s'adapte à n'importe quel outil et période. L'algorithme de l'auteur est utilisé et ne répète pas les analogues connus. La hauteur des deux histogrammes est approximativement égale à la hauteur moyenne de la bougie. Smart alert vous permet de vous informer sur le prix
Advanced Volume Profile Analysis Tool for MetaTrader 5 The Kecia Volume Profile Order Finder provides traders with volume profile analysis capabilities. This MT5 indicator combines volume profile visualization with statistical calculations to help identify potential trading opportunities and suggests entry, stop loss, and take profit levels based on market structure. Market Profile Visualization Transform your chart with customizable volume profile visualizations: Multiple visualization options
L'indicateur SMC Venom Model BPR est un outil professionnel pour les traders travaillant dans le concept Smart Money (SMC). Il identifie automatiquement deux modèles clés sur le graphique des prix: FVG   (Fair Value Gap) est une combinaison de trois bougies, dans laquelle il y a un écart entre la première et la troisième bougie. Forme une zone entre les niveaux où il n'y a pas de support de volume, ce qui conduit souvent à une correction des prix. BPR   (Balanced Price Range) est une combinaiso
Haven Volume Profile
Maksim Tarutin
4 (3)
Haven Volume Profile est un indicateur multifonctionnel pour l'analyse du profil de volume qui aide à identifier les niveaux de prix clés basés sur la répartition du volume de négociation. Il a été conçu pour les traders professionnels qui souhaitent mieux comprendre le marché et identifier les points d'entrée et de sortie importants pour leurs transactions. Autres produits ->  ICI Fonctionnalités principales : Calcul du Point of Control (POC) - le niveau d'activité commerciale maximal, ce qui a
FREE
This is a multi-symbol and multi-timeframe table-based indicator designed for a candlestick patterns detection with 46 patterns for META TRADER 5. Each formation has own image for easier recognition. Here you find most popular formations such as "Engulfing", "Hammer", "Three Line Strike", "Piercing" or Doji - like candles. Check my full list of patterns on my screenshots below. Also you can not only switch all bearish or bullish patterns from input, but also select formation for a specified symb
Includes almost all the concepts related to Volume Profile: POC , Value Area , Developing POC , Anchored VWAP , Volume Delta ; since the “Total” in its name. It is fast in its calculations and simple to work with. Features: 1.    Selectable calculation timeframe to find most traded levels. 2.    Capable of calculating Volume Profile based on tick data 3.    Adjustable histogram bars by their count. 4.    Adjustable histogram bars by their height (price range). 5.    Showing Value Area (VA
VolumeDeltaBars
Stanislav Korotky
This indicator is a conventional analytical tool for tick volumes changes. It calculates tick volumes for buys and sells separately, and their delta on every bar, and displays volumes by price clusters (cells) within a specified bar (usually the latest one). The algorithm used internally is the same as in the indicator VolumeDeltaMT5 , but results are shown as cumulative volume delta bars (candlesticks). Analogous indicator for MetaTrader 4 exists - CumulativeDeltaBars . This is a limited substi
Wapv Price and volume
Eduardo Da Costa Custodio Santos
L'indicateur de prix et de volume WAPV pour MT5 fait partie de l'ensemble d'outils (Wyckoff Academy Wave Market) et (Wyckoff Academy Price and Volume). L'indicateur de prix et de volume WAPV pour MT5 a été créé pour faciliter la visualisation intuitive du mouvement du volume sur le graphique. Avec lui, vous pouvez observer les moments de pic de volume et les moments où le marché n'a aucun intérêt professionnel Identifiez les moments où le marché évolue par inertie et non par mouvement de "smart
Volume Delta Candle
Muhammad Muzaffar Hussan
Volume Delta Candles: A Comprehensive Tool for In-Depth Trading Analysis Unlock a seamless way to interpret trading experience within each candle. With Volume Delta Candles, there's no need for additional volume indicators—everything you need is built in. This advanced tool utilizes lower timeframes or live market data to present the percentage of buying versus selling volume within each candle as an intuitive color-coded bar. Before diving in, ensure you’re familiar with Volume and Volume Delta
AVIS IMPORTANT – LICENCE ET ACTIVATION REQUISES Instructions d’Activation : Après avoir finalisé votre achat, veuillez nous contacter immédiatement pour recevoir votre clé de licence, mot de passe ou détails d’activation. Sans ces éléments, le logiciel ne fonctionnera pas. Nous sommes là pour garantir un processus d’activation fluide et répondre à toutes vos questions. Personnalisation Multilingue Pour améliorer votre expérience de trading, nous proposons une personnalisation complète du
Volumes Direction MT5
William Oswaldo Mayorga Urduy
VOLUMES DIRECTION MT5 Normalement, l'indicateur de volume a un changement de couleur par défaut lorsque le volume actuel est plus élevé que le précédent, c'est important mais pas très utile. Pour cette raison, cet indicateur a été créé pour qu'en plus du volume normal, lorsque la bougie est haussière ou baissière, il les peint d'une couleur différente, par défaut bleu pour haussier et rouge pour baissier, mais ces couleurs peuvent être personnalisées selon le Le goût du commerçant. N'oubli
L'unicité de cet indicateur réside dans l'algorithme de comptabilisation des volumes : l'accumulation se fait directement pour la période sélectionnée sans référence au début de la journée. Les dernières barres peuvent être exclues du calcul, alors les données courantes auront moins d'influence sur les niveaux significatifs (volumes) formés précédemment. Pour un calcul plus précis, les données du graphique M1 sont utilisées par défaut. L'étape de répartition des volumes de prix est réglementée.
Below is the translation of your original English text into French: AVIS IMPORTANT – LICENCE ET ACTIVATION REQUISES Instructions d’activation : Dès que vous avez terminé votre achat, veuillez nous contacter immédiatement pour recevoir votre clé de licence, votre mot de passe ou les détails d’activation. Sans ces éléments, le logiciel ne fonctionnera pas. Nous sommes là pour garantir un processus d’activation fluide et vous assister en cas de questions. Personnalisation multilingue Po
Trade smarter, not harder: Empower your trading with Harmonacci Patterns This is arguably the most complete harmonic price formation auto-recognition indicator you can find for the MetaTrader Platform. It detects 19 different patterns, takes fibonacci projections as seriously as you do, displays the Potential Reversal Zone (PRZ) and finds suitable stop-loss and take-profit levels. [ Installation Guide | Update Guide | Troubleshooting | FAQ | All Products ] It detects 19 different harmonic pri
Les acheteurs de ce produit ont également acheté
Divergence Bomber
Ihor Otkydach
5 (27)
Chaque acheteur de cet indicateur reçoit également gratuitement : L’outil exclusif « Bomber Utility », qui accompagne automatiquement chaque opération de trading, fixe les niveaux de Stop Loss et de Take Profit, et clôture les positions selon les règles de la stratégie Des fichiers de configuration (set files) pour adapter l’indicateur à différents actifs Des set files pour configurer le Bomber Utility selon différents modes : « Risque Minimum », « Risque Équilibré » et « Stratégie d’Attente » U
Algo Pumping
Ihor Otkydach
5 (14)
PUMPING STATION – Votre stratégie personnelle «tout compris» Nous vous présentons PUMPING STATION – un indicateur Forex révolutionnaire qui transformera votre façon de trader en une expérience à la fois efficace et passionnante. Ce n’est pas seulement un assistant, mais un véritable système de trading complet, doté d’algorithmes puissants pour vous aider à trader de manière plus stable. En achetant ce produit, vous recevez GRATUITEMENT : Fichiers de configuration exclusifs : pour un réglage auto
Trend Screener Pro MT5
STE S.S.COMPANY
4.86 (84)
Indicateur de tendance, solution unique révolutionnaire pour le trading et le filtrage des tendances avec toutes les fonctionnalités de tendance importantes intégrées dans un seul outil ! Il s'agit d'un indicateur multi-période et multi-devises 100 % non repeint qui peut être utilisé sur tous les symboles/instruments : forex, matières premières, crypto-monnaies, indices et actions. Trend Screener est un indicateur de suivi de tendance efficace qui fournit des signaux de tendance fléchés avec des
Combien de fois avez-vous acheté un indicateur de trading avec d' excellents backtests, des preuves de performance sur compte réel avec des chiffres fantastiques et des statistiques partout , mais après l'avoir utilisé, vous finissez par faire sauter votre compte ? Vous ne devriez pas faire confiance à un signal seul, vous devez savoir pourquoi il est apparu en premier lieu, et c'est ce que RelicusRoad Pro fait de mieux ! Manuel d'utilisation + Stratégies + Vidéos de formation + Groupe privé ave
Gold Stuff mt5
Vasiliy Strukov
4.93 (186)
Gold Stuff mt5 est un indicateur de tendance conçu spécifiquement pour l'or et peut également être utilisé sur n'importe quel instrument financier. L'indicateur ne se redessine pas et ne traîne pas. Délai recommandé H1. Contactez-moi immédiatement après l'achat pour obtenir les réglages et un bonus personnel !   Vous pouvez obtenir une copie gratuite de notre indicateur Strong Support et Trend Scanner, veuillez envoyer un message privé. moi!   RÉGLAGES Dessiner la flèche - on off. dessiner d
Enigmera MT5
Ivan Stefanov
5 (1)
ENIGMERA : Le cœur du marché Introduction Cet indicateur et système de trading représentent une approche remarquable des marchés financiers. ENIGMERA utilise les cycles fractals pour calculer avec précision les niveaux de support et de résistance. Il met en évidence la phase réelle d’accumulation et fournit orientation et objectifs — un système efficace aussi bien en tendance qu’en correction. Fonctionnement La majorité des fonctionnalités de l’indicateur se contrôle via des boutons situés à g
*** Entry In The Zone et SMC Multi Timeframe est un outil d’analyse de marché en temps réel basé sur le concept Smart Money Concept (SMC). Il intègre efficacement des signaux de retournement et identifie automatiquement les zones de retournement clés grâce à la détection de structures multi-timeframes, ainsi que l’identification des Points d'Intérêt (POI). Cet outil est conçu pour aider les traders à planifier et à prendre des décisions avec plus de confiance et une approche plus structurée. **
L’indicateur met en évidence les zones où un intérêt est manifesté, puis affiche leur zone d’accumulation. Il fonctionne comme un carnet d’ordres à grande échelle. C’est l’indicateur pour les « gros portefeuilles ». Sa performance est exceptionnelle : vous verrez instantanément tout intérêt présent sur le marché. (Ceci est une version entièrement réécrite et automatisée — l’analyse manuelle n’est plus nécessaire.) Transaction Speed est un indicateur de nouvelle génération qui montre où et quand
Grabber System MT5
Ihor Otkydach
5 (7)
Je vous présente un excellent indicateur technique : Grabber, qui fonctionne comme une stratégie de trading "tout-en-un", prête à l'emploi. En un seul code sont intégrés des outils puissants d'analyse technique du marché, des signaux de trading (flèches), des fonctions d'alerte et des notifications push. Chaque acheteur de cet indicateur reçoit également gratuitement : L'utilitaire Grabber : pour la gestion automatique des ordres ouverts Un guide vidéo étape par étape : pour apprendre à installe
FX Levels MT5
Daniel Stein
5 (5)
FX Levels : Des zones de Support et Résistance d’une Précision Exceptionnelle pour Tous les Marchés Présentation Rapide Vous recherchez un moyen fiable pour déterminer des niveaux de support et résistance dans n’importe quel marché—paires de devises, indices, actions ou matières premières ? FX Levels associe la méthode traditionnelle « Lighthouse » à une approche dynamique de pointe, offrant une précision quasi universelle. Grâce à notre expérience réelle avec des brokers et à des mises à jour
Support And Resistance Screener est dans un indicateur de niveau pour MetaTrader qui fournit plusieurs outils à l'intérieur d'un indicateur. Les outils disponibles sont : 1. Filtre de structure de marché. 2. Zone de repli haussier. 3. Zone de recul baissier. 4. Points pivots quotidiens 5. points pivots hebdomadaires 6. Points pivots mensuels 7. Support et résistance forts basés sur le modèle harmonique et le volume. 8. Zones au niveau de la banque. OFFRE D'UNE DURÉE LIMITÉE : L'indicateur de sup
Matrix Arrow Indicator MT5
Juvenille Emperor Limited
5 (14)
Matrix Arrow Indicator MT5   est une tendance unique 10 en 1 suivant un indicateur multi-période   100% non repeint   qui peut être utilisé sur tous les symboles/instruments:   forex ,   matières premières ,   crypto-monnaies ,   indices ,  actions .  Matrix Arrow Indicator MT5  déterminera la tendance actuelle à ses débuts, en rassemblant des informations et des données à partir d'un maximum de 10 indicateurs standard, qui sont: Indice de mouvement directionnel moyen (ADX) Indice de canal de m
MonetTrend — Премиум-индикатор для торговли по тренду (M30, H1, H4) MonetTrend — это мощный и визуально понятный трендовый индикатор, созданный для торговли на таймфреймах M30, H1 и H4. Он идеально подходит для работы с волатильными инструментами, такими как: • Золото (XAUUSD) • Криптовалюты (BTCUSD) • Валютные пары (EURUSD, USDJPY и др.) Ключевые особенности MonetTrend: • Автоматическое отображение Take Profit 1 (TP1) и Stop Loss (SL): После появления сигнала индикатор сразу показывает: • TP
TPSpro RFI Levels MT5
Roman Podpora
4.55 (20)
Zones de retournement / Volumes de pointe / Zones actives d'un acteur majeur =       SYSTÈME TS TPSPRO INSTRUCTIONS RUS       /       INSTRUCTIONS       FR       /           Version MT4        Chaque acheteur de cet indicateur reçoit en plus GRATUITEMENT : 6 mois d'accès aux signaux de trading du service RFI SIGNALS - points d'entrée prêts à l'emploi selon l'algorithme TPSproSYSTEM. Supports de formation avec mises à jour régulières - plongez-vous dans la stratégie et développez votre niveau p
FX Power MT5 NG
Daniel Stein
5 (17)
FX Power : Analysez la force des devises pour des décisions de trading plus intelligentes Aperçu FX Power est l'outil essentiel pour comprendre la force réelle des principales devises et de l'or, quelles que soient les conditions du marché. En identifiant les devises fortes à acheter et les faibles à vendre, FX Power simplifie vos décisions de trading et révèle des opportunités à forte probabilité. Que vous suiviez les tendances ou anticipiez les retournements à l'aide de valeurs extrêmes de D
FX Volume MT5
Daniel Stein
4.84 (19)
FX Volume : Découvrez le Sentiment du Marché tel que perçu par un Courtier Présentation Rapide Vous souhaitez faire passer votre approche de trading au niveau supérieur ? FX Volume vous fournit, en temps réel, des informations sur la manière dont les traders particuliers et les courtiers sont positionnés—bien avant la publication de rapports retardés comme le COT. Que vous visiez des gains réguliers ou recherchiez simplement un avantage plus solide sur les marchés, FX Volume vous aide à repére
Quantum TrendPulse
Bogdan Ion Puscasu
5 (14)
Présentation de   Quantum TrendPulse   , l'outil de trading ultime qui combine la puissance de   SuperTrend   ,   RSI   et   Stochastic   dans un seul indicateur complet pour maximiser votre potentiel de trading. Conçu pour les traders qui recherchent précision et efficacité, cet indicateur vous aide à identifier les tendances du marché, les changements de dynamique et les points d'entrée et de sortie optimaux en toute confiance. Caractéristiques principales : Intégration SuperTrend :   suivez f
FX Dynamic MT5
Daniel Stein
5 (1)
FX Dynamic : Suivez la volatilité et les tendances grâce à une analyse ATR personnalisable Vue d’ensemble FX Dynamic est un outil performant s’appuyant sur les calculs de l’Average True Range (ATR) pour fournir aux traders des informations incomparables sur la volatilité quotidienne et intrajournalière. En définissant des seuils de volatilité clairs — par exemple 80 %, 100 % et 130 % — vous pouvez rapidement repérer des opportunités de profit ou recevoir des avertissements lorsque le marché dé
The   Kecia Market News Detector  is a cutting-edge MT5 indicator designed to detect and quantify the impact of news events and market anomalies across multiple currency pairs in real-time. By leveraging 20+ advanced statistical metrics, this tool identifies abnormal market behavior, liquidity shifts, and volatility regimes often triggered by economic news, geopolitical events, or institutional order flow. Key Features: Multi-Symbol Dashboard : Monitor up to 30 currency pairs simultaneously in a
Atomic Analyst MT5
Issam Kassas
4.26 (19)
Tout d'abord, il convient de souligner que cet indicateur de trading n'est ni repainting, ni redrawing et ne présente aucun délai, ce qui le rend idéal à la fois pour le trading manuel et automatisé. Manuel de l'utilisateur : réglages, entrées et stratégie. L'Analyste Atomique est un indicateur d'action sur les prix PA qui utilise la force et le momentum du prix pour trouver un meilleur avantage sur le marché. Équipé de filtres avancés qui aident à éliminer les bruits et les faux signaux, et à
Tout d'abord, il convient de souligner que cet outil de trading est un indicateur non repeint, non redessiné et non retardé, ce qui le rend idéal pour le trading professionnel. Cours en ligne, manuel utilisateur et démonstration. L'indicateur Smart Price Action Concepts est un outil très puissant à la fois pour les nouveaux et les traders expérimentés. Il regroupe plus de 20 indicateurs utiles en un seul, combinant des idées de trading avancées telles que l'analyse du trader Inner Circle et le
IX Power MT5
Daniel Stein
4.88 (8)
IX Power : Découvrez des insights de marché pour les indices, matières premières, cryptomonnaies et forex Vue d’ensemble IX Power est un outil polyvalent conçu pour analyser la force des indices, matières premières, cryptomonnaies et symboles forex. Tandis que FX Power offre une précision maximale pour les paires de devises en utilisant toutes les données disponibles, IX Power se concentre exclusivement sur les données du symbole sous-jacent. Cela fait de IX Power un excellent choix pour les m
Easy Buy Sell is a market indicator for opening and closing positions. It becomes easy to track market entries with alerts. It indicates trend reversal points when a price reaches extreme values ​​and the most favorable time to enter the market. it is as effective as a Fibonacci to find a level but it uses different tools such as an algorithm based on ATR indicators and Stochastic Oscillator. You can modify these two parameters as you wish to adapt the settings to the desired period. It cannot
Atbot
Zaha Feiz
4.65 (48)
AtBot : Comment ça fonctionne et comment l'utiliser ### Comment ça fonctionne L'indicateur "AtBot" pour la plateforme MT5 génère des signaux d'achat et de vente en utilisant une combinaison d'outils d'analyse technique. Il intègre la Moyenne Mobile Simple (SMA), la Moyenne Mobile Exponentielle (EMA) et l'indice de la Plage Vraie Moyenne (ATR) pour identifier les opportunités de trading. De plus, il peut utiliser des bougies Heikin Ashi pour améliorer la précision des signaux. Laissez un avis ap
CRT Liquidity Pro
Juan Pablo Castro Forero
5 (1)
Inquiet pour votre prochain trade ? Fatigué de ne pas savoir si votre stratégie fonctionne vraiment ? Avec CRT Liquidity Pro, vous tradez avec des statistiques réelles, pas des émotions. Connaissez vos probabilités, suivez vos performances et tradez avec confiance — basé sur la Puissance de 3, la détection intelligente de liquidité et les confirmations CRT. Voulez-vous voir la réalité de la stratégie CRT Liquidity ? Après votre achat, contactez-nous et nous vous offrirons gratuitement l’un de n
Tout d'abord, il convient de souligner que ce système de trading est un indicateur non repeint, non redessiné et non retardé, ce qui le rend idéal pour le trading manuel et automatisé. Cours en ligne, manuel et téléchargement de préréglages. Le "Système de Trading Smart Trend MT5" est une solution de trading complète conçue pour les traders débutants et expérimentés. Il combine plus de 10 indicateurs premium et propose plus de 7 stratégies de trading robustes, ce qui en fait un choix polyvalent
TPSproTREND PrO MT5
Roman Podpora
4.72 (18)
VERSION MT4        —        ИНСТРУКЦИЯ RUS           —        INSTRUCTIONS  ENG Fonctions principales : Signaux d'entrée précis SANS RENDU ! Si un signal apparaît, il reste d’actualité ! Il s'agit d'une différence importante par rapport aux indicateurs de redessinage, qui peuvent fournir un signal puis le modifier, ce qui peut entraîner une perte de fonds en dépôt. Vous pouvez désormais entrer sur le marché avec plus de probabilité et de précision. Il existe également une fonction de coloration
PZ Trend Trading MT5
PZ TRADING SLU
3.8 (5)
Capture every opportunity: your go-to indicator for profitable trend trading Trend Trading is an indicator designed to profit as much as possible from trends taking place in the market, by timing pullbacks and breakouts. It finds trading opportunities by analyzing what the price is doing during established trends. [ Installation Guide | Update Guide | Troubleshooting | FAQ | All Products ] Trade financial markets with confidence and efficiency Profit from established trends without getting whip
- Real price is 80$ - 50% Discount (It is 39$ now) Contact me for instruction, any questions! - Lifetime update free - Non-repaint - I just sell my products in Elif Kaya Profile, any other websites are stolen old versions, So no any new updates or support. Advantages of  M1 Scalper Pro  Profitability: M1 Scalper Pro is highly profitable with a strict exit strategy. Frequent Opportunities: M1 Scalper Pro  takes advantage of numerous small price changes. Minimal Market Risk: Limited exposure redu
Stratos Pali mt5
Michela Russo
4.43 (7)
Stratos Pali Indicator is a revolutionary tool designed to enhance your trading strategy by accurately identifying market trends. This sophisticated indicator uses a unique algorithm to generate a complete histogram, which records when the trend is Long or Short. When a trend reversal occurs, an arrow appears, indicating the new direction of the trend. Important Information Revealed Leave a review and contact me via mql5 message to receive My Top 5 set files for Stratos Pali at no cost ! Down
Plus de l'auteur
AnyProfile MT5
Evgeny Shevtsov
5 (17)
The indicator displays market profiles of any duration in any place on the chart. Simply create a rectangle on the chart and this rectangle will be automatically filled by the profile. Change the size of the rectangle or move it - the profile will automatically follow the changes. Operation features The indicator is controlled directly from the chart window using the panel of buttons and fields for entering parameters. In the lower right corner of the chart window there is a pop-up "AP" button
The balance of supply and demand is a simple and effective market analysis method. The supply and demand diagram can show you in advance, even before the trend reversal, where the supply ends and the demand is already emerging, where the demand ends and the supply is emerging, while substantially increasing the probability of making a deal in the right direction and with a high profit factor. Indicator signals The indicator uses the price/volume values to generate signals: ED – excess demand. E
Cumulative Delta MT5
Evgeny Shevtsov
4.54 (56)
The indicator analyzes the volume scale and splits it into two components - seller volumes and buyer volumes, and also calculates the delta and cumulative delta. The indicator does not flicker or redraw, its calculation and plotting are performed fairly quickly, while using the data from the smaller (relative to the current) periods. The indicator operation modes can be switched using the Mode input variable: Buy - display only the buyer volumes. Sell - display only the seller volumes. BuySell -
FREE
The indicator refers to the means of probabilistic analysis. Prediction is performed by the Monte Carlo method together with a mathematical model of a neuron. But, the modeling of samples for this method is made not artificially, but comes from the original "nature", that is, from history. The number of samples and the detail of their modeling is achieved using the lower (relative current) timeframe. Indicator algorithm : In general terms, the algorithm boils down to the fact that the indica
BoxProfile MT5
Evgeny Shevtsov
4.56 (9)
The indicator displays volume profiles based on the nesting principle. Profiles periods are pre-set so that each subsequent profile has a length twice as long as the length of the previous profile. In addition to profiles, the indicator displays volume clusters sorted by color, depending on the volume they contain. Indicator operation features The indicator works on typical timeframes from M5 to MN, but for calculations uses historical data from smaller timeframes: M1 - for timeframes from M5
FREE
Smart Depth Of Market
Evgeny Shevtsov
4.29 (17)
The indicator displays the orders book, as well as increases its depth, remembering the location of orders that have gone beyond the current "window" view. Indicator capability Display the levels of open positions. Simulation of placing/cancelling/editing pending orders directly in the displayed orders book. Indicator features The orders book display works only on those trading symbols for which it is broadcast by the broker. To reset the information about the rows that were recorded in the Sm
FREE
Cumulative Delta MT4
Evgeny Shevtsov
4.87 (30)
The indicator analyzes the volume scale and splits it into two components - seller volumes and buyer volumes, and also calculates the delta and cumulative delta. The indicator does not flicker or redraw, its calculation and plotting are performed fairly quickly, while using the data from the smaller (relative to the current) periods. The indicator operation modes can be switched using the Mode input variable: Buy - display only the buyer volumes. Sell - display only the seller volumes. BuySell -
FREE
Clusters Chart MT5
Evgeny Shevtsov
5 (6)
The indicator displays volume clusters or volume profiles to choose from. For trading symbols which contain the tape of deals, the indicator can perform calculations based on the tape of deals. Input variables StepPoint  - cluster step in points, if the value is zero, the step is assigned automatically. HistoryTicks  - size of tick history (for VolumeType in the mode TimeAndSales). AssociatedTimeframe  - binding the indicator to the specified timeframe of the chart, if the value is equal to Cu
BoxInside MT5
Evgeny Shevtsov
5 (4)
This indicator calculates the volume profile and places labels that correspond to the VAH, VAL and POC levels, for each candle individually. Indicator operation features The indicator works on the timeframes from M3 to MN, but it uses the history data of smaller periods: M1 - for periods from M3 to H1, M5 - for periods from H2 to H12, M30 - for the D1 period, H4 - for the W1 period, D1 - for the MN period. The color and location of the VAL, VAH and POC labels on the current candle are considere
FREE
FORTS Trading Data
Evgeny Shevtsov
5 (1)
The indicator has been designed for use on FORTS, but it can also work on other markets, at brokers broadcasting the required data. A peculiarity of these data is that they cannot be requested from the broker's server as a section of history, but can only be obtained for the current moment. The indicator periodically requests the broker, collects to a file and displays the following history from the stored file: The weighted average price. The volume of buy pending orders. The volume of sell pen
FREE
Time And Sales Delta
Evgeny Shevtsov
5 (2)
The indicator displays the delta and the cumulative delta based on the "Time & Sales" deals list data. In addition to the standard timeframes, the indicator displays data regarding the seconds timeframes (S5, S10, S15, S20, S30) to choose from. Using the rectangle, user can select an arbitrary area in the indicator subwindow to view the ratio of the volumes of deals of buyers and sellers within this area. Indicator features: The indicator works correctly only on those trading symbols for which
BoxProfile MT4
Evgeny Shevtsov
4.92 (12)
The indicator displays volume profiles based on the nesting principle. Profiles periods are pre-set so that each subsequent profile has a length twice as long as the length of the previous profile. In addition to profiles, the indicator displays volume clusters sorted by color, depending on the volume they contain. Indicator operation features The indicator works on typical timeframes from M5 to MN, but for calculations uses historical data from smaller timeframes: M1 - for timeframes from M5
FREE
BoxInside MT4
Evgeny Shevtsov
4.86 (7)
This indicator calculates the volume profile and places labels that correspond to the VAH, VAL and POC levels, for each candle individually. Indicator operation features The indicator works on the timeframes from M5 to MN, but it uses the history data of smaller periods: M1 - for periods from M5 to H1, M5 - for the H4 period, M30 - for the D1 period, H4 - for the W1 period, D1 - for the MN period. The color and location of the VAL, VAH and POC labels on the current candle are considered to be c
FREE
The balance of supply and demand is a simple and effective market analysis method. The supply and demand diagram can show you in advance, even before the trend reversal, where the supply ends and the demand is already emerging, where the demand ends and the supply is emerging, while substantially increasing the probability of making a deal in the right direction and with a high profit factor. Indicator Signals The indicator uses the price/volume values to generate signals: ED – excess demand. E
Clusters Chart MT4
Evgeny Shevtsov
5 (6)
The indicator displays volume clusters or volume profiles to choose from. Input variables StepPoint  - cluster step in points, if the value is zero, the step is assigned automatically. AssociatedTimeframe  - binding the indicator to the specified timeframe of the chart, if the value is equal to Current, the indicator works on all timeframes. ClustersVolume  - volume in clusters: All  - all volume. Active  - active volume (which produced the price movement). ClustersAsDelta  - difference betwee
The utility displays the order book, as well as increases its depth, remembering the location of applications that have gone beyond the current "window" view. With the utility user can perform quick trading actions in one click - placing/cancelling/editing of explicit and hidden orders, and also opening/editing positions. Utility features The orders book display works only on those trading symbols for which it is broadcast by the broker. To reset the information about the rows that were recorde
BoxChart MT4
Evgeny Shevtsov
4.5 (6)
The market is unfair if only because 10% of participants manage 90% of funds. An ordinary trader has slim changes to stand against these "vultures". This problem can be solved. You just need to be among these 10%, learn to predict their intentions and move with them. Volume is the only preemptive factor that faultlessly works on any timeframe and symbol. First, the volume appears and is accumulated, and only then the price moves. The price moves from one volume to another. Areas of volume accumu
AnyProfile MT4
Evgeny Shevtsov
5 (25)
The indicator displays market profiles of any duration in any place on the chart. Simply create a rectangle on the chart and this rectangle will be automatically filled by the profile. Change the size of the rectangle or move it - the profile will automatically follow the changes. Operation features The indicator is controlled directly from the chart window using the panel of buttons and fields for entering parameters. In the lower right corner of the chart window there is a pop-up "AP" button
Market Marker MT4
Evgeny Shevtsov
5 (8)
The indicator displays peak levels of activity formed by the maximum volume, tracks the correlation of the candles on all timeframes (from the highest to the lowest one). Each volume level is a kind of key trading activity. The most important cluster is inside a month, week, day, hour, etc. Indicator operation features A volume level receives Demand status if the nearest volume level located to the left and above has been broken upwards. A volume level receives Supply status if the nearest volu
The utility refers to probabilistic analysis tools, in particular the Monte Carlo method. The Monte Carlo method is defined as the simulation of processes in purpose to evaluate their probabilistic characteristics and apply them to the solvable task. Operation features The simulation uses a tick model with the subsequent transformation to the candles form, as a model as close as possible to the real market process. The utility generates a stream of a random tick sequence until a result with the
The indicator calculates volume profiles dynamically and displays the result as VAL, VAH and POC curves. Indicator features The indicator uses the historical data of the lower (relative to the current) timeframes for calculations: M1 - for timeframes up to H1, M5 - for timeframe H1, M15 - for timeframe H4, H1 - for timeframe D1, H4 - for timeframe W1, D1 - for timeframe MN. The color of the DPOC curve sections is determined by comparing the volume of the POC levels of all profiles that make up
Neural Predictor MT4
Evgeny Shevtsov
2 (1)
The indicator refers to the means of probabilistic analysis. Prediction is performed by the Monte Carlo method together with a mathematical model of a neuron. But, the modeling of samples for this method is made not artificially, but comes from the original "nature", that is, from history. The number of samples and the detail of their modeling is achieved using the lower (relative current) timeframe. Indicator algorithm : In general terms, the algorithm boils down to the fact that the indica
Market Marker MT5
Evgeny Shevtsov
3.8 (5)
The indicator displays peak levels of activity formed by the maximum volume, tracks the correlation of the candles on all timeframes (from the highest to the lowest one). Each volume level is a kind of key trading activity. The most important cluster is inside a month, week, day, hour, etc. Indicator operation features A volume level receives Demand status if the nearest volume level located to the left and above has been broken upwards. A volume level receives Supply status if the nearest volu
The utility refers to probabilistic analysis tools, in particular the Monte Carlo method. The Monte Carlo method is defined as the simulation of processes in purpose to evaluate their probabilistic characteristics and apply them to the solvable task. Operation features The simulation uses a tick model with the subsequent transformation to the candles form, as a model as close as possible to the real market process. The utility generates a stream of a random tick sequence until a result with th
Dynamic POC MT5
Evgeny Shevtsov
5 (1)
The indicator calculates volume profiles dynamically and displays the result as VAL, VAH and POC curves. Indicator features The indicator uses the historical data of the lower (relative to the current) timeframes for calculations: M1 - for timeframes up to H1, M5 - for timeframe H1, M15 - for timeframe H4, H1 - for timeframe D1, H4 - for timeframe W1, D1 - for timeframe MN. The color of the DPOC curve sections is determined by comparing the volume of the POC levels of all profiles that make up
The indicator colors the candles relative to their volume delta. The calculation of the candles delta is based on the tick history or on the deals tape history (see below for a description of the input variable "Volumes"). Coloring is performed by two parameters : by delta sign, as candle color, by delta value, as candle color contrast against chart window background color. In addition to coloring the candles, the indicator also displays the delta profile on the interval specified by the user
Filtrer:
Maria Angelova
263
Maria Angelova 2024.02.27 10:40 
 

Thank you for a great indicator, it gives a lot of information.

1600005347
217
1600005347 2022.04.08 15:52 
 

good work

karl_luydi
82
karl_luydi 2020.09.28 22:31 
 

Hello Evgeny! I am passing by to thank you for the excellent BoxChart mt5 indicator. I have several 5 star paid indicators, but in my view this one surpassed all. It is very accurate to make entries based on the color code. Really enjoyed! May the Lord God bless you greatly !!!

Александр Кулев
258
Александр Кулев 2018.02.02 10:49 
 

Все работает, СПАСИБО. Полезная штука!!!!

Nicola  Amati
201
Nicola Amati 2017.12.14 18:34 
 

Спасибо за индикатор!

Отличный помощник в торговле !

Можно точно определять уровни и интенсивность проторговки!

MaximGP
41
MaximGP 2017.12.14 02:43 
 

отличный индикатор

автору спасибо большое!

Vladislav Ilyin
104
Vladislav Ilyin 2016.12.21 21:08 
 

Спасибо автору за отличный и очень полезный индикатор!!!

Répondre à l'avis
Version 4.3 2024.11.09
The indicator has been recompiled in MT5 build 4656.
Version 4.2 2024.04.23
The indicator is recompiled in MT5 build 4275.
Version 4.1 2024.02.09
The indicator is recompiled in MT5 build 4173.
Version 4.0 2023.11.03
The indicator is recompiled in MT5 build 4055.
Version 3.9 2023.05.22
The indicator is recompiled in MT5 build 3742.
Version 3.8 2022.11.30
The indicator is recompiled in MT5 build 3521.
Version 3.7 2022.09.19
Added alert function.
To activate the function, use the input variable “AletBoxColor”, which should be configured as one of the values of the “FilterColors" section.
When the value of “AletBoxColor” is set to “None”, the function is not active.
Version 3.6 2022.05.07
The indicator is recompiled in MT5 build 3280.
Version 3.5 2021.09.23
The indicator is recompiled in MT5 build 3042.
Version 3.4 2021.06.27
The indicator is recompiled in MT5 build 2981.
Version 3.3 2021.03.31
The indicator is recompiled in MT5 build 2860.
Version 3.2 2020.12.01
The indicator is recompiled in MT5 build 2715.
Version 3.1 2020.10.14
The input variable Volumes has been eliminated.
The function of this input variable is now performed by the NM button (former name), which has three states:
- VT – tick volumes
- VR – real volumes
- VN – without volumes (volumes are emulated according to the TPO principle).

The indicator is compiled in MT5 build 2650.
Version 3.0 2020.03.24
The indicator is recompiled in MT5 build 2367.
Version 2.9 2017.12.27
New fields have been added allowing to enter the date/time of the beginning and end of the cluster display area.
All entered values are applied and remembered immediately after you finish entering them, the RS button now only resets indicator parameters to default values.
When you install this version, the indicator settings will be reset to the default values, since settings are now stored in a file, not in global variables.
Version 2.8 2017.07.28
In version 2.8, the value area is highlighted in the profile.
A repeated click on PV (while the profile is enabled) enables the display of horizontal lines of the VAL, VAH and POC levels.
Version 2.7 2017.06.09
Now, the manual sorting of clusters by color is available directly from the chart by entering values to the fields having the appropriate colors. The indicator saves entered data individually for each timeframe.
After entering or changing the values, press RS once to apply them to sorting the clusters. If all six values are equal to zero, the indicator switches to the auto sorting of clusters.
Note: RS button saves its initial function of resetting the indicator to the default modes only if both BSP and BSPP parameters are simultaneously set to zero when pressing it.
Version 2.6 2017.05.25
Improved the algorithm of auto sorting of clusters by color.
Also, added the ability to manually sort clusters by color.
The HighestBoxValue, HighBoxValue, MediumBoxValue, MiddleBoxValue, LowBoxValue and LowestBoxValue inputs allow you to set the upper cluster volume level, above which it receives the appropriate color.
Manual sorting is activated in case of any non-zero value of the mentioned variables except for LowestBoxValue, which can be equal to zero.
Version 2.5 2017.03.28
Fixed errors when drawing boxes of certain periods for the trade symbols traded only during the work day.
Version 2.4 2017.02.24
Adapted the step of the BSP calculation grid to symbols with integer quotation.
Version 2.3 2016.07.28
Fixed the periodic flickering of the indicator.
The indicator automatically determines if the broker broadcasts real volumes and switches to them. If there are no real volumes broadcast, the indicator works with tick volumes.
In addition, the indicator now also works on the W1 and MN periods, period ranges are, respectively - quarterly and annual.
Version 2.1 2016.05.17
Fixed the color errors in the indicator control buttons.
Version 2.0 2016.05.11
Changed the design of the indicator control buttons, therefore added new color variables:
ButtonsColor – background of the control buttons,
ButtonsTrueTextColor – text color of the active button,
ButtonsFalseTextColor – text and border color of the inactive button.
Version 1.9 2015.11.12
Added the button BV – Borders Visible, enable/disable display of period frames.
Added the button RS – Reset, reset the indicator to default settings (only for the selected period).
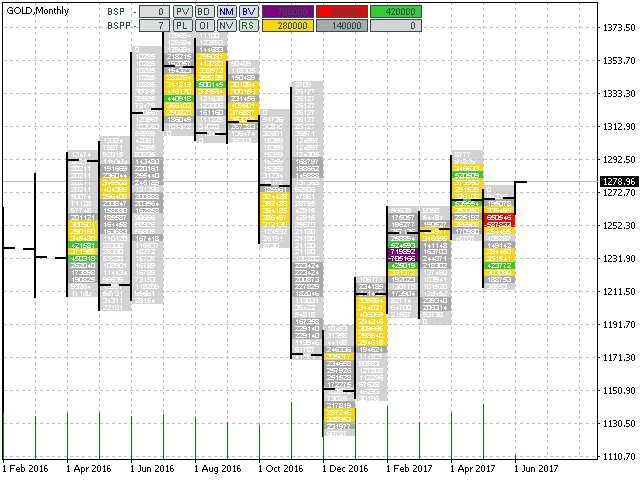
Increased the maximum calculated grid to 500 points. This is especially important for the symbols with a very small point value relative to the chart height, for example, GOLD and some indices.
Expanded the options for increasing a calculated grid in points. You can select from 1, 5, 10, 50, -50, -10, -5, -1.
Like in the version 1.8, the indicator memorizes if the chart shift is enabled, as well as the shift size.
Version 1.8 2015.11.06
Fixed lack of display on a last bar at each Friday in Not Merge mode.
Period frames can now be disabled. If their color is equal to the chart background one, the frames are not displayed.
Added the buttons allowing you to select the grid increment in points and pixels (located near BSP and BSPP ones). First, select an increment (+1, +5 or -5, -1), then click BSP or BSPP button. The calculation grid will then increase/decrease by the specified amount of points/pixels.
The indicator remembers its settings for each period of each symbol, including PV, PL, BD, OI, NM, NV buttons status, calculation grid step, calculation grid increment, as well as some chart parameters: display mode (candles, bars, or lines), tick volume display and horizontal scale. It is very convenient, especially if you frequently switch between periods. The settings are saved, and you do not have to constantly re-adjust them.
In the Not Merge mode, at the maximum horizontal chart scale, a numerical value of volumes is displayed for all boxes/clusters if a box height (in pixels) exceeds that of a font specified by the DigitalFontSize variable. As a result, we can see a common cluster chart for a selected period.
Version 1.7 2015.11.02
Fixed lack of display on the last bar.
Fixed incorrect box marking in the open interest filtration mode (numerical value was marked correctly).
Added the NotMerge function – volume accumulations are not summed up and not clustered into larger boxes. Instead, they are analyzed in each candle separately. The function allows you to analyze the volume map in greater detail. Please note: The function does not freeze but consumes considerable CPU resources, especially at higher timeframes and fine calculation grid.
Shortened button names down to abbreviations to make them smaller:
Bsp – BoxStepPoint, calculation grid step in points.
Bspp – BoxStepPointPix, calculation grid step in monitor pixels.
PV – ProfileVisible, enable/disable profile.
PL – ProfileLeftPosition, profile to the left/right.
BD – BoxDensity, density (concentration), the function is not active in NotMerge mode.
OI – OpenInterest, open interest filtration mode.
NM – NotMerge, described above.
NV – NoVolumes, tick volumes are not used in calculations (pure FootPrint).
Version 1.6 2015.10.21
The main indicator management functions have been moved to the chart buttons.
Volume accumulation areas and profile are now marked with numerical values as labels directly on each box and profile. BoxTextColor and ProfileTextColor variables set the color of the labels. DigitalFontSize variable sets the font size of these labels. Volume accumulations of the Lowest category are not labelled.
Added the OpenInterest function. Volumes - accumulated below and used above (buys followed by a sell) - nullify each other. Volumes - accumulated above and used below (sells followed by a buy) - nullify each other as well. The volumes remaning after the filtration form an open interest. We do not know its direction with certainty, but its location on a chart can be used as a clue. A gradual disappearance of a previously detected open interest means that it has already been used and the market reversal is near. Do not look for an open interest on a long interval. You will not find it due to its occurrence frequency and subsequent implementation. Only the current open interest is important for analysis.
Version 1.5 2015.10.06
A completely new principle of display of volume clusters.
Now we see only volumes on every part of the chart, on each of its candlesticks. For convenience, change the chart to the "line" view, disable the chart display by going to chart properties and setting "none" for its color, and view only volumes on the chart.
The ExcessRemove function has been removed. Now, to remove what you do not need, simply turn off the colors of the boxes you do not want to see.
Version 1.4 2015.10.02
Improved the accumualtion sorting algorithm. Box colors are now more stable and less sensitive to chart scrolling, re-sizing, as well as horizontal and vertical re-scaling.
Amount of price graduations reduced to six. Accumulation sorting step is 1/6 of the maximum accumulation in the visible area.
The color variables are divided into LowestBoxColor - lowest, LowBoxColor - low, MiddleBoxColor - below average, MediumBoxColor - above average, HighBoxColor - high, HighestBoxColor - highest.
Version 1.3 2015.09.25
Fixed enabling/disabling color graduations.
Improved the accumulation sorting algorithm. Box colors are now more stable and less sensitive to chart scrolling, resizing and rescaling in horizontal direction.
Changed the default variable settings. As a result, box colors are now more stable and less sensitive to chart resizing and rescaling in vertical direction. New variable settings can be used on any symbol and timeframe.
Both line and bar charts are now available for display in addition to candles.
Version 1.2 2015.09.21
Added ExcessRemove function: if there are a few adjacent boxes on a random vertical chart axis, only the largest of them is displayed, while the rest ones are removed.
Added BoxDensity function: in this mode, each box shows the volume concentration rather than the total volume. The total volume may be inconsiderable but if its concentration per time unit is high, this is a sign of high activity on that candle(s) and that price level. The function provides good reversal points.
The ProfileLeftPosition variable allows you to set the profile to the right of the chart. If 'true', the profile is located to the left, if 'false' it is located to the right.
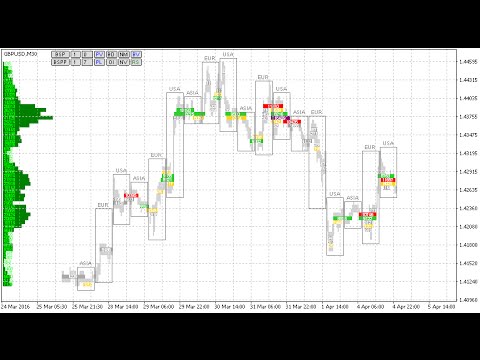
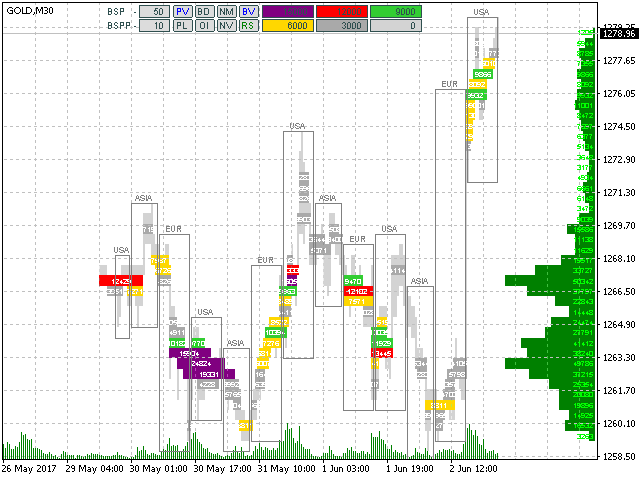
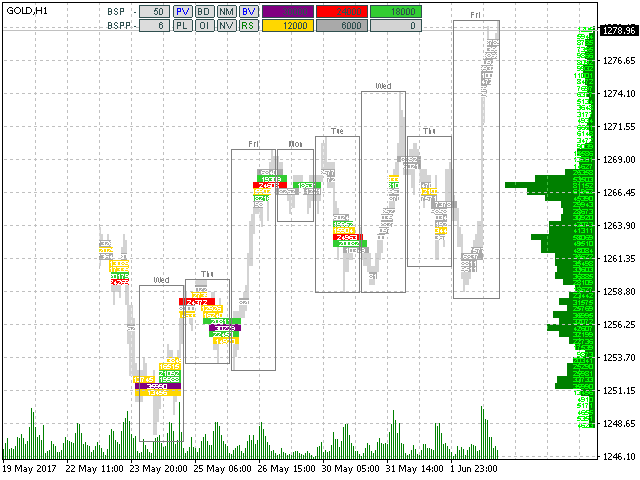
Period frames are now distributed the following way: М1 – M15 frame, М5 – H1 frame, М15 – H4 frame, М30 – session frame, Н1 – daily frame, Н4 – weekly frame.