• Aperçu
  • Avis
  • Commentaires (4)
  • Nouveautés

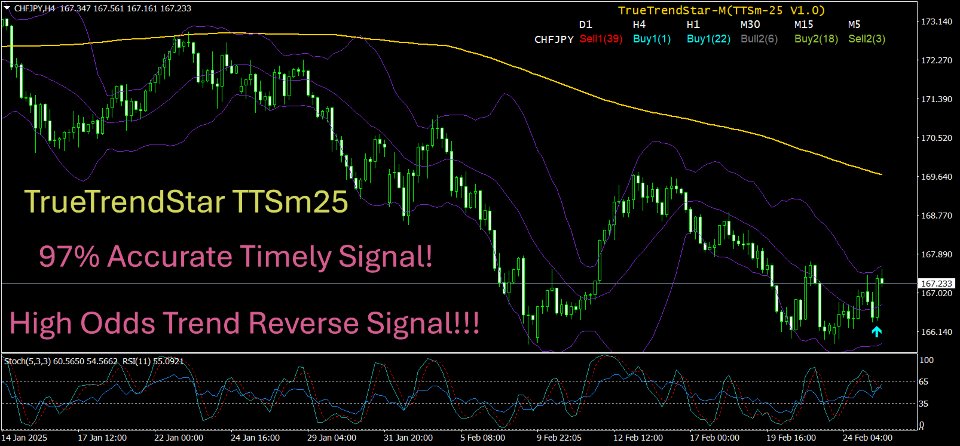
TrueTrendStarM TTSm25

   This is a mini version(One pair) of Advanced Detector of Trend Reversal and Continuance known as TrueTrendStarM(TTSm25). It is a sensitive and Predictive indicator of Price Trends for Professional traders.

 BIG ONE TIME DISCOUNT 50% !!!( Not 20% !)  ( ATTENTION BUYERS:-PLEASE CONTACT ME FOR HOW BEST TO USE THE INDICATOR FOR MAXIMUM PROFITS )

   It detects high odds changes in Price Trend direction long before other indicator detects it. I have been working on it since 2019.

   This is possible due to fractal nature of forex and other financial markets,which this indicator captures it consistently. It can generate Signals for all types of markets viz currency,crypto,metals,energy,Stock etc

   It used an accurate non-repainting custom indicator that scans the single selected currency pair 24hrs in all time-frames and captures the currency pair Trend status in an elegant Dashboard. It also display arrows where the signal occurred for timely and pinpoint entry.

   How will TTS indicator Show Changes in Trend?

   TTS will show When:

  • Uptrend is starting
  • Uptrend is getting weaker
  • DownTrend is starting
  • Downtrend is getting weaker. 

   The indicator signal is non-repainting and high probability and can be used effectively by any traders including Propriety firms.

   One important thing the Trader will notice is the almost immediate movement of price towards the direction of the TTS signal because of its  high probability nature.

   TTS indicator important features

  •  High Probability Trade Signals 
  •  Predicts Trend Direction
  •  Indicate Price Turning Points & Reversals
  •  Indicate Price Trend Continuance Points
  •  Capture short term & long term price action
  •  Indicate Trend Strength & Acceleration
  •  Indicate Signal Freshness
  •  Creates dynamic Support & Resistance levels at Signal points
  •  Comprehensive Market analysis tool
  •  Signals across Multi-timeframes(max 6 at a time)
  •  Analyse single selected pair
  •  Alert all Signals
   Why TTS indicator is for you?

       TTS is an indicator i personally use for manual & semi-Automatic trading with good and consistent results since 2021 before releasing to the public.

          I will like to welcome you to try out the high odds entry signal of TTS Indicator by Renting for 1month and by following  the Proven Strategy as given below, freely given, to help you out in your trading. Demo version is available but has inherent limitations by default, however you can familiarize with the indicator by testing the demo in strategy tester and see how Signals update in various timeframes.Almost all signals are High Odds esp in higher timeframe and TTS indicator Win Rate > 97%

          Before loading the indicator Dashboard into a chart,make a Blank template without any indicators although not mandatory.Then the TTS indicator will  load onto the chart without any problems.The background color as well as colors of Signals etc are completely user customizable.

          Customization and Settings

        TTS allows traders to adjust key settings to match their trading style:

      • Custom Signal Colors: Modify the colors of Buy1, Buy2, Sell1, Sell2,Bull1, Bull2, Sell1 and Sell2 signal for better visibility.Also option given to customise color of header Row and Column.
      • Selectable Forex Pairs: Focus on specific currency pair that match your strategy
      • Timeframe Selection: Customize which timeframes(max 6) are displayed on the dashboard for easier monitoring, default as D1,H4,H1,M30,M15,M5 where each timeframe header is separated by comma.
      • Alert System: Set up notifications viz PopUp, Email and Push, when new signals appear to avoid missing trade opportunities.Alert time interval can also be adjusted for convenience.(default at 3 times per timeframe)
        How TrueTrendStar Signal Works ?

        TTS continuously evaluates price behavior and market momentum to determine when trends are forming or reversing. It classifies signals into eight key types:

      • Buy1 Signal: The first sign of an emerging  high odds uptrend. This appears when market conditions indicate a shift toward bullish momentum.
      • Buy2 Signal: A high odds uptrend signal after Accumulation Extension, Deep Correction or First Correction after Double Bottom/Top reinforcing   the likelihood  of continued price increase. This signal has strong Recoil energy.
      • Sell1 Signal: The first indication of a high odds downtrend, appearing when bearish conditions develop.
      • Sell2 Signal: A high odds Dntrend signal after Distribution Extension, Deep Correction or First Correction after Double Bottom/Top reinforcing the likelihood  of continued price decrease. This signal has strong Recoil energy.
      • Bull1 Signal:  Bullish Correction/Reversal signal ensured by confirmations. Often Signals start of Double Top too.
      • Bull2 Signal:  Bullish signal.(less bar nos the better)
      • Bear1 Signal: Bearish Correction/Reversal signal ensured by confirmations  Often Signals start of Double Bottom too.
      • Bear2 Signal: Bearish signal.( less bar nos the better )
      • Buy1, Sell1:   Normal Buy and Sell signals respectively.
      • Buy2, Sell2:   Somewhat Abnormal Buy and Sell signals respectively
      • Buy1 generally indicates start of

                                        Inverse head and shoulder formations(Inv H&S) or
                                        Double bottom(DB) or 
                                        Upswing(US)

               which are all high probability patterns. 

      • Sell1 generally indicates start of

                                       Head and Shoulder formation(H&S) or
                                       Double Top(DT) or
                                       DownSwing(DS)

               which are all high probability patterns.

      • Buy2 generally indicates start of

                                       Correction after Deep Accumulation Extension or
                                       Abnormal Double bottom(DB) or 
                                       Upswing(US) to rejoin Uptrend

               which are all high probability patterns . 

      • Sell2 generally indicates start of

                                        Correction after Deep Accumulation Distribution or
                                        Abnormal Double Top(DT) or 
                                        DnSwing(DS) to rejoin Dntrend

               which are all high probability patterns . 

      • When Conflicting Signals occurs across timeframes,generally Higher timeframes signal prevails
      • Uniformity of signals in adjacent timeframes are significant 
      • Shows the changes in price is sometimes from low timeframe to high timeframe or vice versa

      • Dashboard Signal in forex pair is significant to its Correlated pairs too and can be inspected for concurrence.

      • The Dashboard signal can be used as standalone signal however it may be complemented by compatible indicators like Bollinger band,Wave count indicators,Double Bottom or Top indicator,Oscillators like RSI & Stochastic and 200 periods Simple Moving Average.

      • The TTS indicator can be used on any time intervals on the chart, ranging from minute (M1) to monthly (MN).

      • Following these signals upto its Trend-End  Zone can reap consistent pips.

      • Signals in Compatible time-frame can be more powerful confirmation of Trend Directions,Its Changes or Continuations.For example M5-M30,M30-H4 are Compatible time-frames

      • Clicking on Signal Label will open up the forex pair chart of the particular time-frame where one can trade the signal immediately.

      • Using the TTS Dashboard indicator's signals, precise entry points is indicated, with an average risk-to-reward ratio exceeding 1:2. 

      • Occurence of Trend Change signal after sufficient trending or consolidation of prices is most probable for trend change .


         Step-by-step video instructions explain how to work with the indicator using specific examples, even if you're doing it for the first time.

         Each of these signals is carefully calculated using advanced algorithms that consider price action, volatility, and momentum.

           Multi-Timeframe Market Scanning

         One of TTS’s standout features is its ability to analyze multiple timeframes simultaneously. Instead of focusing on a single timeframe, traders can view trend signals across various time horizons, gaining a broader perspective of market conditions.

        This multi-timeframe approach allows traders to:
           ✅ Identify long-term trend direction while executing trades on shorter timeframes.
           ✅ Avoid false signals by ensuring trends align across multiple timeframes.
           ✅ Spot high-probability trade setups where short-term and long-term trends match.

        TTS displays this information on an intuitive dashboard, making it easy to check trend signals for different timeframes at a glance.

        How to Use TTS Effectively    Trade Execution Strategy
      • Compatible Timeframe Signals Trend(CTST) strategy-For Example-EURUSD shows Sell2 signal in H4 timeframe,Wait for Sell1 or Sell2 in M30 to open Sell trade.Close the trade when Buy1 or Buy2 shows up in M30min.Early exit can be done on Buy1 or Buy2 signals in 5min timeframe too.Similarly for the Buy signals also.
      • Main Trend Direction Scalping(MTDS) strategy-For example-GBPUSD show Buy1 or Buy2 signals in H4 timeframe,wait for Buy1 or Buy2 in 5min timeframe to open Buy trades.Close the trades when Sell1 or Sell 2 happens in 5min timeframe.
      • Positional Trend(PT) strategy-For example-USDCAD shows Buy2 signal in H4 timeframe,then immediately enter Buy trade and wait for Sell1 or Sell2 signals in H4 to close the trades.For early exit,open trades can be exited when Sell1 or Sell2 signals happen in nearest lower timeframe i.e H1.
      • Low to High Swing Reversal(LTHS) strategy-For example-USDCHF shows Buy2 signal in H4 timeframe and Sell2 signal in 5min timeframe, then immediately enter sell trade trade and wait for Sell1 or Sell2 in nearest higher timeframe i.e 15min timeframe,and if happened,there is follow through and the trades can be hold longer as successful reversal trades.Trades can be closed if Buy1 or Buy2 happens in 5min timeframe thereafter.
      • Confirm Trend(CT) strategy-For example-EURUSD shows Bear2(1) signal in H4 timeframe,then immediately enter Buy trade,wait for Buy1 or Buy2 signals in next lower timeframe i.e H1 or M30,then close the trade.
      • Buy and Hold(BH) strategy-For example-USDJPY shows Buy2 signal in H4 timeframe,then wait for Buy1 or Buy2 signals in H1/M30/M15 timeframes and add more Buy positions whenever signals happen in compatible lower timeframes.Trades can be exited when Sell1 or Sell2 signal happen in H4 timeframe.
      • Entry on TTS Signal and Exit on Other Indicators(ETEOI) strategy-For example-USDJPY shows Buy1 in M30 timeframe,then enter Buy trade and Exit on Rsi or Stochastic Overbought signal in same timeframe.

          The above given trading strategies are tested and proven as reliably consistent.However, the TTS signals can also be used along with compatible indicators such as Bollinger Bands,Wave Count,Double Bottom and Top indicator,Oscillators like RSI/Stochastic and 200 period simple moving average.However,as explain above,the TTS signals alone is sufficient to trade the markets with high odds entries and exits.

        Customization and Settings

        TrueTrendStar allows traders to adjust key settings to match their trading style:

      • Custom Signal Colors: Modify the colors of Buy1, Buy2, Sell1, and Sell2 signals for better visibility.
      • Selectable Forex Pairs: Focus on a specific currency pair that match your strategy.
      • Timeframe Selection: Customize which timeframes are displayed on the dashboard for easier monitoring(max 6).
      • Alert System: Set up notifications when new signals appear to avoid missing trade opportunities.
        Why Choose TrueTrendStar?

           ✅ Non-Repainting Signals: Once a signal is generated, it remains fixed, ensuring transparency and accuracy.
           ✅ Multi-Timeframe Analysis: See trend shifts across multiple timeframes for better decision-making.
           ✅ Early Trend Detection: Get ahead of the market by identifying high odds reversals before traditional indicators.
           ✅ User-Friendly Dashboard: Quickly assess market conditions without needing complex analysis.
           ✅ Versatile Trading Application: Suitable for Scalping, Day trading, Positional trading , Swing trading and Buy & Hold trading.


        What this means for you?

        TrueTrendStar is a powerful and reliable forex trading indicator designed to help traders identify trend changes early and trade with confidence. Its a combination of non-repainting trend signals, multi-timeframe analysis, and an intuitive dashboard which makes it a must-have tool for both beginner and experienced traders to trade currencies professionally and profitably.

        By integrating TTS into your trading strategy, you can improve market timing, minimize guesswork, and enhance your overall trading performance.

        (In case of any doubt about the indicator or strategy,a buyer can contact the author through the messaging system of MQL5.Com site.)


        Warm regards for your profitable trading success!

        Note:: By design, The TTS indicator update after every time interval of 10sec.


      Produits recommandés
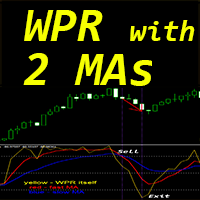
      Indicateur Crypto_Forex "WPR et 2 moyennes mobiles" pour MT4, sans repeinture. - WPR lui-même est l'un des meilleurs oscillateurs pour le scalping. - L'indicateur "WPR et 2 moyennes mobiles" vous permet de voir les moyennes mobiles rapides et lentes de l'oscillateur WPR. - L'indicateur donne la possibilité de voir les corrections de prix très tôt. - Il est très facile de configurer cet indicateur via des paramètres, il peut être utilisé sur n'importe quelle période. - Vous pouvez voir les cond
      Power Renko is an indicator which plots Renko bricks underneath the chart using a histogram. You can select the brick size and the timeframe of the Renko bricks as well as whether or not to use the close price or the high/low price of the candles. Renko bricks are based on price alone, not time, therefor the Renko bricks will not be aligned with the chart's time. They are extremely useful for trend trading and many different strategies can be formed from them. Buffers are provided allowing you t
      Alpha Trend sign est notre outil de Trading très populaire depuis longtemps, il valide notre système de Trading et invite clairement les signaux de Trading sans dérive. Fonctions principales: • En fonction de la zone active du marché, selon les indicateurs, il est intuitif de déterminer si le cours actuel appartient à la tendance ou à la tendance. Et coupez le marché selon les flèches d'indication de l'indicateur, les flèches vertes suggèrent d'acheter et les flèches rouges suggèrent de vend
      Chinetti pip collector XL is a complete turnkey trading system. If a trader does not yet have his own trading system, he can apply Chinetti pip collector XL to trading. Trading with this indicator is very easy. Even a beginner in Forex can handle it. Trading rules: wait for the indicator to start drawing a blue line. This means that the price trend is starting now. Now we are waiting for the indicator to analyze the market and draw an up arrow on the chart. At this point, we open a buy order.
      "Auto FIBO Pro" Crypto_Forex indicator - est un excellent outil auxiliaire dans le trading ! - L'indicateur calcule et place automatiquement sur le graphique les niveaux de Fibo et les lignes de tendance locales (couleur rouge). - Les niveaux de Fibonacci indiquent les zones clés où le prix peut s'inverser. - Les niveaux les plus importants sont 23,6 %, 38,2 %, 50 % et 61,8 %. - Vous pouvez l'utiliser pour le scalping inversé ou pour le trading en grille de zones. - Il existe également de nomb
      Advanced Trend Regime
      Shellard Securities (Pty) Ltd
      The indicator has been designed to function on any time-frame and any pair.   This regime filter will help the trader better evaluate whether the current market is trending, and in which direction. It quickly reacts to changes in market dynamics using a series of advanced calculations. The user is able to select whether the calculation remains standard, or if a further filter constraint is added to the calculation.   A Yellow moving average of the signal has been included for the trader to smoot
      Based on MACD indicator waves with standard parameters Applies Fibonacci levels to the last two MACD waves, positive and negative respectively, if at the moment the MACD indicator runs out of negative Wave - the color is green, if at the moment the MACD indicator runs out of positive Wave - the color is red. The Wave termination criterion is two ticks with a different MACD sign. Applies trend lines on the last four MACD Waves. Works well with the expert Figures MACD   https://www.mql5.com/ru/mar
      This is an arrow indicator without a future function,developed based on the most advanced profit trading algorithms.It has the most innovative and advanced dual trend analysis module, as well as the latest and highly effective market trend prediction algorithm.Trends are your friends, and following larger trends can earn the maximum profit in foreign exchange. This indicator helps traders identify current trends and track them. Someone once made a profit of 10 times in a week by relying on it.No
      Happy Scalping Indicator
      Leandro Bernardez Camero
      Ce indicateur a été conçu pour un scalping agressif et des entrées rapides dans les options binaires , générant des signaux sur chaque bougie afin que vous puissiez savoir exactement ce qui se passe à tout moment. Rejoignez le canal Happy Scalping : MQL5 Ne repince pas : le signal de la bougie actuelle est généré en temps réel , ce qui signifie qu'il peut changer pendant que la bougie est encore en formation, selon que le prix monte ou descend par rapport à la clôture de la bougie précédente.
      Owl smart levels
      Sergey Ermolov
      4.24 (37)
      Version MT5  |  FAQ L' indicateur Owl Smart Levels   est un système de trading complet au sein d'un seul indicateur qui comprend des outils d'analyse de marché populaires tels que   les fractales avancées de Bill Williams , Valable ZigZag qui construit   la structure d'onde correcte   du marché et   les niveaux de Fibonacci   qui marquent les niveaux exacts d'entrée. sur le marché et les endroits où prendre des bénéfices. Description détaillée de la stratégie Mode d'emploi de l'indicateur Conse
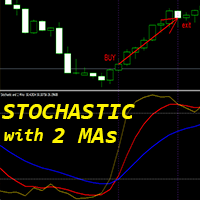
      Indicateur Crypto_Forex « Stochastic et 2 Moyennes Mobiles » pour MT4, sans retouche. - L'oscillateur stochastique est l'un des meilleurs indicateurs du marché ; un outil idéal pour de nombreux traders. - L'indicateur « Stochastic et 2 Moyennes Mobiles » vous permet de visualiser les moyennes mobiles rapides et lentes de l'oscillateur stochastique. - Zone de surachat : supérieure à 80 ; zone de survente : inférieure à 20. - Il est idéal de prendre des entrées de vente au-dessus de 80 ; et des
      Chart Patterns Detect 15 patterns (Ascending Triangle, Descending Triangle, Rising Wedge, Falling Wedge, Bullish Flag, Bearish Flag, Bullish Rectangle, Bearish Rectangle Symmetrical triangle, Head and Shoulders, Inverted Head and Shoulders, Triple top, Triple Bottom, Double Top, Double Bottom) Use historical data to calculate the probability of each pattern to succeed (possibility to filter notification according to the chance of success) gives graphic indication about the invalidation level and
      Trend Oscillator - est un indicateur Crypto_Forex personnalisé avancé, un outil de trading efficace ! - Une nouvelle méthode de calcul avancée est utilisée - 20 options pour le paramètre « Prix pour le calcul ». - L'oscillateur le plus fluide jamais développé. - Couleur verte pour les tendances à la hausse, couleur rouge pour les tendances à la baisse. - Valeurs de survente : inférieures à 5, Valeurs de surachat : supérieures à 95. - Il existe de nombreuses possibilités de mettre à niveau même
      Trend Ray
      Andriy Sydoruk
      The indicator shows the potential trend direction by cyclical-wave dependence. Thus, all the rays of the intersection will be optimal rays, in the direction of which the price is expected to move, taking into account the indicator period. Rays can be used as a direction for potential market movement. But we must not forget that the approach must be comprehensive, the indicator signals require additional information to enter the market.
      ProTrading Arrow
      Nedyalka Zhelyazkova
      5 (1)
      " A NEW TRADING METHOD… AN AMAZING TRADING INDICATOR! " Additional Bonus : You get the Forex Trend Commander indicator for FREE! To lock in a profit from market movements in most cases it takes much longer than planning it. Trading is not an event, but a process. This process has no end, i.e. it should never stop completely and completely. ProTrading Arrow indicator is an advanced reversal system that can be played with or against the trend. BENEFITS OF USING PROTRADING ARROW Defines the Buy a
      Infinity Trend Pro
      Yaroslav Varankin
      1 (1)
      This is a trend indicator without redrawing Developed instead of the binary options strategy (by the color of the Martingale candlestick) Also works well in forex trading When to open trades (binary options) A signal will appear in the place with a candle signaling the current candle It is recommended to open a deal for one candle of the current timeframe M1 and M5 When a blue dot appears, open a deal up When a red dot appears, open a trade down. How to open trades on Forex. When a signal is rec
      MACD Display is a MACD disaplay and cross monitoring indicator,which can works on 6 timeframe at same time. Indicator advantage: 1. Deviation from the point can be drawn on the main picture and indicator drawing. It is convenient to observe and can be hidden or displayed by parameter setting. 2. Deviation from the entry point is clearly indicated by the arrow in the drawing. 3. Cross-cycle monitoring can simultaneously monitor the MACD deviation and the golden dead fork of the six-cycle framewor
      Be notified of every color change of Heiken Ashi (HA) candles. The indicator will trigger past and new signals every time that HA candles change their colors. Note : this tool is based on the code of Heiken Ashi indicator developed by MetaQuotes Software Corp. Features The signals are triggered at closing of last bar/opening of a new bar; Any kind of alerts can be enabled: Dialog Box, Email message, SMS notifications for smartphones and tablets, and Sound alerts; By default, up arrows are plott
      Line Magnit
      Aleksey Trenin
      The LineMagnit Indicator for MT4 is a highly precise tool that builds support and resistance levels which magnetically attract prices. This feature allows traders to easily determine the most probable entry and exit points in the market, as well as identify the market's directional forces, as levels are based on capital inflows into the instrument. Equipped with an intuitively understandable graphical interface, the LineMagnit Indicator enables users to quickly locate and analyze support and res
      PipFinite Trend PRO
      Karlo Wilson Vendiola
      4.88 (2245)
      Breakthrough Solution For Trend Trading And Filtering With All Important Features Built Inside One Tool! Trend PRO's smart algorithm detects the trend, filters out market noise and gives entry signals with exit levels. The new features with enhanced rules for statistical calculation improved the overall performance of this indicator. Important Information Revealed Maximize the potential of Trend Pro, please visit www.mql5.com/en/blogs/post/713938 The Powerful Expert Advisor Version Automatin
      Stepping Trend
      Mpendulo Chiliza
      The Stepping Trend Indicator     The Steppi ng Trend indicator uses the  average true range  (ATR indicator) in its calculation. This gives you control to set your own average true range period, I set the Default as 10.   Indicator Details. Green Arrow Up: This means you are at the starting point of a new bullish trend, it’s time to buy.   Red  Arrow  Down : This means you are at the starting point of a new  bearish  trend, it’ s time to sell .   What if you miss the Arrow Signal?   No prob
      Trendiness Index
      Libertas LLC
      5 (3)
      "The trend is your friend" is one of the best known sayings in investing, because capturing large trendy price movements can be extremely profitable. However, trading with the trend is often easier said than done, because many indicators are based on price reversals not trends. These aren't very effective at identifying trendy periods, or predicting whether trends will continue. We developed the Trendiness Index to help address this problem by indicating the strength and direction of price trend
      Renko, Heiken Ashi, Ticks Bar, Range Bar.    Easy switching, easy setup, all in one window.        Place the Custom Chart indicator and view Renko, Heiken Ashi, Tick bar, Range bar charts in real time at real chart.    Position the offline chart window so that the indicator control panel is visible.    Switch the chart mode by click of a button.    Connect to the output chart any indicator, expert advisor without any restrictions.    No, it doesn't work in the tester.    Yes, you can use an
      Heiken Ashi candle chart is an improved version of The Japanese candle chart, which can effectively filter the market "noise" of the Japanese candle chart. It is favored by many traders for its simplicity and intuition. For trend traders, the HA candle chart is a magic tool. Unlike the traditional Japanese candle chart, Heikenashi does not reflect the opening price, high price, low price and closing price of the market. Instead, Heikenashi calculates the value of a single K line in the dominant
      Introduction It is common practice for professional trades to hide their stop loss / take profit from their brokers. Either from keeping their strategy to the themselves or from the fear that their broker works against them. Using this indicator, the stop loss / take profit points will be drawn on the product chart using the bid price. So, you can see exactly when the price is hit and close it manually.  Usage Once attached to the chart, the indicator scans the open orders to attach lines for t
      The Sextet Scalper Pro  is an MT4 indicator that gives signals when new waves are starting in a trend. The trends are calculated using the original " The Sextet " indicator method. You get a free EA to trade with The Sextet Scalper Pro: Free EA . Default settings were optimized on GBPUSD H1 from 2017. EA could be tested on free demo version of The Sextet Scalper Pro, before purchase. Key Features: Uses The Sextet Trend Detection Method which is already a good strategy in itself for detecting lo
      [ZhiBiCCI] indicators are suitable for all cycle use, and are also suitable for all market varieties. [ZhiBiCCI] Green solid line is a reversal of bullish divergence. The green dotted line is a classic bullish divergence. [ZhiBiCCI] The solid line to the red is a reverse bearish divergence. The red dotted line is a classical bearish divergence. [ZhiBiCCI] can be set in the parameters (Alert, Send mail, Send notification), set to (true) to send instant signals to the alarm window, email, insta
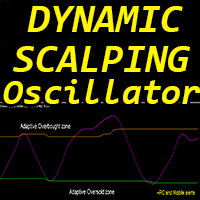
      « Dynamic Scalping Oscillator » est un indicateur Crypto Forex personnalisé avancé, un outil de trading efficace pour MT4 ! - Nouvelle génération d'oscillateurs : voir les images pour comprendre leur utilisation. - L'oscillateur de scalping dynamique dispose de zones de survente/surachat adaptatives. - L'oscillateur est un outil auxiliaire permettant de trouver des points d'entrée précis dans les zones dynamiques de survente/surachat. - Valeurs de survente : inférieures à la ligne verte ; vale
      Real Trend Zigzag PRO   shows the real trend of a market, u nlike the default Zigzag indicator. It calculates the trend in real time and shows green lines for upwards trends, red lines for downward trends and blue lines for no trends.  Regarding the old slogan "the trend is your friend" it helps you to decide if should open a buy or sell position. The PRO version is a multi timeframe zigzag (MTF). Means, it shows the trend of the current timeframe as well as the trend of a higher or lower time.
      Indicateur Crypto_Forex « Histogramme de correction de tendance majeure » ​​pour MT4, sans refonte. - L'indicateur d'histogramme de correction de tendance majeure a été conçu pour détecter les grandes tendances. - L'indicateur est disponible en deux couleurs : rouge pour une tendance baissière et bleu pour une tendance haussière (couleurs modifiables). - Au moins 10 colonnes consécutives de la même couleur dans l'histogramme indiquent le début d'une nouvelle tendance. - L'indicateur intègre de
      Les acheteurs de ce produit ont également acheté
      Cycle Maestro
      Stefano Frisetti
      TRADING avec CYCLEMAESTRO Le signal est simple et immédiat : dès que le fond d'une zone devient vert ou rouge, cela signifie qu'un signal de TRADING est actif : VERT = ACHAT et ROUGE = VENTE. Le TRADER peut ouvrir le TRADE et suivre les instructions suivantes.  REMARQUE : CYCLEMAESTRO est distribué uniquement sur ce site Web, il n'y a pas d'autres distributeurs. La version DEMO est fournie à titre de référence uniquement et n'est pas prise en charge. La version finale est prise en charge et
      Enigmera
      Ivan Stefanov
      5 (7)
      ENIGMERA : Le cœur du marché Important : La démo de MQL5.com fonctionne dans le Strategy Tester et peut ne pas refléter pleinement les fonctionnalités d'Enigmera. Consultez la description, les captures d'écran et la vidéo pour plus de détails. N'hésitez pas à m'envoyer un message si vous avez des questions ! Le code de l'indicateur a été entièrement réécrit. La version 3.0 ajoute de nouvelles fonctionnalités et corrige les bugs accumulés depuis le lancement de l'indicateur. Introduction Cet in
      Pairs Trading Dashboard - Spearman Correlation and Stationary Z-Score  is a custom indicator designed for the MetaTrader 4 (MT4) platform, developed to assist traders in analyzing and monitoring currency pairs for pairs trading strategies. It utilizes Spearman’s rank correlation coefficient and Z-Score calculations to identify trading signals across multiple timeframes and currency pairs. The indicator integrates various technical filters and stationarity tests to refine signal generation and di
      EARLY REMINDER: The Starting price is 65 price will rise soon up to 365$ and then 750$ after first 10 copies of sales. Grab this offer now! Introduction Hello, traders! Welcome to the demonstration of the Forex Beast Indicator , a comprehensive tool designed to assist aspiring traders in navigating the complexities of the forex market. This indicator incorporates seven essential components to provide a well-rounded trading experience: Moving Averages Colored Zones Support and Resistance Levels
      Bomb Bank Signal
      Igor Pereira Calil
      5 (1)
      Signal Bomb Bank : votre indicateur de confiance dans MetaTrader 4 Bomb Bank Signal est un indicateur puissant pour MetaTrader 4, conçu pour identifier les tendances les plus pertinentes du marché financier. Si vous recherchez un outil qui anticipe avec précision les mouvements, la Bomb Bank est l’alliée qu’il vous faut. Comment ça marche : Cet indicateur combine trois méthodes distinctes – analyse de volume, clôture de bougie et tendance symétrique – pour détecter et signaler les opportunit
      TrendMaestro
      Stefano Frisetti
      4 (4)
      note: this indicator is for METATRADER4, if you want the version for METATRADER5 this is the link:  https://www.mql5.com/it/market/product/108106 TRENDMAESTRO ver 2.4 TRENDMAESTRO recognizes a new TREND in the bud, he never makes mistakes. The certainty of identifying a new TREND is priceless. DESCRIPTION TRENDMAESTRO identifies a new TREND in the bud, this indicator examines the volatility, volumes and momentum to identify the moment in which there is an explosion of one or more of these data a
      Pair Trading Strategy Based on Spearman Correlation and Stationary Z-Score  is A single-pair indicator focusing on one primary symbol (chart symbol) and one secondary symbol for the MetaTrader 4 (MT4) platform, designed to support pairs trading by analyzing the correlation between two currency pairs. It employs Spearman’s rank correlation coefficient, Z-Score calculations, and stationarity testing to generate trading signals, displayed in a subwindow and on the main chart. The indicator integra
      Hit Rate Top Bottom Signal
      Martin Alejandro Bamonte
      Hit Rate Top Bottom Signal Hit Rate Top Bottom Signal Hit Rate Top Bottom Signal offre une approche totalement innovante. Il est idéal pour ceux qui souhaitent évaluer à l’avance comment le signal fonctionne avec un TP-SL spécifique et dans quels PAIRES/TF il est le plus performant. La stratégie Hit Rate Top Bottom Signal est un outil essentiel pour tout trader et type de trading car elle émet non seulement des signaux précis sans redessiner , indiquant clairement quand trader et dans quelle dir
      This indicator works on MT4 and is very easy to use. When you receive a signal from it, you wait for that candle with the signal to close and you enter your trade at the beginning of the next new candle . A red arrow means sell and a green arrow means buy. All arrows comes with Alert  like for easy identification of trade signal. Are you okay with that? 1 minute candle 1 minute expire
      ZO Trend
      Trung Le Hoang
      4 (4)
      Important!! ZO Trend can't work on MN timeframe. /*--------------------------------------------------------------------------------------------------------------------------------------------------------------------------------------------- ZO Trend an indicator used to search for entry point. With the session candle algorithm on many timeframe, ZO Trend creates an area for traders find good Entry Point. ZO SYSTEM BASIC SETUP :  https://www.youtube.com/watch?v=qdNOXHWozNw ZO TREND User guide : 
      Trade Invest Pro - Boss in the world of cryptocurrency! This indicator is ideal for cryptocurrency trading! Work on Trade Invest Pro took us half a year! But not in vain! Now only accurate signals near support - resistance levels! He showed himself well on timeframes m5 m15 for binary options! Optionally, it can be configured for forex for timeframes m30 and more! Reacts well to news! Doesn't paint! and does not disappear from the schedule! As soon as a red arrow appears, open a deal fo
      Dark Sniper
      Dmitriy Kashevich
      Dark Sniper pointer indicator.  Complete absence of redrawing   The percentage of correct indicator forecasts depends on your settings; the default is period 7 (performed better) The arrow indicates the direction of the next candle and the possible direction of the trend in the future.  Suitable for small timeframes m1 and m5  It is recommended to open transactions from 1 to 2 candles.  The signal appears on the current candle. Open a trade on the next one since the signal is being generat
      Hello Dear Trader, Today Im Telling You About The "Golden Scalp System V1 " Metatrader4 Golden Scalp System Scalper with EMA   This is a  Scalper strategy   based on ( Exponential moving average) EMA . Time frame: H1 Pair: EUR/USD, GBP/USD,AUD/USD XAU/USD Platform Mt4   Indicators for Scalper with Ema: 300  EMA (Exponential Moving Average) ; 500 EMA (Expontial Moving Average); Stochastic   (5,3,3)   Long Entry 1) 300  EMA   > 500  EMA . 2) Find significant levels of support. 3) Wait for the c
      Magic M2
      Tuan Anh Dao
      4.5 (8)
      ------ GOOD LUCK   -----   (Telegram: @MagicBinary) The indicator allows you to trade binary options. T his indicator give high winning ratio with over 20 years of backtesting  The recommended time frame is М1 and the expiration time is 3, 5 minutes. The indicator suitable for Auto and Manual trading. A possible signal is specified as a arrows above/under a candle. You can entry current candle /intrabar or can wait until candle close Arrows are not re-painted Trade sessions: Any/ Rec
      Automatic, live & interactive picture of all trendlines. Assign push, email and sound alerts to the lines of your choice and be informed about price rollback, breakout, rollback after breakout, number of rollbacks, line expiration by double breakout. Correct, drag or delete the lines and interactively tune the line system. https://youtu.be/EJUo9pYiHFA . Chart examples https: //www.mql5.com/en/users/efficientforex Price Interaction Events All events are effective immediately and only after one
      The indicator displays the probable ( Support and resistance ) levels. The indicator draws horizontal and trend levels of support and resistance. The indicator settings: Trends - the mode for displaying trend lines or horizontal lines of support and resistance Yes - display trend lines only No - display horizontal lines only UseResource - use the resources built into the indicator. Yes - use the ZigZag indicator from the resources of the product. No - use a custom ZigZag indicator. HistoryBar -
      The indicator of a Professional Trader is an arrow indicator for predicting the direction of price movement. I have been working on this indicator since 2014. You can use this indicator as your main indicator, use its entry signals, and use it as your only indicator to find entry points. About the product: Recommended TF [H4-D1-W1]   . The indicator predicts the direction of the next candle. Fits a variety of tools; Flexibility in settings for different instruments and intervals through the MO
      The [GRAFF] III manual trading system is based on multiple MetaTrader (MT4) indicators. Together, the entire PACK of GRAFF III indicators makes an advanced trading tool. The system consists of over 20 different custom-built indicators which have been carefully selected and tested in the long term to produce strong and efficient trading signals. The particular indicators are based on different mathematical formulas, so the entire system is calibrated to remove false signals from its own indicator
      This indicator allows you to see the strength of the trend on all timeframes. It can be used for all currency pairs. The indicator can be displayed in the form of a column (from left to right): status buy / sell / strong buy / strong sell, strength of the trend in percentage, pips last candle, body candle now, remaining time, and the timeframe of M1 to MN. Information contained below (from left to right): total trend percent, sell percent, buy percent.
      Smooth price for Monarch MT4
      Konstantin Gruzdev
      3.67 (3)
      The Smooth Price technical indicator is used for plotting a smoothed line as close to the price of the financial instrument as possible, and serves to eliminate its noise components. The indicator is part of the Monarch trading system, but here it is presented as an independent technical analysis tool. The indicator is based on the cluster digital filter , which, unlike the ClusterSMA , is applied directly to the price time series. Smooth Price does not redraw (except the very last, zero bar) an
      A simplistic indicator informing a user on RSI divergence by sending messages to mobile device and email. The indicator draws 2 vertical lines, marking two RSI extrema that formed the divergence. You get the alert, open the charts and make a decision. The indicator does not show past divergences, thus when you attach it to a chart for the first time you see nothing. Graphics and alerts will appear as soon as divergences do. Drop it in Tester to see how it works. Parameters: RSIPeriod - number of
      ZLevels
      Sergio Andres Zuleta Lopez
      This indicator is based on Market Profile methodology, which contains the Z-Zone , unlike the latter, allows visualization of multiple time frames on the same graph. This methodology has proven to be very effective for: Reduce the number of windows required to analyze or track a financial asset. Display important resistance areas (ROZ), support (SoZ) and average distribution (PoC) in different periods of time. Define areas to take profits as well locate technical stop loss. Analysis in the devel
      Pan PrizMA CD Phase is an analogue of the МetaТrader 5 indicator , and is an option based on the Pan PrizMA indicator. Details . Averaging by a quadric-quartic polynomial increases the smoothness of lines, adds momentum and rhythm. Extrapolation by the sinusoid function near a constant allows adjusting the delay or lead of signals. The value of the phase - wave status parameter (which is close in meaning to the trigonometric phase or the angle of the radius-vector rotation in the trigonometric p
      Green Wall Arrows
      Daniel Luchinger
      1 (1)
      The Name Green Wall : Arrows hits a lot of TP, by changing the idea of non using SL as something bad, but instead use Small TP and a lot of free Margin and Patience. Use micro TP and a lot of Free Margin with this indicator on Forex. It also can be used with Binary Options. This strategy is intended to be traded Manually. This Indicator runs on Open Bar, arrows will delete when price are against it. The only Indicator Parameter is Alerts true/false, all the rest is included inside the code. Arro
      Full Forex Market View Dashboard
      Opengates Success International
      5 (2)
      Indicateur de tableau de bord FULL FOREX MARKET VIEW Il s'agit d'un indicateur personnalisé créé pour donner aux commerçants une vue complète de ce qui se passe sur le marché. Il utilise des données en temps réel pour accéder au marché et afficher toutes les informations nécessaires pour effectuer des transactions réussies. INSTALLATION: Avant de joindre cet indicateur à votre graphique de fenêtre, accédez au panneau Market Watch de votre MT4 et MASQUEZ toutes les paires de devises dont vous
      Golden Monowave
      Ahmed Mohamed Ali
      Golden Monowave is monowave indicator, the monowave theory is one of Elliott wave approach and one of most complicate and accurate method. Golden Monowave can shortcut many major steps to identify and describe the monowave. It works on any timeframe and with any trading instrument, including currencies, indices, futures, etc. Input Parameters initial_Bars - set the initial number of bars to calculate. wave_color - select the color of the wave. label_color - select the color of labels. temp_labe
      Shark Surfer is a new generation indicator applying a well-established trend-following trading. The product is good both for scalping, as well as medium- and long-term trading. Shark Surfer analyzes a selected symbol and shows the recommended market entry, take profit and stop loss levels. Shark Surfer trades on all symbols and timeframes. It also features email and push notifications concerning the new trading signals. The indicator searches for suitable market entry points on an already formed
      Ticks Size
      Viktor Kolmakov
      This indicator displays in a separate window the difference between the number of points which increased the price, and the number of points that decreased the price during the time interval specified in the settings. The time interval for calculation is expressed as the number of bars of the chart the indicator is attached to. This approach allows you to evaluate the movement direction (growth or fall) of the instrument's price, the strength of the movement and the size of the movement in point
      The main purpose of the QQ-Deep Binary indicator is to determine the direction of the sail marked for Binary Options. It works for any currency pair, presenting better result in volatile instruments. The indicator is designed to simplify market analysis, and is based on price pattern detection strategies combined with multi-currency econometric velocity. The development team is constantly improving the functionality of the indicator. Indicator Advantages No repaint. Works on all currencies. Mus
      Plus de l'auteur
      Advanced Detector of Trend Reversal and Continuance known as TrueTrendStar(TTS) is a sensitive and Predictive indicator of Price Trends for Professional traders. (  BIG ONE TIME DISCOUNT 50% !!!( Not 20% !)  ) ( ATTENTION BUYERS:- PLEASE CONTACT ME FOR HOW BEST TO USE THE INDICATOR FOR MAXIMUM PROFITS )    This indicator detects advanced signals of high odds changes in Price Trend direction long before other indicator detects it. I have been working on it since 2019.    This is possible due
      Filtrer:
      Aucun avis
      Répondre à l'avis
      Version 1.1 2025.03.15
      code optimisation