• Aperçu
  • Avis (10)
  • Commentaires (30)
  • Nouveautés

Double top bottom scanner with RSI filter

4.4

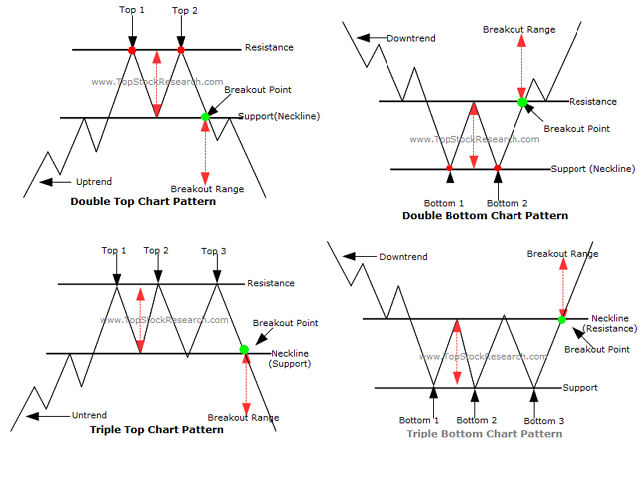
Cet indicateur à plusieurs périodes et à plusieurs symboles identifie les formations haut/bas doubles ou triples ou une cassure de décolleté suivante (haut/bas confirmé). Il offre des filtres RSI, pin bar, engloutissant, pince à épiler, étoile du matin/soir ainsi que des options de filtre de divergence MACD, Awesome (AO) ou RSI qui permettent de filtrer uniquement les configurations les plus fortes.   L'indicateur peut également être utilisé en mode graphique unique. Veuillez en savoir plus sur cette option dans le produit blogue. Combiné à vos propres règles et techniques, cet indicateur vous permettra de créer (ou d'améliorer) votre propre système puissant.

Caractéristiques

  • Peut surveiller tous les symboles visibles dans votre fenêtre Market Watch en même temps. Appliquez l'indicateur à un seul graphique et surveillez instantanément l'ensemble du marché.
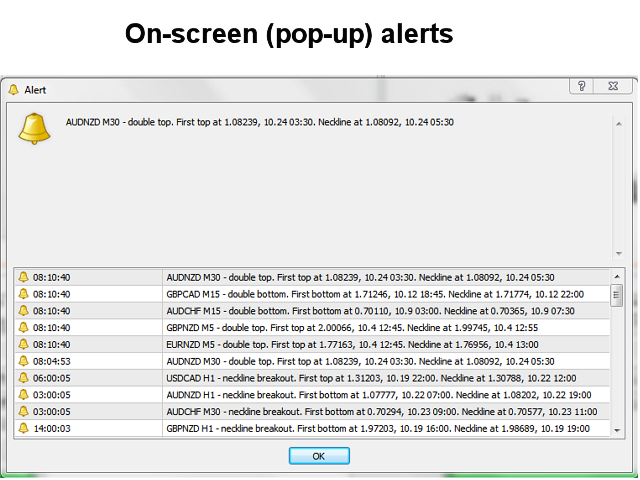
  • Peut surveiller chaque période, de M1 à MN, et vous envoie une alerte en temps réel lorsque le deuxième ou le troisième haut/bas est identifié ou lors de la rupture de l'encolure. Tous les types d'alertes natives de Metatrader sont pris en charge.
  • Peut utiliser RSI, une sélection de différents modèles de bougies et divergences pour identifier correctement les renversements potentiels.
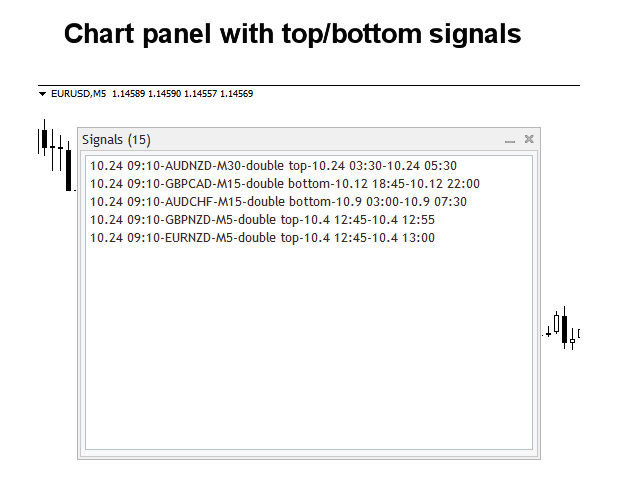
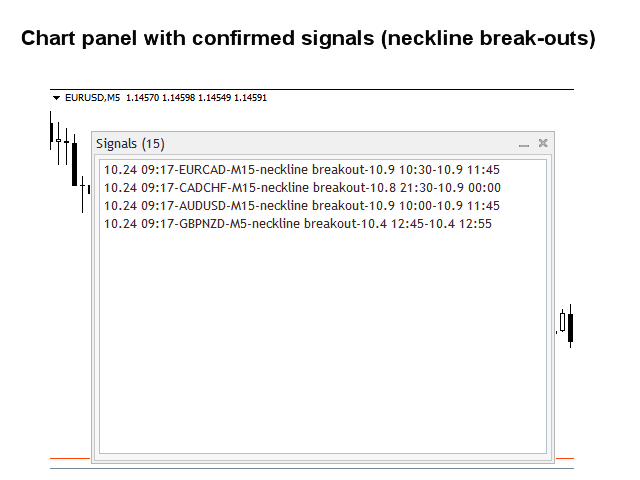
  • L'indicateur comprend un panneau interactif. Lorsque vous cliquez sur un élément, un nouveau graphique s'ouvrira avec le symbole et la période en question.
  • L'indicateur écrit les signaux dans un fichier texte qui peut également être utilisé par un Expert Advisor (EA) pour le trading automatique. Par exemple ce produit.

Paramètres d'entrée

La description et l'explication des paramètres d'entrée peuvent être trouvées ici.

Important

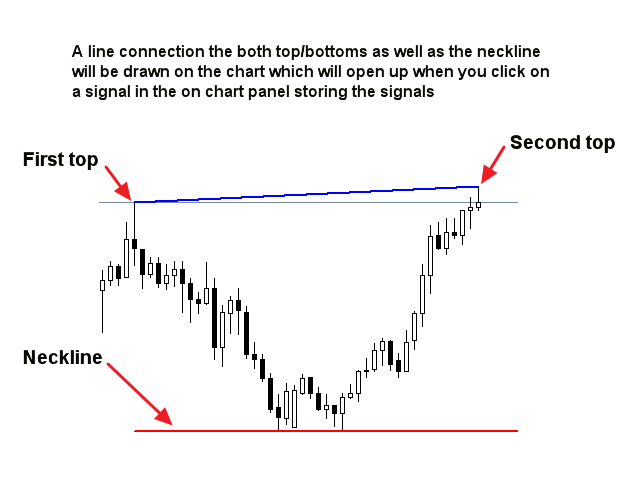
Veuillez noter qu'en raison de la multifonctionnalité, ni les conseils d'achat et de vente ni les lignes et les flèches ne seront tracés sur le graphique où l'indicateur a été installé. Une ligne entre les extremums ainsi que l'encolure sera tracée sur le graphique qui peut être ouvert à partir du panneau.

Il est fortement conseillé de placer l'indicateur sur un graphique propre (vide) sans aucun autre indicateur ou conseiller expert dessus qui pourrait interférer avec le scanner.

Avis 10
MP_mpap
426
MP_mpap 2024.02.26 15:30 
 

It's not just a simple scanner for DB & DT. It has the ability to notify early, allowing for processing time. It becomes very powerful when you apply the provided filters. On this note, I would like some confirmed settings... The fact that the signals are recorded and remain in the MT4 window is a fantastic idea. The way the indicator operates is close to the trader and deviates from the mindset of simple programming. Kudos to the creator. Excellent work!!! The best in its category. I will also purchase the scanner for S&R. It saves me from tasks I've been doing for years on my charts.

Carlos Thomas
152
Carlos Thomas 2023.12.28 10:45 
 

Excellent tool to scan and filter for better condition setups.

Suzanne
742
Suzanne 2023.09.09 22:22 
 

I have purchased numerous indicators and spent/wasted thousands of dollars. I wish I had found this indicator sooner and the support from Jan is phenomenal. I have never met a seller that is so helpful to me as a newbie and takes his time to explain everything in detail in order for you to also be a successful forex trader. I agree 100% with Randy Katz, I wish there were more people like Jan in the world. I feel extremely lucky to have found this indicator but even luckier to have found Jan. I cannot thank him enough.

Produits recommandés
I  recommend you to read the   product's blog  (manual) from start to end so that it is clear from the beginning what the indicator offers. This multi time frame and multi symbol indicator scans for engulfing and tweezer formations. The indicator can also be used in single chart mode. Combined with your own rules and techniques, this indicator will allow you to create (or enhance) your own powerful system. Features Can monitor all symbols visible in your Market Watch window at the same time. Ap
Implement
Vitalii Zakharuk
5 (1)
Implement analyzes market dynamics for pivot points. If you want to learn how to spot the correct reversals for consistently likely profitable trading, buy this indicator. Shows favorable moments of entering the market in stripes. Ready-made trading system. The principle of operation of the indicator is to automatically determine the current state of the market when placed on a chart, analyze historical data based on historical data and display instructions for further actions on the trader's
I  recommend you to read the   product's blog  (manual) from start to end so that it is clear from the beginning what the indicator offers. This multi time frame and multi symbol indicator identifies double top/bottom, head & shoulders, pennant/triangle and flag patterns. It is also possible to setup alerts only when a neckline/triangle/flagpole breakout has occured (neckline breakout = confirmed signal for top/bottoms and head & shoulders).  The indicator can also be used in single chart mode.
Sensitive Signal
Aleksey Ivanov
5 (2)
The Sensitive Signal ( SS ) indicator, using the filtering methods  (which includes cluster multicurrency analysis) developed by the author, allows, with a high degree of probability, to establish the beginning of the true (filtered from interference - random price walks) trend movement. It is clear that such an indicator is very effective for trading on the currency exchange , where signals are highly distorted by random noise. The filtration developed by the author is carried out
Special offer : ALL TOOLS , just $35 each! New tools   will be   $30   for the   first week   or the   first 3 purchases !  Trading Tools Channel on MQL5 : Join my MQL5 channel to update the latest news from me L'indicateur Zero Lag MA Trend Levels avec Scanner combine la moyenne mobile à zéro décalage (ZLMA) avec une moyenne mobile exponentielle standard (EMA), offrant aux traders une vue complète de la dynamique du marché et des niveaux de prix clés. De plus, les fonctions de scanner et d'ale
Optimized for Asia- London- US- Open-Session  the best Features from MOMENTUM-SOLO true Momentum - time-based Indicator it's based on a self-developed candle Pattern, in relation to the ATR Filter Daytime Weekdays Moving Averages Keltner-Channel MACD Advantages Optimised for Asia- London- US- Open-Session choose your personal times to trade - select Daytime and Weekdays Keltner-Channel => to reduce market noise - sideways movement will be hidden 3x Moving Averages => for the Trend,
FE Fibo Expansion
Syahirul Nizzam Bin Haron
This is Fibo Expansion. You can use it, as profit target at any level... It use price Highs and Lows and price between... It is simple and easy to use... No Input menu, just drag it on your chart and it ready to use... The blue and red dot color indicate it direction... It also use as the same as fractal high and low price as the points to construct the levels... No more analysis to choose the points..
FREE
This indicator is suitable for seeing trends and determining the time to open a position. It is equipped with a Stop Loss position. Easy to use. Just watch the arrows provided. Indicator parameters Shift - the number of bars used for the indicator shift to Right." Step Point per Period - the number of pips for down or Up trend lines" Time Frame - Calculate @ this Time Frame." Max_Bar - the number of bars used for calcuulate indicators (if '0' then All bars to calcuulate)." Alert_On - On or Off
I recommend you to read the   product's blog  (manual) from start to end so that it is clear from the beginning what the indicactor offers. This multi time frame and multi symbol supply and demand zone dashboard indicator sends alerts when the price has reached a supply/demand zone. It is also possible to use it to be alerted about regular double tops/bottoms instead of zones. It can be used with all time frames from M1 to MN. It is possible to use RSI, divergence (MACD, OsMA, RSI or Awesome) a
Features: Sharkfin Alerts Multi-timeframe Multi-currency SM TDI: To show TDI lines with sharkfin levels Zigzag MTF: To see Higher Timeframe trend Detailed blog post and extras: https://www.mql5.com/en/blogs/post/759138 Arrows works on a single timeframe and single currency. But it’s visually helps see that sharkfins. You can also get the simple arrows from mql5 site product: https://www.mql5.com/en/market/product/42405 About Scanner: It is an easy to use simplified scanner. It will show when
ForexGumpUltra
Andrey Kozak
3.25 (4)
ForexGumpUltra is a new and more advanced indicator of the ForexGump series. This indicator easily determines the price direction on any currency pair and any timeframe. The indicator draws its signals on the zero bar and does not redraw them (see the video). In the 34th second of the video it can be seen that this indicator uses new filters to determine the changes in price movement direction without delay, despite the market noise present at the moment (see the video on the 34th second). Once
Buy and Sell Power MT4
Marco Engstermann
5 (2)
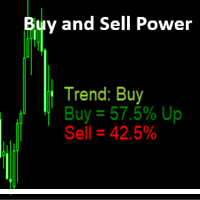
Simple Indicator that shows the   Buy and Sell   volume in percent. Settings : Font size for percentage labels Horizontal offset from right edge (pixels) Vertical offset for Signal label from bottom (pixels) Vertical offset for Buy label from bottom (pixels) Vertical offset for Sell label from bottom (pixels) Color for Buy label Color for Sell label Color for Strong Buy signal Color for Buy signal Color for Strong Sell signal Color for Sell signal Color for Neutral signal Default to every tick
FREE
Pivot levels Auto V1
Hafis Mohamed Yacine
What Is a Pivot Point? A pivot point is a technical analysis indicator, or calculations, used to determine the overall trend of the market over different time frames. The pivot point itself is simply the average of the intraday high and low, and the closing price from the previous trading day. On the subsequent day, trading above the pivot point is thought to indicate ongoing bullish sentiment, while trading below the pivot point indicates bearish sentimen How to Use Pivot Points The very ess
Divergence dashboard
Jan Flodin
4.64 (11)
I recommend you to read the   product's blog  (manual) from start to end so that it is clear from the beginning what the indicactor offers. This multi time frame and multi symbol divergence dashboard indicator sends an alert when one or two different divergences have been identified. It can be used with all time frames from M1 to MN. It is possible to enable moving average or RSI trend filter to filter out only the strongest setups. It should be combined with your own confirmation rules, techni
My Point MT4
Claudia Ramona Angerer
4 (1)
Diagnosis of major and minor pivot Trend detection with many signals Can be used in all symbols Can be used in all time frames Settings: Back Show: The number of candles it displays If you need any adjustments, or have any questions or suggestions, message me How to trade: Blue: sell signal Red: buy signal Blue and red at the same time: no signal Exit signal: Opposite signal
The indicator draws trend lines based on Thomas Demark algorithm. It draws lines from different timeframes on one chart. The timeframes can be higher than or equal to the timeframe of the chart, on which the indicator is used. The indicator considers breakthrough qualifiers (if the conditions are met, an additional symbol appears in the place of the breakthrough) and draws approximate targets (target line above/below the current prices) according to Demark algorithm. Recommended timeframes for t
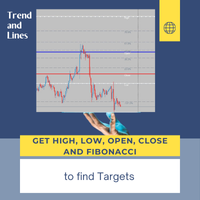
This indicator draws lines at the open, close, high and low price of the last chart candle from the set timeframe. In addition, a label shows whether it was an up or down candle. The standard settings follow the original idea of ​​getting the price data from the daily timeframe for day trading/scalping, but since this indicator is fully customizable, you can also set a different timeframe. Based on the drawn price lines, you can then also display Fibonacci levels. This function can also be
The Transition Trend indicator shows the points of potential market reversal. The indicator's smart algorithm detects the trend, filters out market noise and generates entry signals and exit levels. Simple, visual and efficient trend detection. Uses just one parameter for settings. The indicator does not redraw and does not lag. You can set up message alerts as sound or email. Works on all currency pairs and all timeframes. Ready-made trading system.
Effect
Maryna Shulzhenko
The Effect indicator shows the points of potential market reversal. Simple, visual and efficient trend detection. Ready-made trading system. The intelligent algorithm of the indicator determines the trend with good probability. Uses just one parameter for settings. The indicator does not redraw and does not lag. Works on all currency pairs and all timeframes. You should remember that using a combination of forecasting tools, it is advisable to choose 2-3 indicators for trading. Otherwise, thei
The Waddah Attar Explosion (WAE) indicator is a potent tool in Forex trading, offering buy, sell, exit buy, and exit sell signals. It assesses trends as trend power and momentum as explosion power. Trend Direction: - Green bars indicate a bullish trend. - Red bars indicate a bearish trend. Signal Line: - A line serves as a threshold for momentum. Buy Trade Setup: **Entry:** Go long when a green bar crosses above the threshold. Place a stop loss below the entry candle. **Exit:** Close the tra
Holy Trend PRO
Bianca Seara
5 (1)
About Holy Trend was developed to identify trend and strength. VIDEO (information and tips) [HERE] Features Identifies trend Identifies strength of trend Identifies lines of support and resistance Easy to analyze Fast signals All timeframes Not repaint (when candle close) No settings required Can be used in Renko charts Can be used with indicator Holy Renko PRO Alerts, email and push notifications Advantages Sensitive identifier of trend able to identify the long, short movements and correc
Breakout Hunter SR
Mazhar Ul Hassan Noorul Hassan Noor Ul Hassan
Overview Breakout Hunter is a powerful automated trading bot designed to identify and capitalize on breakouts from key Support & Resistance levels. It continuously scans the market for high-probability breakout opportunities, allowing traders to capture strong price movements with precision. Key Features Support & Resistance Detection: Identifies strong market levels to pinpoint breakout opportunities. Breakout & Fakeout Detection: Differentiates between true breakouts and false moves to impr
FREE
Fibonacci Trend Marker —  est un indicateur de tendance qui analyse le comportement de la bougie actuelle par rapport à la plage Haut-Bas (High-Low, HL) des bougies précédentes en utilisant les niveaux de retracement de Fibonacci. Il suit visuellement la force de la tendance, signalant un affaiblissement potentiel ou un renversement par un changement de couleur de la bougie. Caractéristiques: Conçu pour les traders axés sur les tendances, il permet d’identifier rapidement les changements de ten
FREE
VWap Bands EForex
Veridiana Adorno Kendrick
VWAP Bands Metatrader 4 Forex Indicator The VWAP Bands Metatrader 4 Forex indicator is a quite similar to the Bollinger bands, but it deploys volume weighted average as the core value of the bands. There is an option of using the tick volume or real volume for calculation when using the VWAP Bands Metatrader 5 custom forex indicator, especially when the forex broker displays symbol alongside real volume. Similarly, you can decide to have deviations calculated with the sample correction or not.
This indicator is designed to detect the best of all candlestick reversal patterns: Three Line Strike . According to the bestselling author and candlestick guru Thomas Bullkowski, this pattern has a winning percentage between 65% and 84% . This indicator scans for you up to 30 instruments (forex, indices or commodities) on up to 8 timeframes. You can get alerts via MetaTrader 4 and email if a Three Line Strike pattern occurs. Please note: Higher timeframes bring the most reliable signals. This i
Volume Scalping Indicator
Ahmad Ar Abedalaziz Alazaizeh
This automated VOLUME SCALPING INDICATOR can be utilized to manage trades and identify potential areas of support and resistance for both buying and selling. It is designed to identify zones for Sell/Buy trades based on the volume analysis and can be effectively used in conjunction with other indicators, such as order block indicators, and more. Currently designed for MT4, it will later be adapted to function on MT5. We also offer the opportunity to customize the robot according to your trading
FREE
Indicator for determining adjustments and price reversals It gives signals for inputs and shows the general direction of the price movement. Allows you to conduct trend and counter trend trading It works on all timeframes, on any currency pairs, metals and cryptocurrency Can be used when working with binary options Distinctive features Does not redraw; Thanks to simple settings, you can quickly adapt to any trading instrument; It works on all timeframes and on all symbols; Suitable for trading c
The Market Structures Pro indicator finds and displays 5 (five) patterns of the Smart Money Concepts (SMC) system on the chart, namely: Break Of Structures (BoS)       Change of character (CHoCH) Equal Highs & Lows Premium, Equilibrium and Discount zones with Fibo grid High-high, Low-low, High-low and Low-high extremes Patterns are displayed for two modes - Swing and Internal and are easily distinguished by color on the chart. Internal mode features higher contrast colors, finer lines, and smal
The   Pivot Point indicator   automatically calculates and displays the pivot point line and support and resistance levels. Pivot can be calculated according to the Classic, Floor, Fibonacci, Woodie, Camarilla or DeMark formula. It is also possible to select the period for calculating the indicator. A trader can choose from daily, weekly, monthly, or user-defined periods. Types of pivots Classic Floor Fibonacci Woodie Camarilla DeMark Main features The indicator shows the current and historic
FREE
The indicator plots flexible support and resistance levels (dots). A special phase of movement is used for construction. Levels are formed dynamically, that is, each new candle can continue the level or complete it. The level can provide resistance or support to the price even where it is no longer there. Also, support and resistance levels can change roles. The importance of levels is affected by: the amount of time the level is formed and the number of touches. The significance of these lev
Les acheteurs de ce produit ont également acheté
Gann Made Easy
Oleg Rodin
4.81 (132)
Gann Made Easy est un système de trading Forex professionnel et facile à utiliser qui est basé sur les meilleurs principes de trading en utilisant la théorie de mr. WD Gann. L'indicateur fournit des signaux d'ACHAT et de VENTE précis, y compris les niveaux Stop Loss et Take Profit. Vous pouvez échanger même en déplacement en utilisant les notifications PUSH. S'il vous plaît contactez-moi après l'achat! Je partagerai avec vous mes astuces de trading et d'excellents indicateurs bonus gratuitement!
M1 Sniper
Oleg Rodin
5 (5)
M1 SNIPER est un système d'indicateurs de trading facile à utiliser. Il s'agit d'un indicateur à flèche conçu pour l'unité de temps M1. Cet indicateur peut être utilisé seul pour le scalping sur l'unité de temps M1 ou intégré à votre système de trading existant. Bien que conçu spécifiquement pour le trading sur l'unité de temps M1, ce système peut également être utilisé avec d'autres unités de temps. Initialement, j'avais conçu cette méthode pour le trading du XAUUSD et du BTCUSD. Cependant, je
Cycle Maestro
Stefano Frisetti
TRADING avec CYCLEMAESTRO Le signal est simple et immédiat : dès que le fond d'une zone devient vert ou rouge, cela signifie qu'un signal de TRADING est actif : VERT = ACHAT et ROUGE = VENTE. Le TRADER peut ouvrir le TRADE et suivre les instructions suivantes.  REMARQUE : CYCLEMAESTRO est distribué uniquement sur ce site Web, il n'y a pas d'autres distributeurs. La version DEMO est fournie à titre de référence uniquement et n'est pas prise en charge. La version finale est prise en charge et
Dynamic Forex28 Navigator
Bernhard Schweigert
5 (5)
Dynamic Forex28 Navigator - L'outil de trading Forex de nouvelle génération. ACTUELLEMENT 49 % DE RÉDUCTION. Dynamic Forex28 Navigator est l'évolution de nos indicateurs populaires de longue date, combinant la puissance de trois en un : Advanced Currency Strength28 Indicator (695 avis) + Advanced Currency IMPULSE avec ALERT (520 avis) + CS28 Combo Signals (Bonus). Détails sur l'indicateur https://www.mql5.com/en/blogs/post/758844 Qu'offre l'indicateur de force de nouvelle génération ? Tout
Scalper Inside PRO
Alexey Minkov
4.74 (66)
An exclusive indicator that utilizes an innovative algorithm to swiftly and accurately determine the market trend. The indicator automatically calculates opening, closing, and profit levels, providing detailed trading statistics. With these features, you can choose the most appropriate trading instrument for the current market conditions. Additionally, you can easily integrate your own arrow indicators into Scalper Inside Pro to quickly evaluate their statistics and profitability. Scalper Inside
Algo Pumping MT4
Ihor Otkydach
4.92 (12)
PUMPING STATION – Votre stratégie personnelle «tout compris» Nous vous présentons PUMPING STATION – un indicateur Forex révolutionnaire qui transformera votre façon de trader en une expérience à la fois efficace et passionnante. Ce n’est pas seulement un assistant, mais un véritable système de trading complet, doté d’algorithmes puissants pour vous aider à trader de manière plus stable. En achetant ce produit, vous recevez GRATUITEMENT : Fichiers de configuration exclusifs : pour un réglage auto
Présentation de l'indicateur astronomique pour MT4 : Votre compagnon de trading céleste ultime Êtes-vous prêt à élever votre expérience de trading à des hauteurs célestes ? Ne cherchez pas plus loin que notre indicateur astronomique révolutionnaire pour MT4. Cet outil innovant transcende les indicateurs de trading traditionnels en exploitant des algorithmes complexes pour vous fournir des aperçus astronomiques inégalés et des calculs de précision. Un univers d'informations à portée de main : Con
Le système PRO Renko est un système de trading très précis spécialement conçu pour le trading de graphiques RENKO. Il s'agit d'un système universel qui peut être appliqué à divers instruments de négociation. Le système neutralise efficacement ce qu'on appelle le bruit du marché en vous donnant accès à des signaux d'inversion précis. L'indicateur est très facile à utiliser et n'a qu'un seul paramètre responsable de la génération du signal. Vous pouvez facilement adapter l'outil à n'importe que
Grabber System
Ihor Otkydach
5 (1)
Je vous présente un excellent indicateur technique : Grabber, qui fonctionne comme une stratégie de trading "tout-en-un", prête à l'emploi. En un seul code sont intégrés des outils puissants d'analyse technique du marché, des signaux de trading (flèches), des fonctions d'alerte et des notifications push. Chaque acheteur de cet indicateur reçoit également gratuitement : L'utilitaire Grabber : pour la gestion automatique des ordres ouverts Un guide vidéo étape par étape : pour apprendre à installe
Trend Screener
STE S.S.COMPANY
4.79 (94)
Indicateur de tendance, solution unique révolutionnaire pour le trading et le filtrage des tendances avec toutes les fonctionnalités de tendance importantes intégrées dans un seul outil ! Il s'agit d'un indicateur multi-période et multi-devises 100 % non repeint qui peut être utilisé sur tous les symboles/instruments : forex, matières premières, crypto-monnaies, indices et actions. OFFRE À DURÉE LIMITÉE : L'indicateur Support and Resistance Screener est disponible pour seulement 50 $ et à vie. (
Gold Stuff
Vasiliy Strukov
4.85 (262)
Gold Stuff est un indicateur de tendance conçu spécifiquement pour l'or et peut également être utilisé sur n'importe quel instrument financier. L'indicateur ne se redessine pas et ne traîne pas. Délai recommandé H1. Au niveau de l'indicateur de travail, l'Expert Advisor EA Gold Stuff est entièrement automatique. Vous pouvez le trouver sur mon profil. Vous pouvez obtenir une copie gratuite de notre indicateur Strong Support et Trend Scanner, veuillez envoyer un message privé. moi! Contactez-mo
FX Volume
Daniel Stein
4.6 (35)
FX Volume : Découvrez le Sentiment du Marché tel que perçu par un Courtier Présentation Rapide Vous souhaitez faire passer votre approche de trading au niveau supérieur ? FX Volume vous fournit, en temps réel, des informations sur la manière dont les traders particuliers et les courtiers sont positionnés—bien avant la publication de rapports retardés comme le COT. Que vous visiez des gains réguliers ou recherchiez simplement un avantage plus solide sur les marchés, FX Volume vous aide à repére
Quantum Profile System  —   is a comprehensive professional trading system with advanced algorithms. It combines trend direction analysis, volume concentration at key levels, dynamic adaptation to market volatility, and signal generation without delays or repainting. Quantum Profile System integrates the functionality of a volume profile based on linear regression with an adaptive trend channel using ATR. It features volume profiles with construction and display in two directions. Multi-level v
PZ Trend Trading
PZ TRADING SLU
4.8 (5)
Capture every opportunity: your go-to indicator for profitable trend trading Trend Trading is an indicator designed to profit as much as possible from trends taking place in the market, by timing pullbacks and breakouts. It finds trading opportunities by analyzing what the price is doing during established trends. [ Installation Guide | Update Guide | Troubleshooting | FAQ | All Products ] Trade financial markets with confidence and efficiency Profit from established trends without getting whip
Hydra Trend Rider is a non-repainting, multi-timeframe trend indicator that delivers precise buy/sell signals and real-time alerts for high-probability trade setups. With its color-coded trend line, customizable dashboard, and mobile notifications, it's perfect for traders seeking clarity, confidence, and consistency in trend trading. Download the Metatrader 5 Version Message us here after purchase to get the Indicator Manual. HURRY!   FLASH SALE is  ON . Price  increasing soon! Read the product
True Direction Oscillator
Muhammad Elbermawi
4.86 (361)
Ou (TDO) qui est un indice qui mesure le taux de variation des prix en utilisant le principe du « Pure Momentum ». Lorsque le prix d'un titre augmente de 10 à 15, le taux de variation du prix est de 150 %, mais lorsqu'il redescend de 15 à 10, le taux de variation du prix n'est que de 33,3 %. C'est pourquoi les indicateurs d'analyse technique tels que « Taux de variation des prix » (ROC) ou « Momentum » donnent des lectures plus élevées pour les mouvements de prix ascendants que ceux donnés aux m
Currency Strength Exotics
Bernhard Schweigert
4.88 (32)
ACTUELLEMENT 20% DE RÉDUCTION ! La meilleure solution pour tout débutant ou trader expert ! Cet indicateur est spécialisé pour montrer la force de la devise pour tous les symboles comme les paires exotiques, les matières premières, les indices ou les contrats à terme. C'est le premier de son genre, n'importe quel symbole peut être ajouté à la 9ème ligne pour montrer la force réelle de la devise de l'or, l'argent, le pétrole, DAX, US30, MXN, TRY, CNH etc. Il s'agit d'un outil de trading unique
ACTUELLEMENT 31% DE RÉDUCTION ! ! La meilleure solution pour tout débutant ou Expert Trader ! Cet indicateur est un outil de trading unique, de haute qualité et abordable car nous avons incorporé un certain nombre de caractéristiques exclusives et une formule secrète. Avec seulement UN graphique, il donne des alertes pour les 28 paires de devises. Imaginez comment votre trading s'améliorera parce que vous serez capable de repérer le point de déclenchement exact d'une nouvelle tendance ou d'un
FX Power MT4 NG
Daniel Stein
4.94 (18)
FX Power : Analysez la force des devises pour des décisions de trading plus intelligentes Aperçu FX Power est l'outil essentiel pour comprendre la force réelle des principales devises et de l'or, quelles que soient les conditions du marché. En identifiant les devises fortes à acheter et les faibles à vendre, FX Power simplifie vos décisions de trading et révèle des opportunités à forte probabilité. Que vous suiviez les tendances ou anticipiez les retournements à l'aide de valeurs extrêmes de D
TPSproTREND PrO
Roman Podpora
4.68 (25)
VERSION MT5        —        ИНСТРУКЦИЯ RUS           —        INSTRUCTIONS  ENG Fonctions principales : Signaux d'entrée précis SANS RENDU ! Si un signal apparaît, il reste d’actualité ! Il s'agit d'une différence importante par rapport aux indicateurs de redessinage, qui peuvent fournir un signal puis le modifier, ce qui peut entraîner une perte de fonds en dépôt. Vous pouvez désormais entrer sur le marché avec plus de probabilité et de précision. Il existe également une fonction de coloration
Dark Absolute Trend
Marco Solito
4.58 (40)
Dark Absolute Trend   is an Indicator for intraday trading. This Indicator is based on Trend Following  strategy but use also candlestick patterns and Volatility. We can enter in good price with this Indicator, in order to follow the main trend on the current instrument. It is advised to use low spread ECN brokers. This Indicator does Not repaint and N ot lag . Recommended timeframes are M5, M15 and H1. Recommended working pairs: All. I nstallation and  Update Guide   -  Troubleshooting guide  
Volatility Trend System - un système de trading qui donne des signaux pour les entrées. Le système de volatilité donne des signaux linéaires et ponctuels dans le sens de la tendance, ainsi que des signaux pour en sortir, sans redessiner ni retarder. L'indicateur de tendance surveille la direction de la tendance à moyen terme, montre la direction et son changement. L'indicateur de signal est basé sur les changements de volatilité et montre les entrées sur le marché. L'indicateur est équipé de pl
Bermaui Deviation Percent
Muhammad Elbermawi
4.94 (111)
Ou ( BD% ) qui est un indice de volatilité qui mesure la volatilité en pourcentage plutôt qu'en points. L'idée de BD% est de créer un indice en fonction de l'écart type classique (CSD) qui évolue entre 0 et 100 pour cent. Vous pouvez utiliser BD% pour comparer la volatilité d'un même titre sur différentes périodes ou sur différentes périodes. De plus, vous pouvez utiliser BD% pour comparer la volatilité entre différents titres sur différents marchés en termes de pourcentage plutôt que de points
ACTUELLEMENT 20% DE RÉDUCTION ! La meilleure solution pour tout débutant ou trader expert ! Cet indicateur est un outil de trading abordable car nous avons incorporé un certain nombre de caractéristiques exclusives ainsi qu'une nouvelle formule. L'Indicateur Avancé de Volume Accumulé de Devises est spécialisé pour les 28 principales paires Forex et fonctionne sur tous les cadres temporels. Il s'agit d'une nouvelle formule qui, sur un seul graphique, extrait tout le volume des devises (C-Volu
TPSpro RFI Levels
Roman Podpora
4.85 (27)
Zones de retournement / Volumes de pointe / Zones actives d'un acteur majeur =       SYSTÈME TS TPSPRO INSTRUCTIONS RUS       /       INSTRUCTIONS       FR       /       Version MT5 Chaque acheteur de cet indicateur reçoit en plus GRATUITEMENT : 6 mois d'accès aux signaux de trading du service RFI SIGNALS - points d'entrée prêts à l'emploi selon l'algorithme TPSproSYSTEM. Supports de formation avec mises à jour régulières - plongez-vous dans la stratégie et développez votre niveau professionne
FX Levels MT4
Daniel Stein
5 (2)
FX Levels : Des zones de Support et Résistance d’une Précision Exceptionnelle pour Tous les Marchés Présentation Rapide Vous recherchez un moyen fiable pour déterminer des niveaux de support et résistance dans n’importe quel marché—paires de devises, indices, actions ou matières premières ? FX Levels associe la méthode traditionnelle « Lighthouse » à une approche dynamique de pointe, offrant une précision quasi universelle. Grâce à notre expérience réelle avec des brokers et à des mises à jour
Black dragon indicator
Ramil Minniakhmetov
4.81 (121)
L'indicateur de détection de tendance complètera toute stratégie et peut également être utilisé comme un outil indépendant. IMPORTANT! Contactez-moi immédiatement après l'achat pour recevoir des instructions et un bonus ! Recommandations pour travailler avec l'indicateur, vous pouvez télécharger en commentaire #5 Avantages Facile à utiliser, ne surcharge pas le graphique avec des informations inutiles ; Capacité à utiliser comme filtre pour n'importe quelle stratégie ; Il a des niveaux inté
Cycle Sniper
Elmira Memish
4.39 (36)
NEW YEAR SALE PRICE FOR LIMITED TIME!!! Please contact us after your purchase and we will send you the complimentary indicators to complete the system Cycle Sniper is not a holy grail but when you use it in a system which is explained in the videos, you will feel the difference. If you are not willing to focus on the charts designed with Cycle Sniper and other free tools we provide, we recommend not buying this indicator. We recommend watching the videos about the indiactor and system before pu
Ce tableau de bord affiche les derniers modèles harmoniques disponibles pour les symboles sélectionnés, ce qui vous permettra de gagner du temps et d'être plus efficace / version MT5 . Indicateur gratuit: Basic Harmonic Pattern Colonnes de l'indicateur Symbol : les symboles sélectionnés apparaissent Trend : haussière ou baissière Pattern : type de motif (gartley, papillon, chauve-souris, crabe, requin, cypher ou ABCD) Entry: prix d'entrée SL: prix du stop loss TP1: 1er prix de prise de profi
Le TPX Dash Needle est tout ce dont vous avez besoin pour trouver, dans plusieurs unités de temps et dans plusieurs paires en même temps, les fameuses Didi Needles, qui sont la rencontre simultanée des moyennes 3, 8 et 20 qui, alignées avec l'indicateur ADX, sont synonymes de mouvements importants et forts sur le marché. Sans frais mensuels, vous obtenez un outil à un prix équitable qui, placé sur un VPS, envoie le message instantanément sur votre téléphone portable, vous donnant plus de temps
Plus de l'auteur
The indicator identifies when a divergence occurs between price and an indicator or oscillator. It identifies both regular and hidden divergences. Combined with your own rules and techniques, this indicator will allow you to create (or enhance) your own powerful system. For higher probability setups I can recommend you to use my Supply Demand indicator and trade only if the divergence occurs inside a zone. Supply zone for bearish div and demand zone for bullish div. The optimal scenario is if it
FREE
Cet indicateur dessine des zones d'offre et de demande sur le graphique. Associé à vos propres règles et techniques, cet indicateur vous permettra de créer (ou d'améliorer) votre propre système puissant. Veuillez également consulter la   version payante   qui offre bien plus. Ma recommandation est de rechercher des opportunités de trading où le premier test de zone se produit après au moins 25 barres. Caractéristiques Les zones ont 3 couleurs (réglables par entrée). Couleur foncée pour la zone n
FREE
Cet indicateur reconnaît un type spécial de formation de barre intérieure qui est formée d'une grande bougie principale suivie de 4 bougies plus petites (veuillez consulter l'explication de la stratégie ci-dessous). Caractéristiques Trace les lignes d'arrêt d'achat/vente sur le graphique ainsi que les niveaux de profit et d'arrêt de perte. Les niveaux TP/SL sont basés sur l'indicateur Average True Range (ATR). Les couleurs des objets sont modifiables. Vous envoie une alerte en temps réel lorsqu'
Cet indicateur dessine des zones d'offre et de demande sur le graphique. Associé à vos propres règles et techniques, cet indicateur vous permettra de créer (ou d'améliorer) votre propre système puissant. Veuillez également consulter la   version payante   qui offre bien plus. Ma recommandation est de rechercher des opportunités de trading où le premier test de zone se produit après au moins 25 barres. Caractéristiques Les zones ont 3 couleurs (réglables par entrée). Couleur foncée pour la zone n
FREE
This multi time frame and multi symbol indicator scans for pin bars. Combined with your own rules and techniques, this indicator will allow you to create (or enhance) your own powerful system. Features Can monitor all symbols visible in your Market Watch window at the same time. Apply the indicator to just one chart and instantly monitor the entire market. Can monitors every time frame, from M1 to MN, and sends you a real-time alert when a pin bar is identified. All Metatrader native alert types
This indicator can send alerts when a Heiken Ashi Smoothed color change occurs. Combined with your own rules and techniques, this indicator will allow you to create (or enhance) your own powerful system. Features Can send all types of alerts. Option to delay the alert one or more bars in order to confirm the color (trend) change. Input parameters Candle shift for alert: Default is 1. Setting it to 0 will alert you on color change on the current candle. This should be regarded as a pending (uncon
FREE
Cet indicateur de tableau de bord de divergence multi périodes et multi symboles envoie une alerte lorsqu'une ou deux divergences différentes ont été identifiées sur plusieurs périodes et non sur des divergences uniques. Il peut être utilisé avec toutes les plages horaires de M1 à MN. Un maximum de 9 périodes peuvent être affichées dans le tableau de bord en même temps. Il est possible d'activer le filtre de tendance de la moyenne mobile, du RSI ou des bandes de Bollinger pour filtrer uniquement
I recommend you to read the   product's blog  (manual) from start to end so that it is clear from the beginning what the indicactor offers. This multi time frame and multi symbol indicator can identify the following 5 crosses: when a fast moving average crosses a slow moving average line. when price has reached a single moving average (closed above/below or just bounced). when a triple moving average formation has appeared (all 3 MA:s in consecutive alignment) when the MACD main line crosses th
L'indicateur identifie quand une divergence se produit entre le prix et un oscillateur/indicateur. Il identifie à la fois les divergences régulières et cachées. Il dispose d'une option de filtre RSI qui permet de filtrer uniquement les configurations les plus puissantes. L'indicateur offre également des options pour attendre une formation engloutissante, une cassure du canal Donchian ou que le prix croise une moyenne mobile   (voir capture d'écran #3)       pour confirmer la divergence avant de
This multi indicator/oscillator (hereafter indicator), multi time frame and multi symbol indicator identifies when a divergence occurs between price and one, two or three indicators. It identifies both regular/classical (trend reversal) and hidden (trend continuation) divergences. It has RSI and MA trend filter options which makes it possible to filter out only the strongest setups. Combined with your own rules and techniques, this indicator will allow you to create (or enhance) your own powerfu
The indicator identifies when a divergence occurs between price and an indicator or oscillator. It identifies bullish and bearish hidden or regular (classical) divergences. Combined with your own rules and techniques, this indicator will allow you to create (or enhance) your own powerful system. For higher probability setups I can recommend you to use my  Supply Demand indicator  and trade only if the divergence occurs inside a zone. Supply zone for bearish div and demand zone for bullish div. T
FREE
This indicator can send alerts when a Heiken Ashi Smoothed color change occurs. Combined with your own rules and techniques, this indicator will allow you to create (or enhance) your own powerful system. Features Can send all types of alerts. Option to delay the alert one bar in order to confirm the color (trend) change. Input parameters Wait for candle close: 'true' or 'false'. Setting it to 'true' will delay the alert to the opening of the bar following the bar where the color change occurred.
FREE
Je vous recommande de lire le   blog (manuel) du produit   du début à la fin afin que ce soit clair dès le début ce que propose EA. Cet Expert Advisor identifie lorsqu'une divergence se produit entre le prix et un oscillateur/indicateur. Il identifie à la fois les divergences régulières/classiques (inversion de tendance) et cachées (poursuite de la tendance). Il propose des options de zone offre/demande, RSI, Bollinger, stochastique, moyenne mobile (MA régulière et Hull MA), ADX et filtre de vo
Veuillez si possible envisager d'acheter le       Version MT5   que je continuerai à développer (il n'y aura pas de futures mises à jour pour cette version MT4). Je vous recommande également de lire       blog du produit   (manuel) du début à la fin afin qu'il soit clair dès le début ce que propose l'EA. La stratégie principale de cet Expert advisor (EA) est de placer des trades lorsque 3 moyennes mobiles (MA) sont alignées consécutivement et à une certaine distance l'une de l'autre (elle peut
Cet indicateur de zone d'offre et de demande dessine les zones sur le graphique et envoie des alertes lorsque le prix a atteint ou cassé une zone. Il est également possible de l'utiliser pour être alerté des doubles hauts/bas réguliers au lieu des zones. Il est possible d'utiliser des filtres RSI, de volume et de divergence pour filtrer uniquement les configurations les plus fortes. Combiné avec vos propres règles et techniques, cet indicateur vous permettra de créer (ou d'améliorer) votre propr
Cet indicateur à plusieurs périodes et à plusieurs symboles identifie les formations haut/bas doubles ou triples ou une cassure de décolleté suivante (haut/bas confirmé). Il offre des filtres RSI, pin bar, engloutissant, pince à épiler, étoile du matin/soir ainsi que des options de filtre de divergence qui permettent de filtrer uniquement les configurations les plus fortes.       L'indicateur peut également être utilisé en mode graphique unique. Veuillez en savoir plus sur cette option dans le p
Divergence dashboard
Jan Flodin
4.64 (11)
I recommend you to read the   product's blog  (manual) from start to end so that it is clear from the beginning what the indicactor offers. This multi time frame and multi symbol divergence dashboard indicator sends an alert when one or two different divergences have been identified. It can be used with all time frames from M1 to MN. It is possible to enable moving average or RSI trend filter to filter out only the strongest setups. It should be combined with your own confirmation rules, techni
I  recommend you to read the   product's blog  (manual) from start to end so that it is clear from the beginning what the indicator offers. In addition to finding bullish and bearish Three line strike formations this multi symbol and mutli time frame indicator can also scan for the following candlestick patterns (please see screenshots for explanation of the patterns): Three white soldiers (reversal>continuation pattern) Three black crows (reversal>continuation pattern) The formations do not ap
Cet indicateur de zone d'offre et de demande dessine les zones sur le graphique et envoie des alertes lorsque le prix a atteint ou cassé une zone. Il est également possible de l'utiliser pour être alerté des doubles hauts/bas réguliers au lieu des zones. Il est possible d'utiliser des filtres RSI, de volume et de divergence pour filtrer uniquement les configurations les plus fortes. Combiné avec vos propres règles et techniques, cet indicateur vous permettra de créer (ou d'améliorer) votre propr
Je vous recommande de lire le       le blog du produit   (manuel) du début à la fin afin qu'il soit clair dès le début ce que l'indicateur offre. Cet indicateur multi-périodes et multi-symboles recherche les barres de pin. Associé à vos propres règles et techniques, cet indicateur vous permettra de créer (ou d'améliorer) votre propre système puissant. Caractéristiques Vous pouvez surveiller simultanément tous les symboles visibles dans votre fenêtre Market Watch. Appliquez l'indicateur à un seu
I  recommend you to read the   product's blog  (manual) from start to end so that it is clear from the beginning what the indicator offers. This multi time frame and multi symbol indicator scans for engulfing and tweezer formations. The indicator can also be used in single chart mode. Combined with your own rules and techniques, this indicator will allow you to create (or enhance) your own powerful system. Features Can monitor all symbols visible in your Market Watch window at the same time. Ap
This multi time frame and multi symbol indicator identifies high-probability breakout patterns. It does this by identifying strong, symmetrical pennants and triangles. This pattern DOES NOT appear very often on higher time frames. But when it does, it is a very high-probability setup. The indicator also includes an Inside bars scanner. It can for example be used to detect a special type of Inside bars formation which is formed by a Master candle (MC) followed by 4 inside candles (please see the
Features This is an indicator that recognizes a special type of Inside Bar formation which is formed by a Master candle followed by 4 smaller candles (please see the strategy explanation below). Plots buy/sell stop lines on the chart as well as well as take profit and stop loss levels. The TP/SL levels are based on the Average True Range (ATR) indicator. Object colors are changeable. Sends you a real-time alert when a Master candle formation is identified - sound / pop-up / email / push notifica
This multi time frame and multi symbol indicator scans for Pin bars, Morning/Evening stars, Engulfings, Tweezers, Three line strikes, Inside bars and Pennants and Triangles. The indicator can also be used in single chart mode. Please read more about this option in the product's blog . Combined with your own rules and techniques, this indicator will allow you to create (or enhance) your own powerful system. Features Can monitor all symbols visible in your Market Watch window at the same time. App
I  recommend you to read the   product's blog  (manual) from start to end so that it is clear from the beginning what the indicator offers. This multi symbol and multi time frame indicator scans for the following candlestick patterns (please see screenshot for explanation of the patterns): Three white soldiers (reversal>continuation pattern) Three black crows (reversal>continuation pattern) Bullish and bearish Three line strike (reversal pattern) The patterns do not appear very often on higher
Cet indicateur multi-temps et multi-symboles permet d'identifier les 5 croix suivantes : lorsqu'une moyenne mobile rapide croise une ligne moyenne mobile lente. lorsque le prix a atteint une moyenne mobile unique (fermé au-dessus/au-dessous ou rebondi). lorsqu'une formation de moyenne mobile triple est apparue (tous les 3 MA:s en alignement consécutif). lorsque la ligne principale MACD croise la ligne de signal. lorsque la ligne de signal croise la ligne MACD zéro (0). Combiné à vos propres règl
L'indicateur identifie lorsqu'une divergence se produit entre le prix et un oscillateur/indicateur. Il identifie à la fois les divergences haussières et baissières. Il dispose d'une option de filtre RSI qui permet de filtrer uniquement les configurations les plus fortes. L'indicateur offre également des options pour attendre une cassure du canal Donchian ou que le prix croise une moyenne mobile (voir capture d'écran #3) pour confirmer la divergence avant de signaler l'opportunité commerciale. Co
I recommend you to read the   product's blog  (manual) from start to end so that   it is clear from the beginning what the indicator offers. This multi oscillator, multi time frame and multi symbol indicator identifies when a divergence occurs between price and an oscillator/indicator. It identifies both regular/classical (trend reversal) and hidden (trend continuation) divergences. It has moving average, RSI/Bollinger, ADX, pin bar and engulfing filter options which makes it possible to filter
This multi indicator/oscillator (hereafter indicator), multi time frame and multi symbol indicator identifies when a divergence occurs between price and one, two or three indicators. It identifies both regular/classical (trend reversal) and hidden (trend continuation) divergences. It has RSI and MA trend filter options which makes it possible to filter out only the strongest setups. Combined with your own rules and techniques, this indicator will allow you to create (or enhance) your own powerfu
Cet indicateur multi-temps et multi-symboles identifie le moment où la ligne de signal stochastique croise la ligne principale stochastique. En prime, il peut également rechercher les bandes de Bollinger et les croisements de surachat/survente RSI. Combiné à vos propres règles et techniques, cet indicateur vous permettra de créer (ou d'améliorer) votre propre système puissant. Caractéristiques Peut surveiller tous les symboles visibles dans votre fenêtre Market Watch en même temps. Appliquez l'i
Filtrer:
MP_mpap
426
MP_mpap 2024.02.26 15:30 
 

It's not just a simple scanner for DB & DT. It has the ability to notify early, allowing for processing time. It becomes very powerful when you apply the provided filters. On this note, I would like some confirmed settings... The fact that the signals are recorded and remain in the MT4 window is a fantastic idea. The way the indicator operates is close to the trader and deviates from the mindset of simple programming. Kudos to the creator. Excellent work!!! The best in its category. I will also purchase the scanner for S&R. It saves me from tasks I've been doing for years on my charts.

Carlos Thomas
152
Carlos Thomas 2023.12.28 10:45 
 

Excellent tool to scan and filter for better condition setups.

Suzanne
742
Suzanne 2023.09.09 22:22 
 

I have purchased numerous indicators and spent/wasted thousands of dollars. I wish I had found this indicator sooner and the support from Jan is phenomenal. I have never met a seller that is so helpful to me as a newbie and takes his time to explain everything in detail in order for you to also be a successful forex trader. I agree 100% with Randy Katz, I wish there were more people like Jan in the world. I feel extremely lucky to have found this indicator but even luckier to have found Jan. I cannot thank him enough.

Bjørn Voss
140
Bjørn Voss 2023.02.23 21:09 
 

I own >15 paid indicators, most I would not have bought today. If I only was allowed to buy one indicator then this would be the one. Have customized settings to only give alert if a Higher top is formed. Then waiting for first signs of direction change. Only thing that would improve this product is. If it could send a screenshot of the chart directly to a named telegram user/group. Then I would pay 10 times the price.

brightstar1
1884
brightstar1 2021.12.04 14:14 
 

A very good tool if you want to earn in the market. Only short coming is, if it had mobile alert, that would be perfect. Your screen time will be zero and you'll wait for alerts on mobile only. It has email alerts instead. But I don't use that feature.

Jan Flodin
132842
Réponse du développeur Jan Flodin 2021.12.04 14:19
Thanks for the review :-)
I would just like to point out that mobile alert (push alert) is supported since I first published this indicator back in 2018.
Suvashish Halder
90353
Suvashish Halder 2021.10.10 21:10 
 

I become a big fan of Jan Products. A++ Rated Work. Thank you, Jan 🥰

sudiang
222
sudiang 2021.09.25 10:22 
 

very helpfull indicator and supportive developer

skyree904
46
skyree904 2021.01.31 06:05 
 

will not run on my mt4 :(

Jan Flodin
132842
Réponse du développeur Jan Flodin 2021.01.31 06:30
I am sorry to hear that the indicator won't run. I am also sorry that you never gave me an opportunity to ask for more (in depth) info and let me help you to actively solve the issue. There could be a hundreds reason why an indicator won't run in Metatrader. Must not always be connected with the indicator itself. For instance I would have asked for the settings you are currently using and for any related error messages in the Experts or Journal tabs. In most of the cases issues are to be found within the settings which were changed by the trader.
Randy Katz
1427
Randy Katz 2018.10.27 03:54 
 

This is a great tool for detecting the dt/db condition. The author goes way out of his way to support it and provide updates when necessary. I wish there were more people like him in the world!

sunnychow
9050
sunnychow 2018.04.08 11:08 
 

This is a good tool, it has the shift candle to more confirm the pattern.

Répondre à l'avis
Version 2.9 2023.12.08
*** Please always make a backup of the existing indicator (the .ex4 file) before you make an update ***

Change log:
- added the option to set Strice mode for scanning double tops/bottoms (not supported in triple scanning mode). If enabled then ZigZag logic will be used.
- new additional input for symbols.
Version 2.8 2023.11.23
*** Please always make a backup of the existing indicator (the .ex4 file) before you make an update ***

Change log:
- bug fix in the MA trend filter
Version 2.7 2023.11.23
*** Please always make a backup of the existing indicator (the .ex4 file) before you make an update ***

Change log:
- bug fix in the arrow drawing. The arrow was drawn one candle to early when value in the 'Wait for candle close for alert (neckline only)' input was set to False
- added a moving average (MA) trend filter
Version 2.6 2023.04.19
*** Please always make a backup of the existing indicator (the .ex4 file) before you make an update ***

Change log:
- added OsMA, Stochastic and CCI to the list of divergences
- added Three line strike to the list of candle patterns
- added an option to write the signals as global variables instead of to a file (to be used by an EA)
Version 2.5 2021.12.28
*** Please always make a backup of the existing indicator (the .ex4 file) before you make an update ***

- bug fix in the divergence filter. This is not a mandatory update if you are not using the divergence filter.
Version 2.4 2021.12.15
*** Please always make a backup of the existing indicator (the .ex4 file) before you make an update ***

- add a possibility to select color for lines and other objects
- added drawing of a breakout arrow when in neckline breakout mode (confirmed top/bottom)
- added the possibilty set set the maximum amount of bars to wait for a neckline breakout
Version 2.3 2021.12.09
*** Please always make a backup of the existing indicator (the .ex4 file) before you make an update ***

- added the possibility to use the indicator in single chart mode (checking only one symbol and time frame). It will then draw the top/bottom on the chart where the indicator is running. This option is in some ways limited though. More information in the product's blog.
- added engulfing, tweezer and morning/evening star candle patterns filters as additional options to the existing pin bar filter.
Version 2.2 2021.11.26
*** Please always make a backup of the existing indicator (the .ex4 file) before you make an update ***

- corrected a bug in the divergence detection algorithm
Version 2.1 2021.10.08
*** Please always make a backup of the existing indicator (the .ex4 file) before you make an update ***

- added Awesome (AO) to the list of selectable divergences
- added the possibility to use the ATR indicator instead of points for calculating the offset
- added the possibility to add a custom text to the pop-up, push and mail alerts
- added the possibility to set a custom panel title
Version 2.0 2019.11.26
- added support for this Expert Advisor: https://www.mql5.com/en/market/product/43512
- added an option to set how many candles must be lower/higher prior to the first extremum candle (first top/bottom)
- added an option to decide the position of the neckline candle in order to get it more to the middle (between the 2 extremum candles). Using this option will make it a more clear U/V formation for those who desires that for their trading strategy
Version 1.9 2019.08.28
- corrected an error with incorrect drawing of lines in the strategy tester
Version 1.8 2019.02.17
- corrected an issue with the text file containing the signals
- added an option to clear signals in the text file in case of parameter change
- added an option to use symbols from the Market Watch window instead of the symbols written in the Symbols parameter
Version 1.7 2019.01.09
- a line between the 2 extremums as weel as the neckline will now automatically be drawn on the chart which opens up when a signal is clicked on in the panel
Version 1.5 2018.10.24
- added possibility to be alerted at trendline break-out instead
- added possibility to select if to use the RSI filter on first, last or both peaks
Version 1.4 2018.09.24
- bug fixes
Version 1.3 2018.09.21
- added possibility so select another (higher) time frame for divergence detection
- added possibility to use RSI divergence instead of MACD
- added possibility to select the divergence depth
- added neckline info to the alerts
- added option to search also for hidden divergences