Leonardo Harmonic Pattern Indicator MT4
- Indicatori
- Eda Kaya
- Versione: 2.1
Leonardo Harmonic Pattern Indicator MetaTrader 4
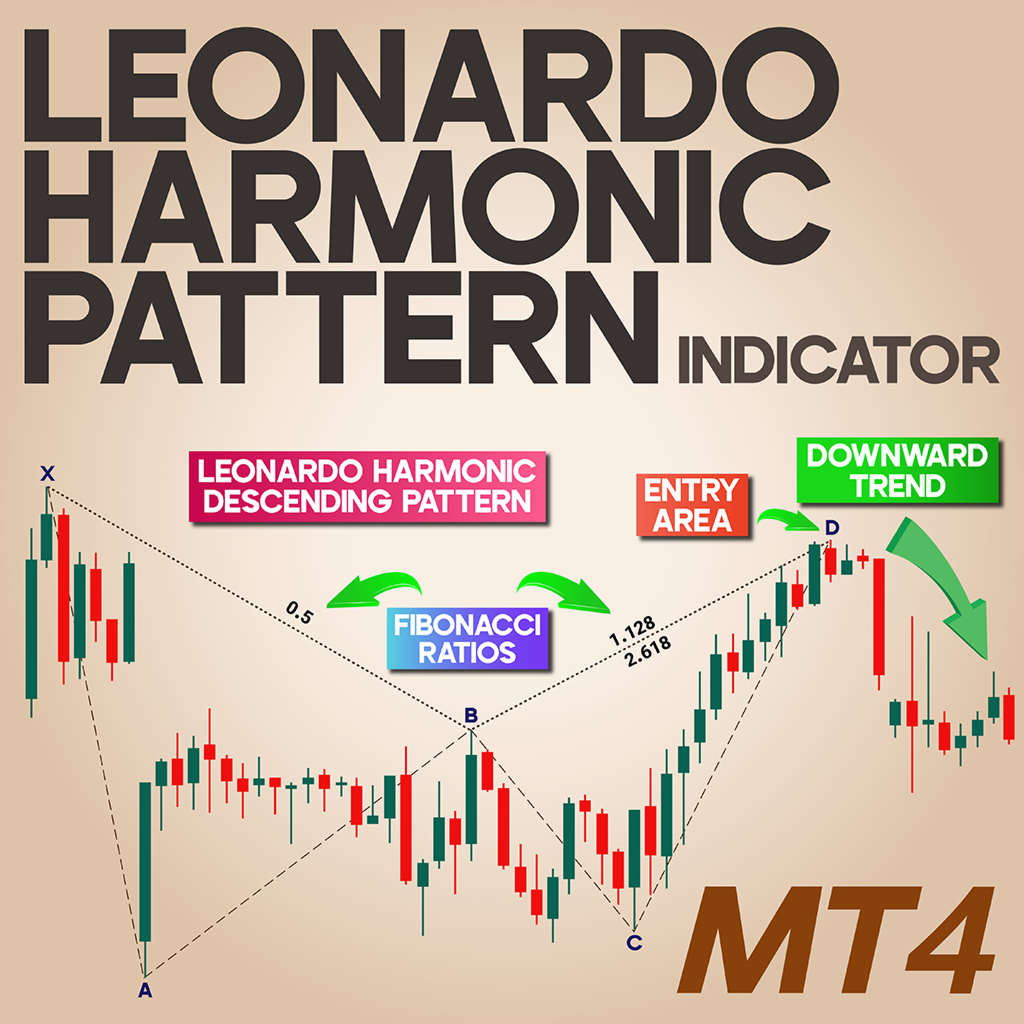
The Leonardo Harmonic Pattern Indicator is recognized as one of the most accurate tools for identifying price reversal zones using Fibonacci ratios in technical analysis. Designed for MetaTrader 4, this classic chart pattern indicator is similar to the Bat Pattern but differs significantly in its Fibonacci levels.
By clearly identifying the XA to CD wave sequences, traders can pinpoint precise entry or exit points. Key Fibonacci levels like 50%, 88.6%, and 261.8% play a central role in defining this pattern.
«Indicator Installation & User Guide»
MT4 Indicator Installation | Leonardo Harmonic Pattern Indicator MT5 | ALL Products By TradingFinderLab | Best MT4 Indicator: Refined Order Block Indicator for MT4 | Best MT4 Utility: Trade Assistant Expert TF MT4 | TP & SL Tool: Risk Reward Ratio Calculator RRR MT4 | Money Management: Easy Trade Manager MT4 | Trade Copier: Free Fast Local Trade Copier MT4 | Money management + prop protector: Trade Assist Prop Protector MT4
Leonardo Harmonic Pattern Indicator Specifications Table
The key features of the Leonardo Harmonic Pattern Indicator are presented in the table below:
| Category | Harmonic Pattern – Support and Resistance – Classic & Chart Patterns |
| Platform | MetaTrader 4 |
| Skill Level | Intermediate |
| Indicator Type | Continuation – Reversal |
| Timeframe | Multi-timeframe |
| Trading Style | Intraday Trading |
| Trading Market | All Markets |
Indicator Overview
Although many harmonic indicators share similar Fibonacci ratios, the Leonardo Harmonic Indicator features distinct measurements:
- XA: Can represent any initial price movement without specific requirements.
- AB: Retraces against XA and usually pulls back to about 50% of XA.
- BC: Moves in the opposite direction of AB and should measure either 38.2% or 88.6% of AB.
- CD: Opposes BC and completes the harmonic structure.
- AD: The total length from point A to D should be 78.6% of the XA wave to validate the pattern.
The CD leg’s length depends on the BC leg's ratio:
- If BC = 38.2% of AB → CD should be 112.8% of BC.
- If BC = 88.6% of AB → CD should be 261.8% of BC.
Uptrend Conditions
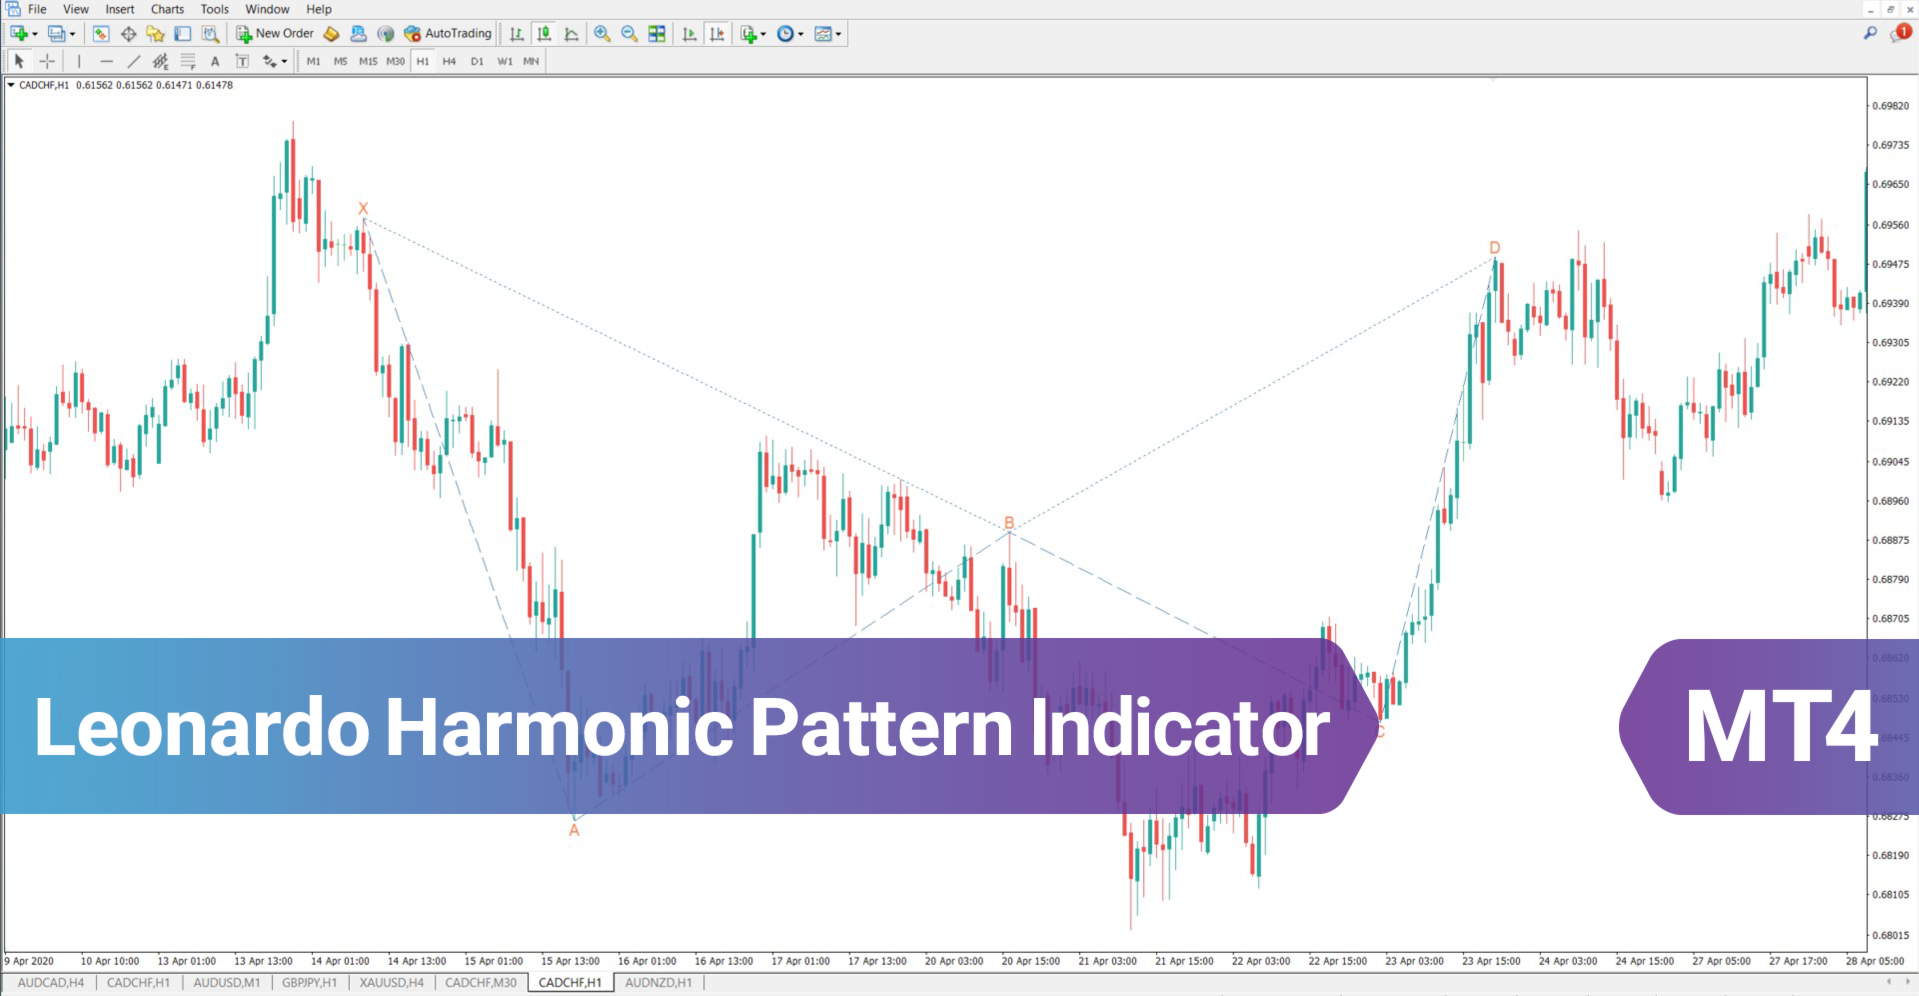
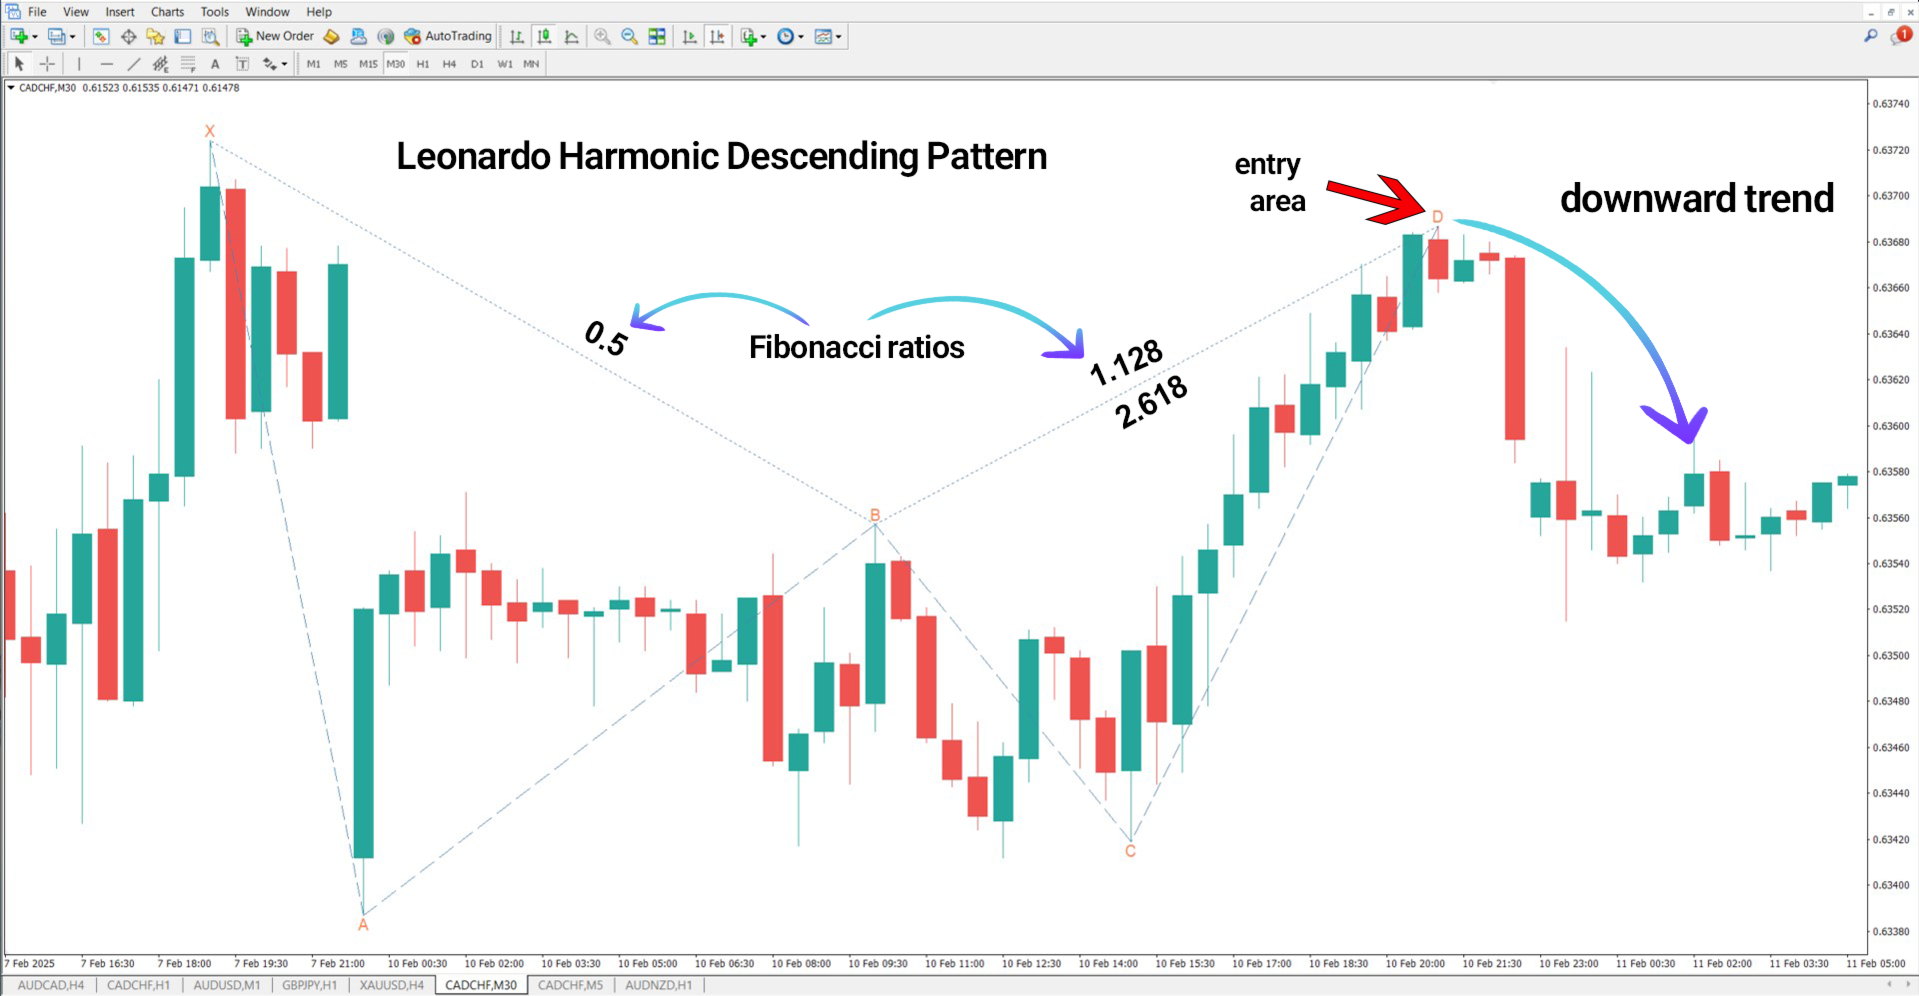
In the GBP/JPY chart example, the Leonardo Pattern is fully formed, and the indicator highlights XA through CD with point D marking a critical reversal zone. According to the specified Fibonacci levels, this zone signals a high probability of a shift from a bearish to bullish trend.
Downtrend Conditions
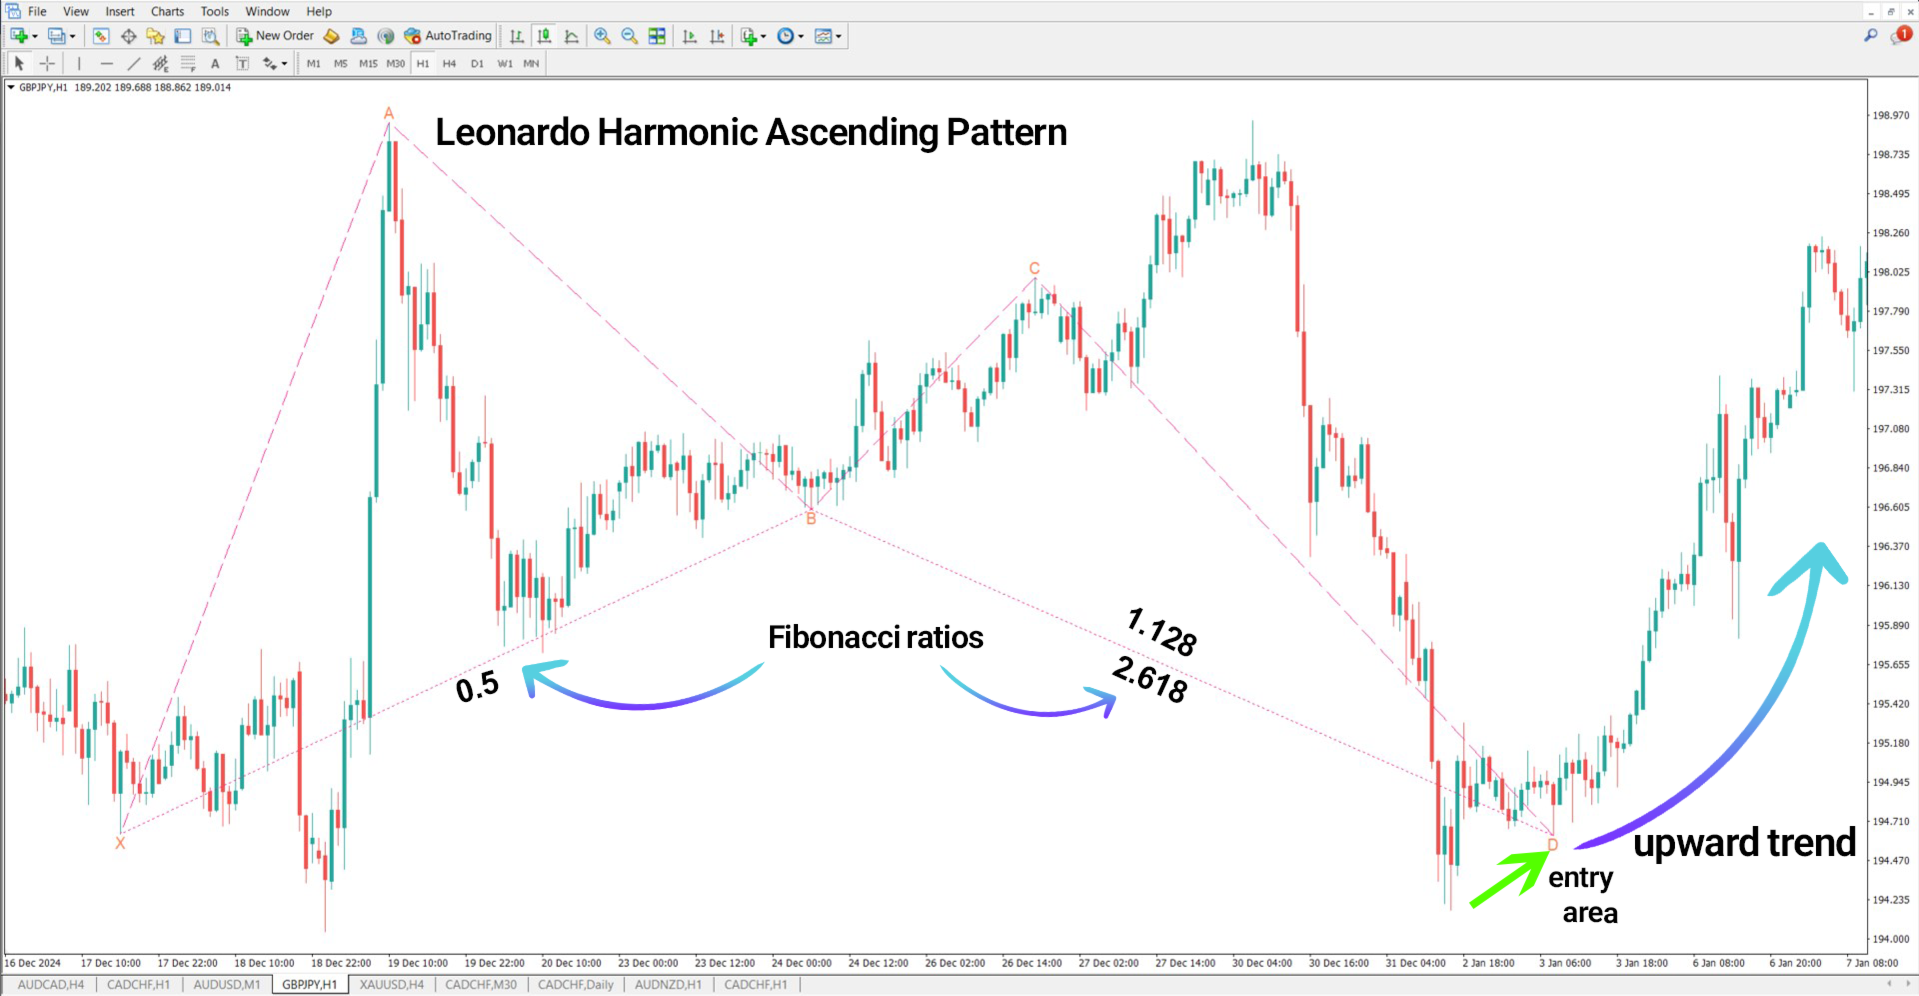
In a downtrend scenario involving the CAD/CHF pair, once the harmonic formation completes, point D is marked as a key area for potential trend reversal. The tool evaluates the Fibonacci relationship between AB, BC, and CD, indicating a strong chance of a downward reversal when the price nears point D.
Indicator Settings
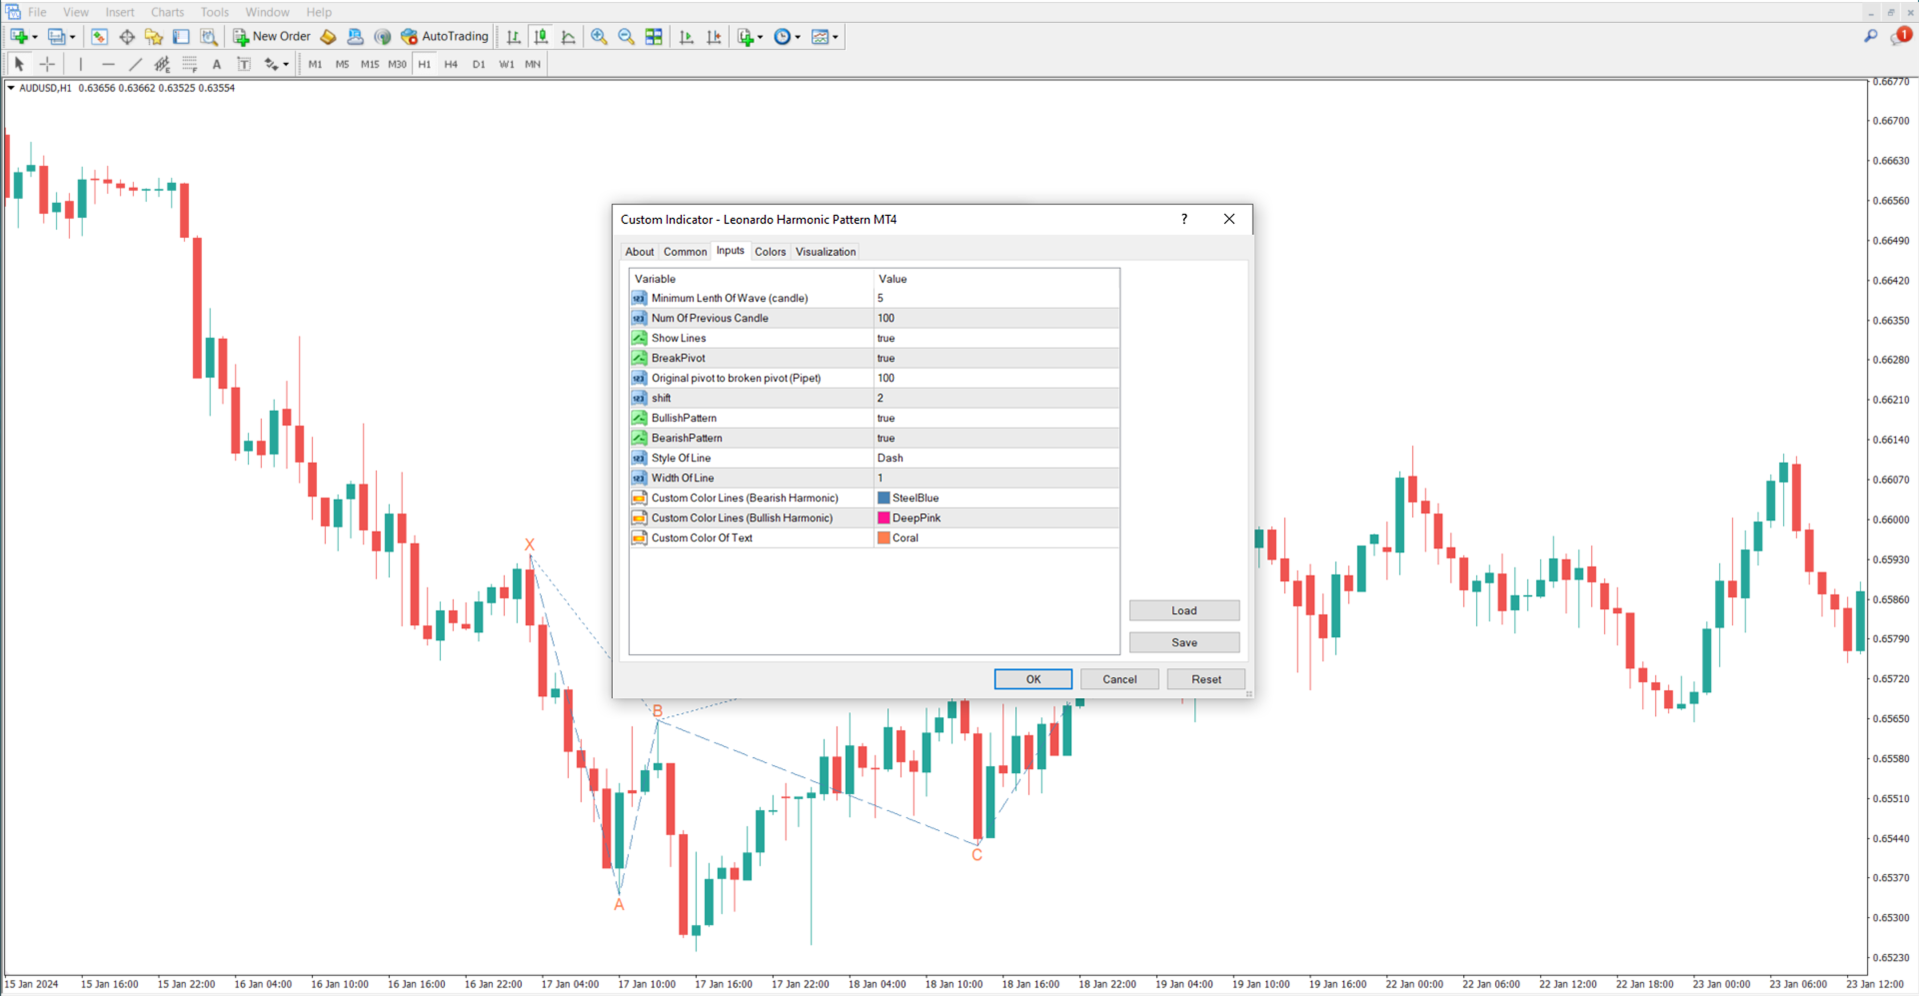
Here are the customizable settings included in the Leonardo Harmonic Pattern Indicator:
- Minimum Length Of Wave (candle): Minimum number of candles required for wave identification
- Num Of Previous Candle: Number of past candles analyzed
- Show Lines: Option to display or hide pattern lines
- BreakPivot: Enable detection of broken pivot points
- Original pivot to broken pivot (Pipet): Set the pipet distance between pivot levels
- Shift: Adjust visual placement of the indicator on the chart
- BullishPattern: Enable bullish pattern detection
- BearishPattern: Enable bearish pattern detection
- Style Of Line: Define the appearance of pattern lines
- Width Of Line: Set line thickness
- Custom Color Lines (Bearish Harmonic): Choose color for bearish patterns
- Custom Color Lines (Bullish Harmonic): Choose color for bullish patterns
- Custom Color Of Text: Set the label text color
Conclusion
The Leonardo Harmonic Pattern Indicator is designed to identify potential price reversal zones using a specific Fibonacci structure.
Although it shares a structural resemblance with the Bat Pattern, its Fibonacci ratios differ considerably. This MT4 harmonic tool analyzes price behavior based on the XA, AB, BC, CD, and AD wave relationships to offer traders enhanced accuracy in spotting market turning points.