Pivot Points On Custom Timeframe Indicator
- Indicatori
- Denis Kislicyn
- Versione: 1.0
Overview?
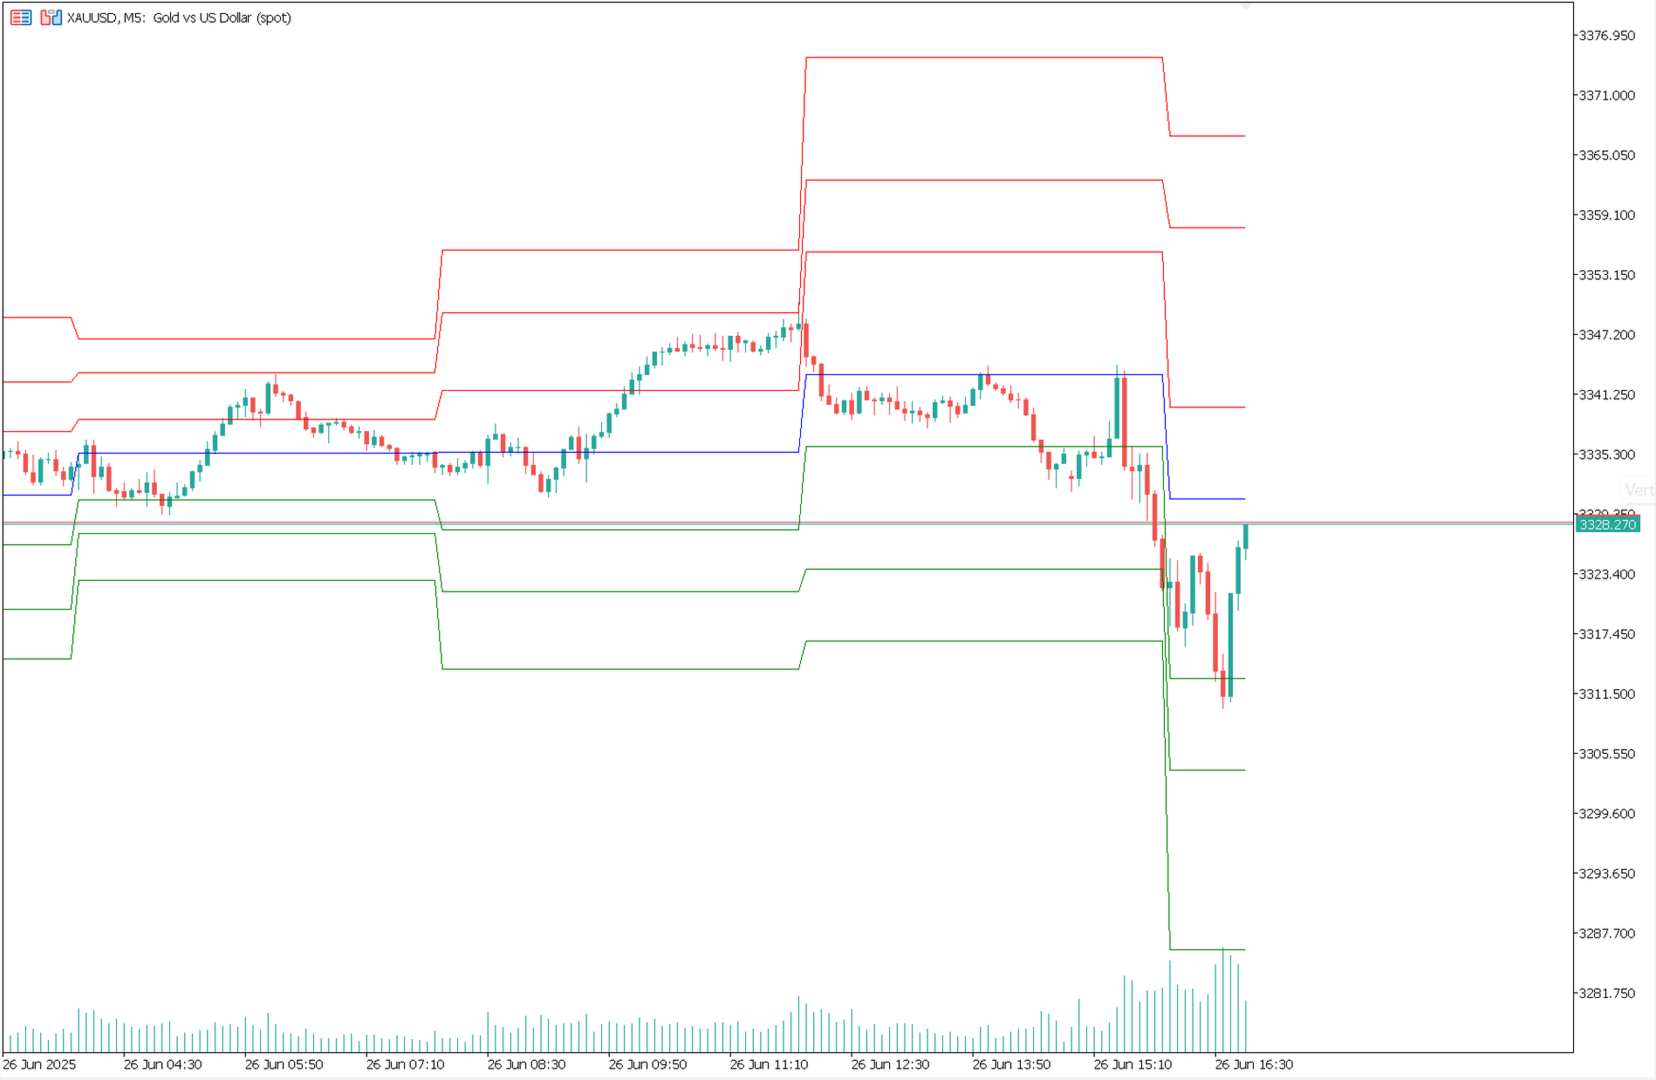
The **Pivot Points On Custom Timeframe** indicator for MetaTrader 5 calculates and displays traditional pivot levels (P, S1–S3, R1–R3) based on a higher timeframe of your choice, regardless of the current chart's timeframe. It is designed to help traders identify potential support and resistance zones using classic pivot formulas, calculated from user-defined periods such as D1, W1, H4, etc.
This indicator can optionally show price labels and trigger alerts when price crosses the pivot levels.
What's new?
1.00: First version
Key Features
- Calculates traditional Pivot Points, Support (S1–S3), and Resistance (R1–R3) levels.
- Lets you select the timeframe used for pivot calculation (independent from chart's TF).
- Displays pivot lines directly on the main chart.
- Optional: Displays price labels for each level.
- Optional: Sends alerts when price crosses a level.
- Clean and optimized for performance.
Parameters
Usage Tips
- Recommended to set the `Pivot Period` to a higher timeframe than your current chart (e.g., D1 on H1 chart).
- Use pivot points as potential **support/resistance** areas, or reference points for breakouts and reversals.
- For best visual clarity, enable `Show Levels` when using fewer bars on screen.
- Use alerts to stay informed about significant price interactions with pivot levels.
- Works well with trend-following or mean-reversion strategies.
---
Note: This indicator uses traditional pivot point formulas based on the previous period’s High, Low, and Close.