• 概要
  • レビュー
  • コメント

Super Trend Dashboard MT4

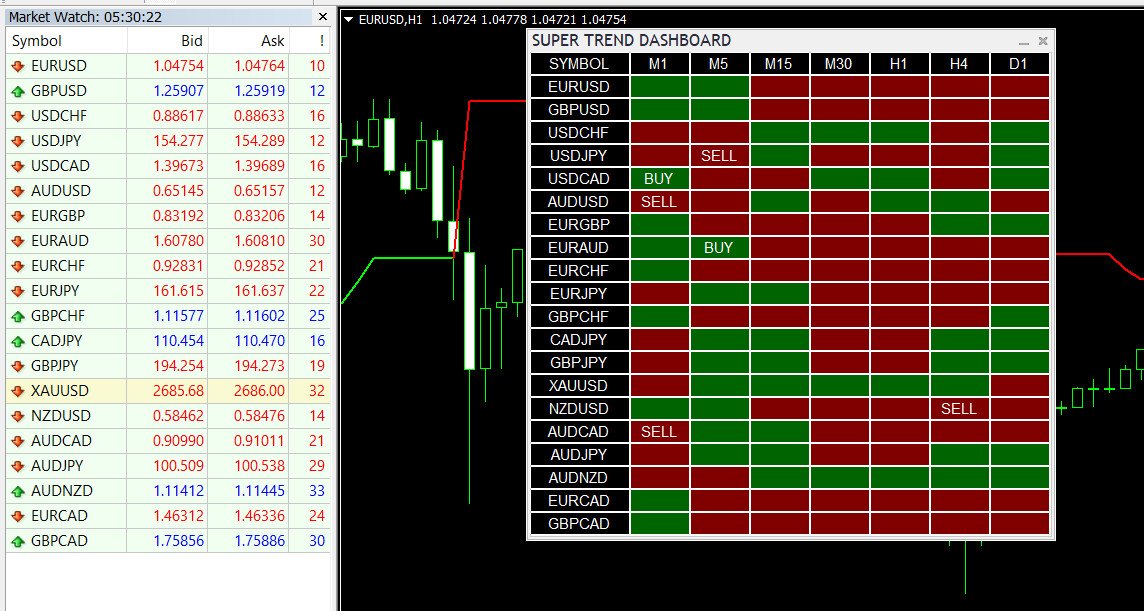
This is the Super Trend Dashboard MT4.

This dashboard will scan multiple timeframes in MT4 platform, from M1 chart to D1 chart.

It will send the buy/sell signals by alert on the platform or sending notification to your phone or message you via a email.

The buy signal is generated when the super trend line flip from SELL to BUY.

The sell signal is is generated when the super trend line flip from BUY to SELL.

The up trend color will be displayed depending on the current Super Trend value.


おすすめのプロダクト
In the context of trading,   Malaysia SNR   (Support and Resistance) refers to the technical analysis of   support and resistance levels   in financial markets, particularly for stocks, indices, or other assets traded. There are three type of Malaysia SNR level Classic , GAP and Flipped 1. Classic Support   is the price level at which an asset tends to stop falling and may start to rebound. It acts as a "floor" where demand is strong enough to prevent the price from dropping further. Resistance
The First Dawn indicator uses a unique mechanism to search and plot signals. This keeps searching for signals, making it a great indicator for scaping and identification of changes in direction, swing trading and trend trading. The  First Dawn   helps you get early signals. The backtest gives the true picture of how the indicator works with real/demo accounts. Although this is a tiny indicator it is packed with advantageous settings that will help you whether you desire to: Snap the Peaks and
Mystic Arrow
Svyatoslav Kucher
5 (4)
Mystic Arrow - уникальный авторский индикатор, отображающий сигналы в направлении основной тенденции, и против нее. Благодаря разнообразию настроек и фильтров индикатор можно настроить под свой стиль торговли. Mystic Arrow  подходит для любого таймфрейма, валютной пары. Сигналы индикатора не пропадают ни при каких условиях. Отличительной особенностью является возможность настроить сигналы индикатора отдельно для тенденции и против нее. Имеет в качестве отключаемого фильтра показания ценового кан
DTFX Algo Zones are auto-generated Fibonacci Retracements based on market structure shifts. These retracement levels are intended to be used as support and resistance levels to look for price to bounce off of to confirm direction.   USAGE Figure 1 Due to the retracement levels only being generated from identified market structure shifts, the retracements are confined to only draw from areas considered more important due to the technical Break of Structure (BOS) or Change of Character (CHo
The SuperRSI indicator is an advanced index of internal strength. The indicator shows not the relative strength of the trading instruments being compared, but the internal strength of a single instrument, therefore, it is the “Internal Strength Index”. This is an advanced form of the SuperRSI indicator. It converts the signal so that low-frequency components are delayed much more than high-frequency components. In general, the data of the last bar have more weight than previous data, like an exp
The product has been removed from sale。 Sales suspended, do not download. 2025/1/28 The product has been removed from sale。 Sales suspended, do not download. 2025/1/28 产品已下架  产品已下架 The product has been removed from sale。Sales suspended, do not download. 2025/1/28 The product has been removed from sale。Sales suspended, do not download. 2025/1/28 产品已下架 产品已下架 The product has been removed from sale 产品已下架 The product has been removed from sale 产品已下架  The product has been removed from sale The product
TrendWave Oscillator is an advanced MT4 oscillator that not only identifies the trend direction but also provides visual and audio alerts to enhance trading strategies. Key Features: - Color-coded trend indication:   - Blue : Indicates an uptrend, signaling potential price growth.   - Orange : Indicates a downtrend, suggesting possible price decline.   - Gray : Represents a flat market or lack of clear entry signals. - Graphical signals on the chart :   - Aqua : Highlights an uptrend, emphasi
Over Arrow  - уникальный авторский индикатор, имеющий возможность отображения сигналов в направлении основной тенденции, или против нее. Over Arrow  подходит для любого таймфрейма, валютной пары, но лучше всего использовать его на средних временных периодах, таких как М30, Н1, Н4. Сигналы индикатора не пропадают ни при каких условиях. Отличительной особенностью является наличие фильтра тенденции, при активации которого, сигналы будут появляться только в направлении основного движения. Параметры
FIBO DASHBOARD This dashboard lists down multi currency Fibonacci level  whenever price hit the level. It draws a Fibonacci Retracement based on daily time frame. It draws arrows, sends pop-up alert  and phone notification whenever price crosses Fibonacci levels. This tool is useful for users who trade with Fibonacci. INPUT ON Alert: set to true will pop-up alert whenever arrow appears. ON Push: set to true will send phone notification whenever arrow appears. ON Email:set to true will send email
The indicator monitors the Dinapoli MACD trend in multiple timeframes for the all markets filtered and shows the results on Dashboard. Key Features Indicator can be used for all markets Monitors every timeframe, from 1 Min to Monthly Parameters UseMarketWatch: Set true to copy all symbols available in market watch MarketWatchCount : Set the number of symbols that you want to copy from the market watch list. CustomSymbols: Enter the custom symbols that you want to be available in dashboard. Ti
The indicator determines the state of the market: trend or flat. The state of the market is determined by taking into account volatility. The flat (trading corridor)is displayed in yellow. The green color shows the upward trend. The red color shows the downward trend. The height of the label corresponds to the volatility in the market. The indicator does not redraw . Settings History_Size   - the amount of history for calculation. Period_Candles  - the number of candles to calculate the indicat
Heiken Ashi On One Chart Mode MT4 The indicator is displayed only on one of the chart modes: Bars, Candles, Line. The default is Bars. When switching the chart mode, the indicator is displayed or disappears depending on the chart mode. Input parameters: iChartMode: on what chart mode should the indicator be displayed mBars mCandles mLine Colors: LightSeaGreen: bull candle Tomato: bear candle
Stronger Trend is an indicator that generates trend signal. It generates trend signal with its own algorithm. These arrows give buying and selling signals. The indicator certainly does not repaint. Can be used in all pairs. Sends a signal to the user with the alert feature. Trade rules Enter the signal when the buy and sell signal arrives. Processing should only be initiated when signal warnings are received. It is absolutely necessary to close the operation when an opposite signal is received.
To get access to MT5 version please click   here . This is the exact conversion from TradingView: "Smoothed Heiken Ashi Candles v1" by " jackvmk ". The screenshot shows similar results from tradingview and Metatrader when tested on ICMarkets on both platforms. This is a light-load processing and non-repaint indicator. All input options are available. Buffers are available for processing in EAs. You can message in private chat for further changes you need. This is not a multi time frame version.
Super MA Trend indicator is an indicator designed to find trends. It uses a moving average, a set of candle combinations and High/Low levels to find trends. This indicator is a complete trading system. You can trade with this indicator as you like. Features and Recommendations You can use this indicator on all pairs except for the volatile pairs. It is recommended to use it on M15 and over graphics. The most important element in this indicator are alerts. Do not open orders unless you receive a
Crypto_Forex インジケーター「トレンド エントリー ヒストグラム」MT4 用、リペイントなし。 - トレンド エントリー ヒストグラム インジケーターは、Entry_bar が表示されたら、トレンド方向へのエントリー シグナルの検索に使用できます。 - このインジケーターには独自の機能があり、計算に価格とボリュームの両方を使用します。 - トレンド エントリー ヒストグラムは 2 色で表示できます。弱気トレンドの場合は赤、強気トレンドの場合は青です。 - 安定したトレンド (同じ色のヒストグラム バーが最低 10 本連続) が表示されたら、Entry_bar を待ちます。 - エントリー シグナルは、ヒストグラムで反対色の 1 列と、最初のトレンド色の次の列です (画像を参照)。 - ショート ターゲットを使用します - 現在のトレンドに応じて、チャート上で最も近い高値/安値。 - インジケーターにはモバイルおよび PC アラートが組み込まれています。 インジケーターの使用方法: - 買いシグナルの場合: 継続的な強気トレンド (青いヒストグラム バー) + ヒストグ
ZhiBi Fast Scalpは、優れた高速スキャルピングインデックスシステムで、トレンドに従ってシグナルが変動し、BuyシグナルとSellシグナルが頻繁に表示されます。 すべての市場の種類と期間に適しています。 上向きの矢印は買い注文を出すために現れ、下向きの矢印は売り注文を出すために現れる。 パラメータ設定の説明 [Signal_line_period]:小周期信号線の平均周期。 [Trend_line_period]:大周期トレンドラインの平均期間。 [Alert_No_Off]:ポップアップメッセージを開くか閉じる; true = on、false = off; [SendMail_No_Off]:Eメールのオンまたはオフ、true =オン、false =オフ。 [SendNotification_No_Off]:メッセージは携帯端末にオンまたはオフにプッシュされる。 true =オン、false =オフ。 より有用なインディケータURL: https://www.mql5.com/en/users/zhengqiuyang/seller
Boba Binary
Anthonius Soruh
5 (1)
Result look on  https://t.me/BonosuProBinary Pair : All Forex Pairs Time Frame : M1 Expaired : 1-2 Minutes Trade Time Once Time a Day Backtester, Alert Avaliable Average Signals Generate 5 - 20 Signals All Pair A Day Broker Time Zone GMT+3 Default Setting [Example Broker GMT+3 : Alpari, FBS, XM] Support Broker : Deriv, IQOption, Alpari, Binomo, Olymtrade, Qoutex, GCoption, etc Support Auto Trading : MT2 Trading, Binary Bot, Intrade Bot, Binomo Bot, Olymptrad Bot, MX2 trading, Price Pro, etc Ind
Cota Binary
Anthonius Soruh
5 (2)
Result look on  https://t.me/BonosuProBinary Pair : All Forex Pairs Time Frame : M1 Expaired : 1-2 Minutes Trade Time Once Time a Day Backtester, Alert Avaliable Average Signals Generate 5 - 20 Signals All Pair A Day Broker Time Zone GMT+3 Default Setting [Example Broker GMT+3 : Alpari, FBS, XM] Support Broker : Deriv, IQOption, Alpari, Binomo, Olymtrade, Qoutex, GCoption, etc Support Auto Trading : MT2 Trading, Binary Bot, Intrade Bot, Binomo Bot, Olymptrad Bot, MX2 trading, Price Pro, etc Ind
Asesor Experto "MR BEAST MIN MAX Price Extremes Master": Potencia tu Trading con Precisión en Mínimos y Máximos El asesor experto "Price Extremes Master" redefine la toma de decisiones en el trading al basarse en los precios mínimos y máximos del mercado. Este innovador asesor utiliza algoritmos avanzados para identificar oportunidades estratégicas en los puntos extremos de precios, permitiendo a los traders capitalizar las fluctuaciones del mercado de manera eficaz. Características Destacadas:
The Your Chance indicator studies price action as a collection of price and time vectors, and uses the average vector to determine the direction and strength of the market. It also estimates the market trend based on rough measurements of price movement. This indicator is confirming and can be especially useful for traders looking for price movements. This indicator highlights the direction and strength of the market and can be used to trade price fluctuations.
The super oscillator trading system is a trend finding tool. This system consists of a few indicators and a few algorithms. The aim of this indicator is to direct the investor to find healthy trends. Trade Rules This indicator has two channel lines. These channels are red lines below zero and above zero. There is a line in two places to process. These are blue lines. There is one trend line, the yellow line. Up trend rules Rule 1 - the yellow trend line should close below the red line below the
Nice Stable Arrow   indicator is designed for signal trading. This indicator generates trend signals. It uses many algorithms and indicators to generate this signal. It tries to generate a signal from the points with the highest trend potential. This indicator is a complete trading product. This indicator does not need any additional indicators. The indicator certainly does not repaint. The point at which the signal is given does not change. Signals are sent at the beginning of new candles.
Hello Alright. This indicator works on MT4 and is very easy to use. When you receive a signal from it, you wait for that candle with the signal to close and you enter your trade at the beginning of the next new candle. A red arrow means sell and a green arrow means buy. All arrows comes with a long dotted like for easy identification of trade signal. Are you okay with that?   100% non repaint Work All Major currency  Pair,  1 minute time frame 1 minute expire, 5 minute timeframe 5 minute expire
Entry Signal Arrows   indicator is designed for signal trading. This indicator generates trend signals.  It uses many algorithms and indicators to generate this signal. It tries to generate a signal from the points with the highest trend potential. This indicator is a complete trading product. This indicator does not need any additional indicators.  The indicator certainly does not repaint. The point at which the signal is given does not change.  Thanks to the alert features you can get the sign
To get access to MT5 version please click here . You can also check the other popular version of this indicator   here . This is the exact conversion from TradingView:"HIGH AND LOW Optimized Trend TrackerHL OTT" by "kivancozbilgic" The screenshot shows similar results from tradingview and Metatrader when tested on ICMarkets on both platforms. This is a light-load processing indicator. It is a non-repaint indicator. Colored Candle and Highlighting options are not available. Buffers are available
Working with the Smart Analiz indicator is very simple - you just react to the arrows that the indicator reflects, that is, the arrow is a command for action. The indicator signals are accurate enough and you can trade using this information! The indicator builds a very high-quality channel in which it generates entry signals! Which is the ideal strategy for a trader as the trader is always hesitant when choosing a strategy to work with. That is, this indicator will allow you to solve the dilemm
Adjustable Consecutive Fractals  looks for 2 or more fractals in one direction and sends out a on screen alert, sound alert and push notification, for strong reversal points . Adjustable Consecutive Fractals, shows the fractals on chart along with a color changing text for buy and sell signals when one or more fractals appear on one side of price. Adjustable Consecutive Fractals is based Bill Williams Fractals . The standard Bill Williams fractals are set at a non adjustable 5 bars, BUT withe th
PLEASE NOTE:   You can  customize the settings of all 3 EMA as per your requirement. The accuracy will change as per your settings. 100% Non repaint Pre-alert (get ready) signals Non-delay indications 24/7 signals 100% No lag No recalculating Lifetime license This is a EMA crossover indicator and its 100% non repaint indicator. The EMA_1 and the EMA_2 is based on which signal is generated. EMA_3 is a Higher EMA value which will remain below or above the candle (market) to identify the trend. Me
Trend based indicator Identify trends with this indicator A simple-to-use trend indicator No complicated settings Attributes: Can be used in all symbols Can be used in all time frames Relatively high signals No complicated settings Specific to the trend Lifetime support Settings: Alarm Show Alert: By activating these settings, after receiving the signal, you will receive an alarm in Metatrader Alarm Show Notification: By activating these settings, after receiving the signal, you will receive a
このプロダクトを購入した人は以下も購入しています
Gann Made Easy は、ミスター・ギャンの理論を使用した取引の最良の原則に基づいた、プロフェッショナルで使いやすい外国為替取引システムです。 W・D・ガン。このインジケーターは、ストップロスとテイクプロフィットレベルを含む正確な買いと売りのシグナルを提供します。 PUSH通知を利用して外出先でも取引可能です。 購入後はご連絡ください!私の取引のヒントと素晴らしいボーナスインジケーターを無料で共有します! おそらく、ギャンの取引手法についてはすでに何度も聞いたことがあるでしょう。通常、ギャンの理論は初心者のトレーダーだけでなく、すでにある程度の取引経験がある人にとっても非常に複雑なものです。なぜなら、ギャンの取引手法は理論的にはそれほど簡単に適用できるものではないからです。私はその知識を磨き、最良の原則を私の外国為替インジケーターに組み込むために数年を費やしました。 このインジケーターは非常に簡単に適用できます。必要なのは、それをチャートに添付し、簡単な取引推奨事項に従うだけです。このインジケーターは常に市場分析の仕事を行い、取引の機会を探します。適切なエントリーポイントを検出
M1 SNIPER は使いやすいトレーディングインジケーターシステムです。M1時間足向けに設計された矢印インジケーターです。M1時間足でのスキャルピングのためのスタンドアロンシステムとして、また既存のトレーディングシステムの一部としても使用できます。このトレーディングシステムはM1時間足での取引に特化して設計されていますが、他の時間足でも使用できます。元々、この手法はXAUUSDとBTCUSDの取引用に設計しましたが、他の市場においても役立つと考えています。 インジケーターのシグナルは、トレンドの方向と逆方向に取引できます。インジケーターのシグナルを利用して両方向に取引するのに役立つ特別な取引テクニックをご紹介します。この手法は、特別な動的なサポートとレジスタンスの価格帯を利用することに基づいています。 ご購入後、M1 SNIPER矢印インジケーターをすぐにダウンロードできます。さらに、M1 SNIPERツールのすべてのユーザーに、以下のスクリーンショットに表示されているApollo Dynamic SRインジケーターを無料で提供しています。この2つのインジケーターを組み合わせることで
現在20%OFF! 初心者やエキスパートトレーダーに最適なソリューションです。 このインディケータは、エキゾチックペア・コモディティ・インデックス・先物など、あらゆるシンボルの通貨の強さを表示することに特化したインディケータです。金、銀、原油、DAX、US30、MXN、TRY、CNHなどの通貨の強さを表示するために、9行目にどのシンボルでも追加することができます。独自の機能を多数搭載し、新しい計算式を採用したため、ユニークで高品質、かつ手頃な価格のトレーディングツールとなっています。新しいトレンドやスキャルピングチャンスのトリガーポイントを正確に把握することができるため、あなたのトレードがどのように改善されるか想像してみてください。 ユーザーマニュアル:ここをクリック   https://www.mql5.com/en/blogs/post/708876 すべての時間枠に対応します。あなたはすぐにトレンドを見ることができるようになります! 新しいアルゴリズムに基づいて設計されているため、潜在的な取引の特定と確認がより簡単になります。これは、8つの主要通貨と1つのシンボルの強弱
Dynamic Forex28 Navigator - 次世代の Forex 取引ツール。 現在 49% オフ。 Dynamic Forex28 Navigator は、長年人気のインジケーターを進化させたもので、3 つの機能を 1 つにまとめています。 Advanced Currency Strength28 インジケーター (レビュー 695 件)  + Advanced Currency IMPULSE with ALERT (レビュー 520 件) + CS28 コンボ シグナル (ボーナス)。 インジケーターの詳細 https://www.mql5.com/en/blogs/post/758844 次世代の Strength インジケーターが提供するもの  オリジナルで気に入っていたすべての機能が、新機能と精度の向上によって強化されました。 主な機能: 独自の通貨強度計算式。 すべての時間枠でスムーズかつ正確な強度ライン。 トレンドの特定と正確なエントリーに最適です。 ダイナミックマーケットフィボナッチレベル (マーケットフィボナッチ)。 このインジケーターに固有
Advanced Supply Demand
Bernhard Schweigert
4.91 (294)
現在33%オフ 初心者にもエキスパートトレーダーにも最適なソリューション このインジケーターは独自の機能と新しい公式を多数内蔵しており、ユニークで高品質かつ手頃な取引ツールです。このアップデートでは、2つの時間枠ゾーンを表示できるようになります。より長いTFだけでなく、チャートTFとより長いTF(ネストゾーンを表示)の両方を表示できます。すべてのSupply Demandトレーダーの皆さんのお気に召すはずです。:) 重要情報の公開 Advanced Supply Demandの可能性を最大化するには、 https://www.mql5.com/ja/blogs/post/720245 にアクセスしてください。   エントリーまたはターゲットの正確なトリガーポイントを正確に特定できれば取引がどのように改善されるか想像してみてください。新しい基盤となるアルゴリズムに基づいて構築されているため、買い手と売り手の間の潜在的な不均衡をさらに簡単に特定できます。これは、最も強い需要と供給のゾーンと、過去のパフォーマンス(古いゾーンを表示)がグラフィカルに表現されるためです。これらの機能は、最適な
An exclusive indicator that utilizes an innovative algorithm to swiftly and accurately determine the market trend. The indicator automatically calculates opening, closing, and profit levels, providing detailed trading statistics. With these features, you can choose the most appropriate trading instrument for the current market conditions. Additionally, you can easily integrate your own arrow indicators into Scalper Inside Pro to quickly evaluate their statistics and profitability. Scalper Inside
反転ゾーン / ピークボリューム / 主要プレーヤーのアクティブゾーン =       TS TPSプロシステム 説明書 RUS       /       説明書     英語     /       Version MT5 このインジケーターを購入したすべての購入者は、さらに以下を無料で受け取ります: RFI SIGNALS サービスからの取引シグナルへの 6 か月間のアクセス - TPSproSYSTEM アルゴリズムに従った既製のエントリ ポイント。 定期的に更新されるトレーニング資料 - 戦略に没頭し、プロフェッショナル レベルを高めます。 平日は 24 時間 365 日サポート、非公開のトレーダー チャットへのアクセス - コミュニケーション、サポート、市場状況の分析。 著者の設定ファイル - 余分な労力をかけずに最大の結果を達成するための自動インジケーター設定。 主な機能: 売り手と買い手のアクティブなゾーンを表示します。 このインジケーターは、購入と販売の正しい最初のインパルス レベル/ゾーンをすべて表示します。これらのレベル/ゾーンがアクティブになると、エントリ
素晴らしいバックテスト 、驚異的な数字を伴う ライブ口座実績の証明 、そして あらゆる場所での統計結果 を備えたトレーディングインジケーターを購入したにもかかわらず、使用後に 口座を破綻させてしまった 経験は何度ありますか? シグナルを単独で信用すべきではありません。なぜそのシグナルが最初に現れたのかを知る必要があります。そして、それがRelicusRoad Proが最も得意とすることです! ユーザーマニュアル + 戦略 + トレーニングビデオ + VIPアクセス付きプライベートグループ + モバイル版利用可能 市場を見る新しい方法 RelicusRoadは、FX、先物、暗号通貨、株式、指数向けの「 世界で最も強力で最高の取引インジケーター 」であり、トレーダーが 口座を成長させる ために必要なすべての情報とツールを提供します。「 テクニカル分析 」と「 取引計画 」を提供し、「 初心者 」から「 上級者 」まで、「 すべてのトレーダーの成功 」を支援します。 これは、将来の市場を「 予測 」するのに十分な情報を提供する「 主要な取引インジケーター 」です。意味をなさない複数の異な
VERSION MT5        —        ИНСТРУКЦИЯ RUS           —        INSTRUCTIONS  ENG 主な機能: レンダリングなしで正確な入力信号! シグナルが表示された場合、それは関連性を維持します。これは、シグナルを提供してからそれを変更する可能性があり、入金時の資金の損失につながる可能性があるリドローインジケーターとの重要な違いです。より高い確率と精度で市場に参入できるようになりました。矢印が表示された後、ターゲットに達する (利益確定) か反転シグナルが表示されるまで、ローソク足を色付けする機能もあります。 STOP LOSS / TAKE PROFITゾーンの表示 エントリーポイントを検索する際の視覚的な明瞭さを改善するために、市場に参入するための最適なポイントが検索される買い/売りゾーンを最初に表示するモジュールが作成されました。ストップロスレベルを操作するための追加のインテリジェントロジックは、時間の経過とともにそのサイズを縮小するのに役立ち、その結果、取引を開始するとき(move sl)の初期リスクを軽減しま
PUMPING STATION – あなた専用の「オールインワン」戦略 PUMPING STATIONは、あなたのトレードをより楽しく、そして効果的に変えてくれる革新的なFXインジケーターです。ただの補助ツールではなく、強力なアルゴリズムを備えた本格的なトレーディングシステムで、より安定したトレードのスタートをサポートします。 この商品をご購入いただくと、以下の特典を無料でお付けします: 専用セットファイル:自動設定による最大パフォーマンスを実現。 ステップバイステップのビデオマニュアル:PUMPING STATION戦略の使い方を学べます。 Pumping Utility:PUMPING STATION専用の半自動トレードボットで、より快適かつシンプルな運用を可能にします。 ※ご購入後すぐにご連絡ください。追加リソースへのアクセスを提供いたします。 PUMPING STATIONの仕組み: トレンド管理:市場のトレンド方向を即座に判断。トレンドはあなたの最高の味方です。 エントリーサイン:チャート上の矢印で、取引のタイミングと方向を明確に示します。 明確な目標設定:インジケーターが自
Volatility Trend System - a trading system that gives signals for entries. The volatility system gives linear and point signals in the direction of the trend, as well as signals to exit it, without redrawing and delays. The trend indicator monitors the direction of the medium-term trend, shows the direction and its change. The signal indicator is based on changes in volatility and shows market entries. The indicator is equipped with several types of alerts. Can be applied to various trading ins
現在20%OFF! このダッシュボードは、複数のシンボルと最大9つのタイムフレームで動作するソフトウェアの非常に強力な部分です。 このソフトは、弊社のメインインジケーター(ベストレビュー:Advanced Supply Demand)をベースにしています。    Advanced Supply Demand ダッシュボードは、素晴らしい概要を提供します。それは示しています。  ゾーン強度評価を含むフィルタリングされた需給値。 ゾーン内/ゾーンへのPips距離。 ネストされたゾーンがハイライトされます。 選択されたシンボルの4種類のアラートを全ての(9)時間枠で提供します。 それはあなたの個人的なニーズに合わせて高度に設定可能です。 あなたの利益! すべてのトレーダーにとって最も重要な質問です。 市場に参入するのに最適なレベルはどこか? 成功のチャンスとリスク/リターンを得るために、強力な供給/需要ゾーン内またはその近くで取引を開始します。 損切りの最適な位置はどこですか? 最も安全なのは、強力な供給/需要ゾーンの下/上にストップを置くことです。 最適な利益
Enigmera
Ivan Stefanov
5 (7)
ENIGMERA: 市場の中心 重要:MQL5.comのデモはStrategy Testerで実行されており、Enigmeraの機能を完全には反映していない場合があります。詳細については、説明、スクリーンショット、ビデオをご確認ください。質問があれば、遠慮なくメッセージを送ってください! インジケーターのコードは完全に書き直されました。バージョン3.0は新機能を追加し、インジケーターの開始以来蓄積されたバグを修正しました。 紹介 このインジケーターとトレーディングシステムは、金融市場への注目すべきアプローチです。ENIGMERAはフラクタルサイクルを使用して、サポートとレジスタンスのレベルを正確に計算します。真の蓄積フェーズを示し、方向と目標を提供します。トレンドでも修正でも機能するシステムです。 動作方法 インジケーターのほとんどの機能は、チャートの左側にあるボタンで制御され、市場の状況に迅速に対応できるようになっています。 ボタン ON/OFF – インジケーター全体を表示または非表示にします。 Channel – サポートチャネルを有効にし、許容範囲の偏差を示します。 Dev
PRO Renko Systemは、特別にRENKOチャートを取引するために設計された高精度の取引システムです。 これは、様々な取引商品に適用することができる普遍的なシステムです。 システムは効果的に正確な逆転信号へのアクセスを与えるいわゆる市場の騒音を中和する。 表示器は非常に使いやすく、信号の生成に責任がある1つの変数だけがあります。 あなたは簡単にお好みの任意の取引ツールとレンコバーのサイズにツールを適応させることができます。 私はいつもあなたが私のソフトウェアで収益性の高い取引を支援するために余分なサポートを提供する準備ができています! 私はあなたに幸せで収益性の高い取引をしたいです! ご購入後にご連絡ください! 私はあなたに私のレンコチャートジェネレータを送信します。 私はまた、私の個人的な推奨事項やシステムの他のモジュールを無料で共有します!
Pairs Trading Dashboard - Spearman Correlation and Stationary Z-Score  is a custom indicator designed for the MetaTrader 4 (MT4) platform, developed to assist traders in analyzing and monitoring currency pairs for pairs trading strategies. It utilizes Spearman’s rank correlation coefficient and Z-Score calculations to identify trading signals across multiple timeframes and currency pairs. The indicator integrates various technical filters and stationarity tests to refine signal generation and di
市場の2つの基本原則に基づく日中戦略。 このアルゴリズムは、追加のフィルターを使用したボリュームと価格の波の分析に基づいています。インディケータのインテリジェントアルゴリズムは、2つの市場要因が1つに結合した場合にのみシグナルを出します。インディケータは、より高い時間枠のデータを使用して、M1チャート上の特定の範囲の波を計算します。そして波を確認するために、インジケーターはボリュームによる分析を使用します。 このインディケータはレディトレーディングシステムです。トレーダーが必要とするのは、信号に従うことだけです。また、インジケーターはあなた自身の取引システムの基礎になることができます。取引はミニッツチャートでのみ行われます。 インジケーターがMTFの原則を使用しているという事実にもかかわらず、インジケーターのアルゴリズムは可能な限り安定しています。 購入後、必ず私に書いてください!私の取引設定と推奨事項をあなたと共有します!
このダッシュボードは、選択されたシンボルの最新の利用可能なハーモニックパターンを表示するので、時間を節約し、より効率的に / MT5バージョン 。 無料インジケーター: Basic Harmonic Pattern インジケーター列 Symbol : 選択したシンボルが表示されます。 Trend : 強気または弱気 Pattern : パターンの種類(ガートレー、バタフライ、バット、カニ、サメ、サイファー、ABCD) Entry : エントリー価格 SL: ストップロス価格 TP1: 1回目の利食い価格 TP2: 2回目の利食い価格 TP3: 3回目の利食い価格 Current price : 現在値 Age (in bars):  最後に描画されたパターンの年齢 主な入力項目 Symbols: "28 Major Currency Pairs "または "Selected Symbols "から選択。 Selected Symbols: カンマで区切られた監視したいシンボル("EURUSD,GBPUSD,XAUUSD")。ブローカーがペアに接尾辞または接頭辞を付けている場合
CYCLEMAESTROとの取引 シグナルはシンプルで即時です。領域の背景が緑または赤に変わると、取引シグナルがアクティブであることを意味します。緑 = 買い、赤 = 売り。トレーダーはトレードを開き、次の指示に従うことができます。  注意:CYCLEMAESTRO は当ウェブサイトでのみ配布されており、他の配布元はありません。 DEMO バージョンは参照用であり、サポートされていません。最終バージョンはサポートされており、完璧に動作します。 CYCLEMAESTRO は、TRADING、BUY、SELL、STOP LOSS、ADDING シグナルの提供に役立つ、最初で唯一のサイクリック分析インジケーターです。 Serghei Istrati のロジックに基づいて作成され、Stefano Frisetti によってプログラムされました。 CYCLEMAESTRO は他のインジケーターとは異なり、サイクルで機能するものだけを解釈し、明確な取引シグナルを備えた解釈不可能なインジケーターを作成することが課題でした。これは、市場にあるさまざまなインジケーターとは異なり、すべてがユー
このインディケータは、当社の2つの製品 Advanced Currency IMPULSE with ALERT  +   Currency Strength Exotics . のスーパーコンビネーションです。 このインジケーターは全ての時間枠で作動し、8つの主要通貨と1つのシンボルの強弱のインパルスをグラフで表示します。 このインジケータは、金、エキゾチックペア、商品、インデックス、先物など、あらゆるシンボルの通貨強度の加速度を表示することに特化されています。金、銀、原油、DAX、US30、MXN、TRY、CNHなどの通貨強度の加速度(インパルスまたは速度)を表示するために、任意のシンボルを9行目に追加できる、この種の最初のものです。 新しいアルゴリズムに基づいて構築され、潜在的な取引の特定と確認がさらに容易になりました。これは、通貨の強さや弱さが加速しているかどうかをグラフィカルに表示し、その加速の速度を測定するためです。加速すると物事は明らかに速く進みますが、これはFX市場でも同じです。つまり、反対方向に加速している通貨をペアリングすれば、潜在的に利益を生む取引を特定
収益性の高い取引機会を簡単に特定するのに役立つ強力な外国為替取引インジケーターをお探しですか?ビースト スーパー シグナル以外に探す必要はありません。 この使いやすいトレンドベースのインジケーターは、市場の状況を継続的に監視し、新しいトレンドを検索したり、既存のトレンドに飛びついたりします。ビースト スーパー シグナルは、すべての内部戦略が一致し、互いに 100% 合流したときに売買シグナルを発するため、追加の確認は不要です。シグナル矢印アラートを受け取ったら、単に売買します。 購入後、プライベート VIP グループに追加されるようにメッセージを送ってください! (完全な製品購入のみ)。 購入後、最新の最適化されたセット ファイルについてメッセージを送ってください。 MT5バージョンは こちらから入手できます。 Beast Super Signal EA は こちらから 入手できます。 コメント セクションをチェックして、最新の結果を確認してください。 ビースト スーパー シグナルは、1:1、1:2、または 1:3 のリスクと報酬の比率に基づいて、エントリー価格、ストッ
Lux Trend
Mohamed Hassan
5 (5)
After purchase, please contact me to get your trading tips + more information for a great bonus!   Lux Trend is a professional strategy based on using Higher Highs and Lower Highs to identify and draw Trendline Breakouts! Lux Trend  utilizes two Moving Averages to confirm the overall trend direction before scanning the market for high-quality breakout opportunities, ensuring more accurate and reliable trade signals. This is a proven trading system used by real traders worldwide, demonstrating
通貨強さウィザードは、取引を成功させるためのオールインワン ソリューションを提供する非常に強力な指標です。このインジケーターは、複数の時間枠のすべての通貨のデータを使用して、このまたはその外国為替ペアのパワーを計算します。このデータは、使いやすい通貨インデックスと通貨パワーラインの形式で表され、特定の通貨のパワーを確認するために使用できます。 必要なのは、取引したいチャートにインジケーターを接続することだけです。インジケーターは、取引する通貨の実際の強さを示します。このインジケーターは、トレンドに合わせて取引するときに有利に利用できる売買高の圧力の極値も示します。このインジケーターには、フィボナッチに基づく可能なターゲットも表示されます。 このインジケーターは、PUSH 通知を含むあらゆるタイプのアラートを提供します。 購入後ご連絡下さい。私の取引のヒントをあなたと共有し、素晴らしいボーナスインジケーターを無料で提供します! 幸せで有益な取引をお祈りします。
現在26%OFF! このインディケータは、当社のメインインディケータ( Advanced Currency Strength 28   &  Advanced Currency IMPULSE with ALERT )の両方のスーパーコンビネーションです。28の外国為替ペアのTICK-UNITSとアラートシグナルの通貨強度の値を示しています。11種類のTick-Unitが使用可能です。1、2、3、4、5、6、10、12、15、20、30秒の11種類です。サブウィンドウのTick-Unitバーは、秒単位のタイマーに1ティック以上含まれる場合に表示され、左側にシフトされます。 たった1枚のチャートで、28のFXペアをスキャルピングできます。スキャルピングのチャンスとなるトリガーポイントを正確に把握することで、スキャルピングが上達することを想像してみてください。 1分足よりも短い期間で動作する市場初の通貨強度インジケーターです! このインジケータは、素早いインとアウトを行い、小さなピップを切り取ることを望む高速スキャルパーのためのものです。 ユーザーマニュアル: ここをクリック h
Chart Patterns All in One」をデモモードでお試しいただき、ボーナスを獲得してください。デモモードで試した後、メッセージを送っていただければボーナスをお渡しします。 購入後にコメントを残すと、高品質なインジケーター8つをボーナスとして受け取れます。 Chart Patterns All-in-One インジケーターは、トレーダーがテクニカル分析で一般的に使用されるさまざまなチャートパターンを視覚化するのに役立ちます。このインジケーターは市場の潜在的な動きを特定するのに役立ちますが、収益性を保証するものではありません。購入前にデモモードでテストすることをお勧めします。 現在のオファー : 「Chart Patterns All in One」インジケーターが50%割引。 含まれるパターン : 1-2-3 パターン : 3つの主要なポイント(高値または安値)を使用して市場の反転を検出します。 買い : 2つの連続する安値の後に、前の高値よりも低い高値が出現。 売り : 2つの連続する高値の後に、前の安値よりも高い安値が出現。 可視化 : 特定されたポイントを線と矢印
現在26%オフ 初心者やエキスパートトレーダーに最適なソリューション! このインジケーターは、独自の機能と新しい計算式を取り入れた、ユニークで高品質、かつ手頃な価格のトレーディングツールです。たった1枚のチャートで28の為替ペアの通貨強度を読み取ることができます。新しいトレンドやスキャルピングチャンスの引き金となるポイントを正確に特定することができるので、あなたのトレードがどのように改善されるか想像してみてください。 ユーザーマニュアルはこちら  https://www.mql5.com/en/blogs/post/697384 これが最初の1本、オリジナルだ! 価値のないクローンを買わないでください。 特別な サブウィンドウの矢印で強い通貨の勢いを表示 GAPがあなたのトレードを導く! 基準通貨や気配値が売られすぎ・買われすぎのゾーン(外相フィボナッチレベル)にあるとき、個別チャートのメインウィンドウに警告表示。 通貨がレンジの外側から反落した場合、プルバック/リバーサルのアラート。 クロスパターンの特別なアラート 複数の時間枠を選択可能で、トレンドを素早く確認できます
Trading System Double Trend - an independent trading system consisting of several indicators. Determines the direction of the general trend and gives signals in the direction of price movement. Can be used for scalping, intraday or weekly trading. Features Works on any time frames and trading instruments (forex, cryptocurrencies, metals, stocks, indices.) Simple visual reading of information that does not load the chart The indicator does not repaint and does not complete signals Works only wh
MetaBands M4
Vahidreza Heidar Gholami
4 (4)
MetaBandsは、強力でユニークなアルゴリズムを使用してチャンネルを描画し、トレンドを検出して、トレーダーに取引の入出ポイントを提供することができます。チャンネル指標に加えて、強力なトレンド指標でもあります。入力パラメータを使用して新しいチャンネルを作成するために、異なるタイプのチャンネルを統合することができます。MetaBandsは、市場のイベントについてユーザーに通知するために、すべてのタイプのアラートを使用します。 特徴 ほとんどのチャンネルアルゴリズムをサポート 強力なトレンド検出アルゴリズム 異なるタイプのチャンネルを統合する能力 マルチタイムフレームおよびマルチカレンシー(シグナルマトリックス) すべてのタイプのアラート機能(サウンド、画面フラッシャー、プッシュ通知、メール、ポップアップ、矢印) 再描画しない トレンド検出 MetaBandsは、チャネル内を振動する青いラインを使用してトレンドを検出します。ラインがチャネルの上部バンドに達すると、下降トレンドの開始を示し、下部バンドに達すると上昇トレンドの開始を示します。青いラインが中心ラインに近づくと、市場はコンソリ
Noize Absorption Index - is the manual trading system that measures the difference of pressure between bears forces and bulls forces. Green line - is a noize free index that showing curent situation. Zero value of index shows totally choppy/flat market.Values above zero level shows how powerfull bullish wave is and values below zero measures bearish forces.Up arrow appears on bearish market when it's ready to reverse, dn arrow appears on weak bullish market, as a result of reverse expectation. S
FX Power: 通貨の強弱を分析して、より賢い取引を実現 概要 FX Power は主要通貨と金の実際の強弱をあらゆる市場状況で理解するための必須ツールです。強い通貨を買い、弱い通貨を売ることで、 FX Power は取引の意思決定を簡素化し、高い確率の取引機会を見出します。トレンドを追従する場合でも、極端なデルタ値を使用して反転を予測する場合でも、このツールはあなたの取引スタイルに完全に適応します。ただ取引するだけではなく、 FX Power で賢く取引をしましょう。 1. なぜ FX Power がトレーダーにとって非常に有益なのか 通貨と金のリアルタイム強弱分析 • FX Power は主要通貨と金の相対的な強弱を計算し、マーケットダイナミクスに関する明確な洞察を提供します。 • どの資産がリードしているか、または後れを取っているかを監視して、取引するペアを賢く選びましょう。 マルチタイムフレームの包括的なビュー • 短期、中期、長期のタイムフレームで通貨と金の強弱を追跡し、マーケットトレンドに基づいて取引戦略を調整できます。 • スキャルピングからスイングトレード
スイングトレーディング は、トレンドの方向のスイングと可能な反転スイングを検出するように設計された最初のインジケーターです。トレーディングの文献で広く説明されているベースラインスイングトレーディングアプローチを使用します。インディケータは、いくつかの価格と時間のベクトルを調査して、全体的なトレンドの方向を追跡し、市場が売られ過ぎまたは買われ過ぎて修正の準備ができている状況を検出します。 [ インストールガイド | 更新ガイド | トラブルシューティング | よくある質問 | すべての製品 ] むち打ちを起こさずに市場スイングの利益 インジケーターは常にトレンドの方向を表示します 色付きの価格帯は機会のベースラインを表します 色付きのダッシュは、可能な反転スイングを表します この指標は、独自の品質とパフォーマンスを分析します 複数時間枠のダッシュボードを実装します カスタマイズ可能なトレンドおよびスイング期間 電子メール/サウンド/プッシュアラートを実装します インジケータは再描画またはバックペインティングではありません Swing Tradingとは Swing Tradingは
作者のその他のプロダクト
This small trading tool will send all your trading information to your Telegram channel. It is very simple to use. Please see at the below video to know how install it on your MT4 platform. To use this tool, you need following information: * Your Bot token * Your Telegram channel name. Note: this tool will not touch your trading order. It only send your trading information to your telegram channel for all member can know.
Daklak MT4
The Huy Phan
5 (1)
Daklak MT4  is a EA which use the martingale strategy. This EA has been tested for 20 years historical data with good result and acceptable drawdown. Note: 1. The default setting is set for AUDUSD 30M chart. 2. Minimum deposit: $1000 3. Account type: Hedging Account Parameters  Lot Size per 1000=0.01- Mean the starting lot size will be 0.01 per 1000 unit balance. (ex: if the balance is $3000, the first trade lot size will be 0.01)  Start Distance Rate=5.0- Mean the distance rate of the first
WPR Dashboard  uses the value of William's Percent Range indicator. The parameters can be adjusted via the Edit boxes of this dashboard. The monitoring pairs will be selected by adding to the Market Watch (no need to set  prefixes or suffixes) , you can monitor many pairs as you like. This dashboard will check almost popular time frame (M1,M5,M15,M30,H1,H4 and D1). The colors can be customized. We can have a look at many pairs and many time frames without opening the chart. In addition, we can
RSI Dashboard  uses the value of Relative Strength Index indicator. The parameters can be adjusted via the Edit boxes of this dashboard. The monitoring pairs will be selected by adding to the Market Watch (no need to set  prefixes or suffixes) , you can monitor many pairs as you like. This dashboard will check almost popular time frame (M1,M5,M15,M30,H1,H4 and D1). The colors can be customized. We can have a look at many pairs and many time frames without opening the chart. In addition, we can
Serepok MT4 is a trending following EA. This EA uses a custom indicators to detect entry signal. The fixed stop loss and take profit are always set for each trade. This EA has smart money management. Users only need to determine the accepted loss for each trade, EA will calculate the lot size for each trade according to stop loss price. Therefore, this EA is very safe. This EA is very easy to use and can apply for many currency pairs. Recommended time frame is H1. Note: 1. Please do back testi
Aroon crossover Dashboard uses the value of Aroon indicator. The Aroon period can be adjusted via the Edit box of this dashboard. The monitoring pairs will be selected by adding to the Market Watch (no need to set  prefixes or suffixes) , you can monitor many pairs as you like. This dashboard will check almost popular time frame (M1,M5,M15,M30,H1,H4 and D1). The colors can be customized. The Aroon indicator has been included in to this Dashboard, you do not need purchasing it. Crossover signal c
MAs Crossover Dashboard Pro uses the value of Moving Average indicator. The periods of 2 MAs can be adjusted via the Edit boxes of this dashboard. The monitoring pairs will be selected by adding to the Market Watch (no need to set  prefixes or suffixes) , you can monitor many pairs as you like. This dashboard will check almost popular time frame (M1,M5,M15,M30,H1,H4 and D1). The colors can be customized. The parameter of MAs can be set at the input. Crossover signal can be sent to you screen, yo
Stochastic Crossover Dashboard Pro uses the value of Stochastic indicator. The Stochastic's parameters can be adjusted via the Edit boxes of this dashboard. The monitoring pairs will be selected by adding to the Market Watch (no need to set  prefixes or suffixes) , you can monitor many pairs as you like. This dashboard will check almost popular time frame (M1,M5,M15,M30,H1,H4 and D1). The colors can be customized. The parameters of Stochastic can be set at the input. Crossover signal can be sent
Eakao is a trending following EA. This EA uses some custom indicators to detect entry signal. There are 2 trades opened per signal, one trade has fixed take profit, EA will use breakeven and trailing stop for another trade. The fixed stop loss and take profit are always set for each trade. Beside stop loss, this EA uses an exit indicator to exit the trade before stop loss or take profit are triggered. This EA has smart money management. Users only need to determine the accepted loss for each tr
Bollinger Bands Multi Dashboard MT4 uses the value of Bollinger Bands indicator. This dashboard will monitor all symbols in the market watch. We can set up to receive an alert, notification or an email when the buy/sell signal appear on each timeframe. You can check all symbols via only 1 chart. This dashboard will check almost popular time frame (M1,M5,M15,M30,H1,H4 and D1). The colors can be customized. We can have a look at many pairs and many time frames without opening the chart. In additio
This is the MT4 Ichimoku Dashboard. This dashboard will scan multiple timeframes in MT5 platform, from M1 chart to D1 chart. It will send the buy/sell signals by alert on the platform or sending notification to your phone or message you via a email. The buy/sell signal can be set by cross of multiple lines: ex: tenkan-sen line, kijun-sen line, the cloud or you can select the price to cross or above/below the kumo cloud... Please discovery in the input setting, You can find the rule that you are
This is the ADX Dashboard MT5. This dashboard will scan multiple timeframes in MT4 platform, from M1 chart to D1 chart. It will send the buy/sell signals by alert on the platform or sending notification to your phone or message you via a email. The buy signal is the cross over of DI+ and DI- The sell signal is the cross under of DI+ and DI-. The up trend color will be displayed when DI+ is greater than DI- The down trend color will be displayed when DI+ is less than DI- The value of ADX value wi
This is the Heiken Ashi Dashboard MT4. This dashboard will scan multiple timeframes and symbols in MT4 platform, from M1 chart to D1 chart. It will send the buy/sell signals by alert on the platform or sending notification to your phone or message you via a email. The buy signal is generated when the heiken ashi bar changes its color from red to white. The sell signal is   is generated  when the heiken ashi bar changes its color from white to red. The up/down trend color will be displayed depend
This is the Parabolic Dashboard MT4. This dashboard will scan multiple timeframes and symbols in MT5 platform, from M1 chart to D1 chart. It will send the buy/sell signals by alert on the platform or sending notification to your phone or message you via a email. The buy signal is generated when the SAR changes its position from above to below of the candle. The sell signal is   is generated  when   the SAR changes its position from below to above of the candle. The up/down trend color will be di
Daklak MT5
The Huy Phan
5 (1)
Daklak MT5  is a EA which use the martingale strategy. This EA has been tested for 20 years historical data with good result and acceptable drawdown. Note: 1. The default setting is set for AUDUSD 30M chart. 2. Minimum deposit: $1000 3. Account type: Hedging Account Parameters  Lot Size per 1000=0.01- Mean the starting lot size will be 0.01 per 1000 unit balance. (ex: if the balance is $3000, the first trade lot size will be 0.01)  Start Distance Rate=5.0- Mean the distance rate of the first
This indicator is powerful for detecting the trend. The crossing between to line is the entry signal. Buffer 0 is UP line. Buffer 1 is DOWN line. Note: 1. Aroon is great tool for trending detecting. Please try to select the best period for each instrument. Input   AroonPeriod =14- Aroon period   MailAlert =false- Send email when entry signals appeared.   SoundAlert =false- Notify on MT5 platform.
WPR Dashboard  uses the value of William's Percent Range indicator. The parameters can be adjusted via the Edit boxes of this dashboard. The monitoring pairs will be selected by adding to the Market Watch (no need to set  prefixes or suffixes) , you can monitor many pairs as you like. This dashboard will check almost popular time frame (M1,M5,M15,M30,H1,H4 and D1). The colors can be customized. We can have a look at many pairs and many time frames without opening the chart. In addition, we can
RSI Dashboard  uses the value of Relative Strength Index indicator. The parameters can be adjusted via the Edit boxes of this dashboard. The monitoring pairs will be selected by adding to the Market Watch (no need to set  prefixes or suffixes) , you can monitor many pairs as you like. This dashboard will check almost popular time frame (M1,M5,M15,M30,H1,H4 and D1). The colors can be customized. We can have a look at many pairs and many time frames without opening the chart. In addition, we can
Serepok MT5 is a trending following EA. This EA uses a custom indicators to detect entry signal. The fixed stop loss and take profit are always set for each trade. This EA has smart money management. Users only need to determine the accepted loss for each trade, EA will calculate the lot size for each trade according to stop loss price. Therefore, this EA is very safe. This EA is very easy to use and can apply for many currency pairs. Recommended time frame is H1. Note: 1. Please do back testi
Aroon crossover Dashboard uses the value of Aroon indicator. The Aroon period can be adjusted via the Edit box of this dashboard. The monitoring pairs will be selected by adding to the Market Watch (no need to set  prefixes or suffixes) , you can monitor many pairs as you like. This dashboard will check almost popular time frame (M1,M5,M15,M30,H1,H4 and D1). The colors can be customized. The Aroon indicator has been included in to this Dashboard, you do not need purchasing it. Crossover signal c
MAs Crossover Dashboard Pro uses the value of Moving Average indicator. The periods of 2 MAs can be adjusted via the Edit boxes of this dashboard. The monitoring pairs will be selected by adding to the Market Watch (no need to set  prefixes or suffixes) , you can monitor many pairs as you like. This dashboard will check almost popular time frame (M1,M5,M15,M30,H1,H4 and D1). The colors can be customized. The parameter of MAs can be set at the input. Crossover signal can be sent to you screen, yo
Stochastic Crossover Dashboard Pro uses the value of Stochastic indicator. The Stochastic's parameters can be adjusted via the Edit boxes of this dashboard. The monitoring pairs will be selected by adding to the Market Watch (no need to set  prefixes or suffixes) , you can monitor many pairs as you like. This dashboard will check almost popular time frame (M1,M5,M15,M30,H1,H4 and D1). The colors can be customized. The parameters of Stochastic can be set at the input. Crossover signal can be sent
Eakao is a trending following EA. This EA uses some custom indicators to detect entry signal. There are 2 trades opened per signal, one trade has fixed take profit, EA will use breakeven and trailing stop for another trade. The fixed stop loss and take profit are always set for each trade. Beside stop loss, this EA uses an exit indicator to exit the trade before stop loss or take profit are triggered. This EA has smart money management. Users only need to determine the accepted loss for each tr
Set and Forget EA is a trending following Expert Advisor. Basically, this EA uses Price Action method to determine the trend then take the trades at the pull back. The pattern has been tested since 2004 and show a good result. The default setting is set to trade 33 symbols (32 forex pairs and XAUUSD). Please delete the symbol that you do not want to trade in the setting. For each entry signal, EA will open 2 trade with Stop Loss and 2 Take Profit. When first trade hit take profit, second trade w
Bollinger Bands Multi Dashboard MT5 uses the value of Bollinger Bands indicator. This dashboard will monitor all symbols in the market watch. We can set up to receive an alert, notification or an email when the buy/sell signal appear on each timeframe. You can check all symbols via only 1 chart. This dashboard will check almost popular time frame (M1,M2,M3,M4,M5,M6,M10,M12,M15,M20,,M30,H1,H2,H3,H4,H6,H8,H12 and D1) in MT5. The colors can be customized. We can have a look at many pairs and many t
This is the MT5 Ichimoku Dashboard. This dashboard will scan multiple timeframes in MT5 platform, from M1 chart to D1 chart. It will send the buy/sell signals by alert on the platform or sending notification to your phone or message you via a email. The buy/sell signal can be set by cross of multiple lines: ex: tenkan-sen line, kijun-sen line, the cloud or you can select the price to cross or above/below the kumo cloud... Please discovery in the input setting, You can find the rule that you are
This is the ADX Dashboard MT5. This dashboard will scan multiple timeframes in MT5 platform, from M1 chart to D1 chart. It will send the buy/sell signals by alert on the platform or sending notification to your phone or message you via a email. The buy signal is the cross over of DI+ and DI- The sell signal is the cross under of DI+ and DI-. The up trend color will be displayed when DI+ is greater than DI- The down trend color will be displayed when DI+ is less than DI- The value of ADX value wi
This is the Super Trend Dashboard MT5. This dashboard will scan multiple timeframes in MT5 platform, from M1 chart to D1 chart. It will send the buy/sell signals by alert on the platform or sending notification to your phone or message you via a email. The buy signal is generated when the super trend line flip from SELL to BUY. The sell signal is is generated when the super trend line flip from BUY to SELL. The up trend color will be displayed depending on the current Super Trend value.
This is the Heiken Ashi Dashboard MT5. This dashboard will scan multiple timeframes and symbols in MT5 platform, from M1 chart to D1 chart. It will send the buy/sell signals by alert on the platform or sending notification to your phone or message you via a email. The buy signal is generated when the heiken ashi bar changes its color from red to white. The sell signal is   is generated  when the heiken ashi bar changes its color from white to red. The up/down trend color will be displayed depend
This is the Parabolic Dashboard MT5. This dashboard will scan multiple timeframes and symbols in MT5 platform, from M1 chart to D1 chart. It will send the buy/sell signals by alert on the platform or sending notification to your phone or message you via a email. The buy signal is generated when the SAR changes its position from above to below of the candle. The sell signal is   is generated  when the SAR changes its position from below to above of the candle. The up/down trend color will be disp
フィルタ:
レビューなし
レビューに返信