• 概要
  • レビュー (1)
  • コメント
  • 最新情報

Transaction Speed MT5

5

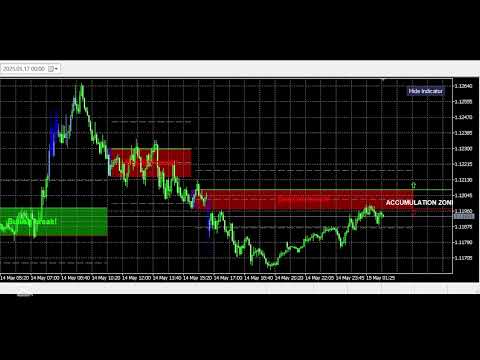
インジケーターは、マーケットで関心が表明されたゾーンをハイライトし、その後その累積ゾーンを表示します。これは大規模なオーダーブックのように機能します。
これは「大口資金」向けのインジケーターで、パフォーマンスは抜群です。市場にどんな関心があっても一目で把握できます。

(これは完全に書き直され自動化されたバージョンです。手動分析は不要です。)

Transaction Speed は新しいコンセプトのインジケーターで、市場で大口注文がいつどこに累積するかと、その恩恵を示します。非常に早期の段階でトレンドの変化を検出します。FXにおいて「取引量(ボリューム)」は誤解を招きがちですが、実際には単位時間あたりの価格変動を意味するため、正確には「トランザクションスピード(取引速度)」と呼ぶべきです。思考、行動、分析のパラダイムを変えることは極めて重要であり、このインジケーターはFXのボリューム概念を論理的に再定義し、唯一無二の精度を実現します。

使い方

  1. 自動モード(デフォルト)
    インジケーターは自動モードで起動し、どのタイムフレームでも独立して使用できます。

  2. 手動モード
    手動モードに切り替えるには、インジケーター設定で該当オプションを有効にしてください。

    • 手動モードでは、全ての計算が 2025年1月1日 から開始されます。必要に応じてこの日付を変更し、異なる結果を確認できます。

    • 最適なデータ期間は「4~6ヶ月」です。複数サイクルを網羅することで、結果の信頼性が高まります。期間が長いほどゾーン数は減少します。
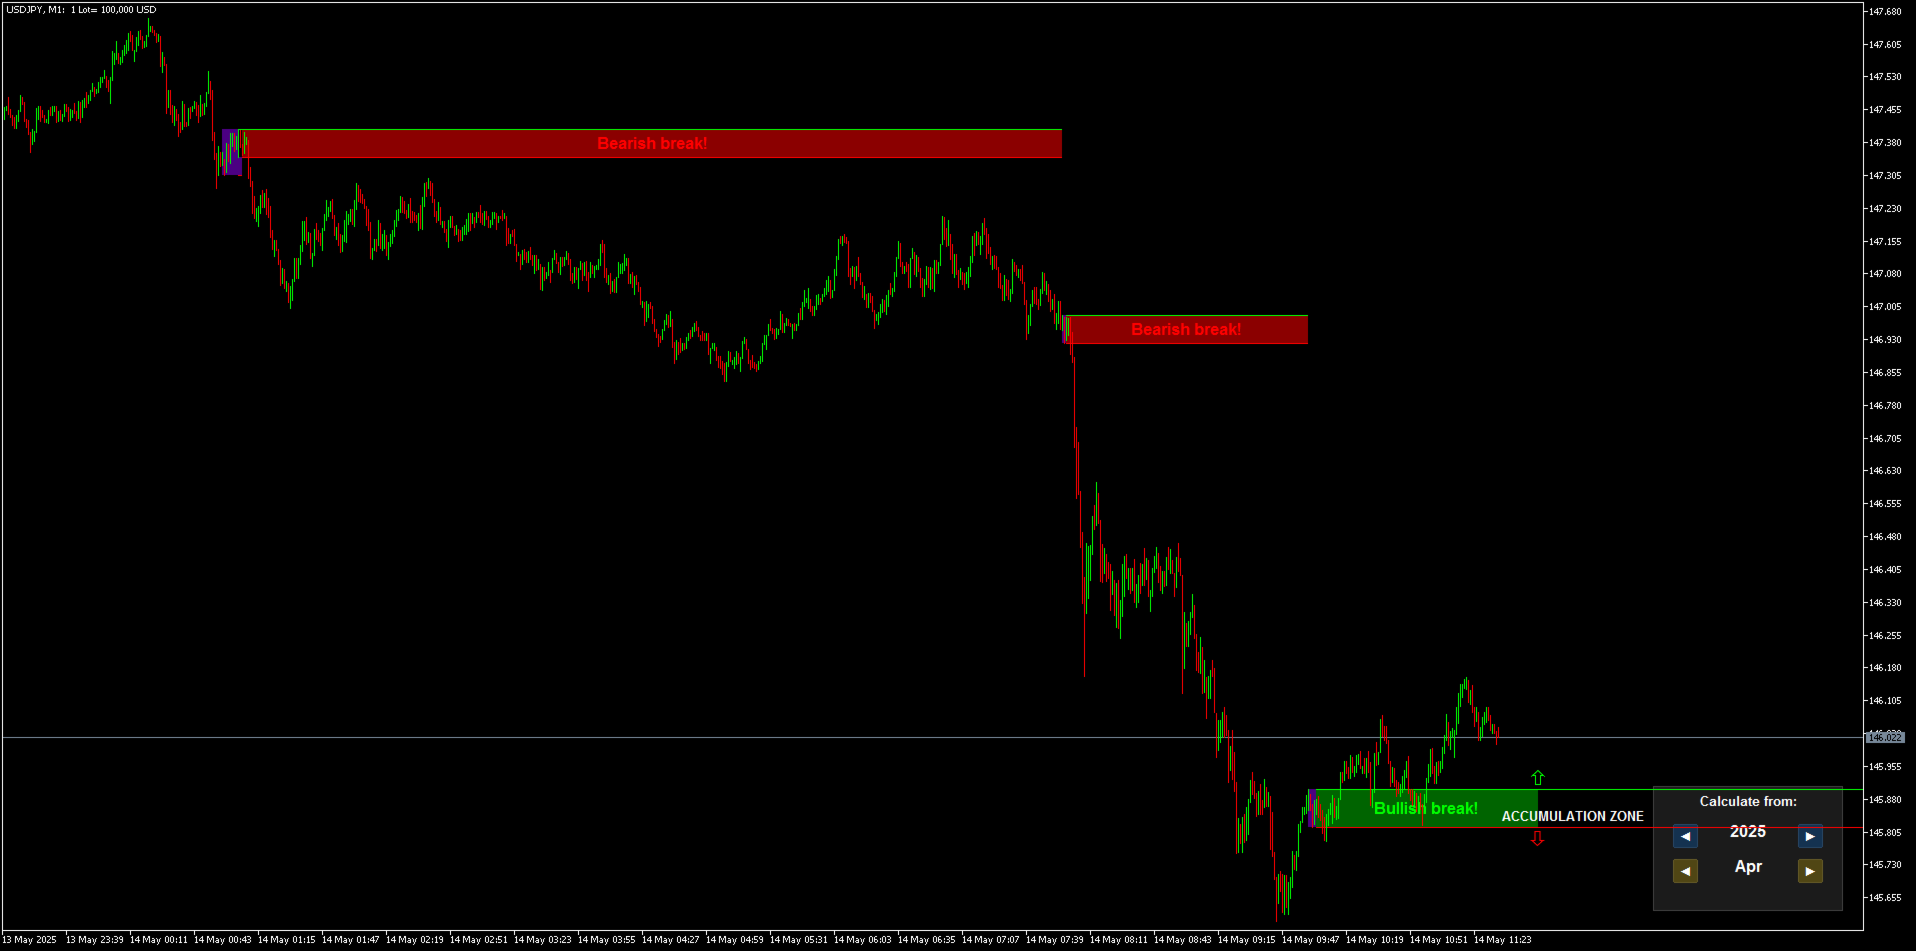
ゾーンの見方

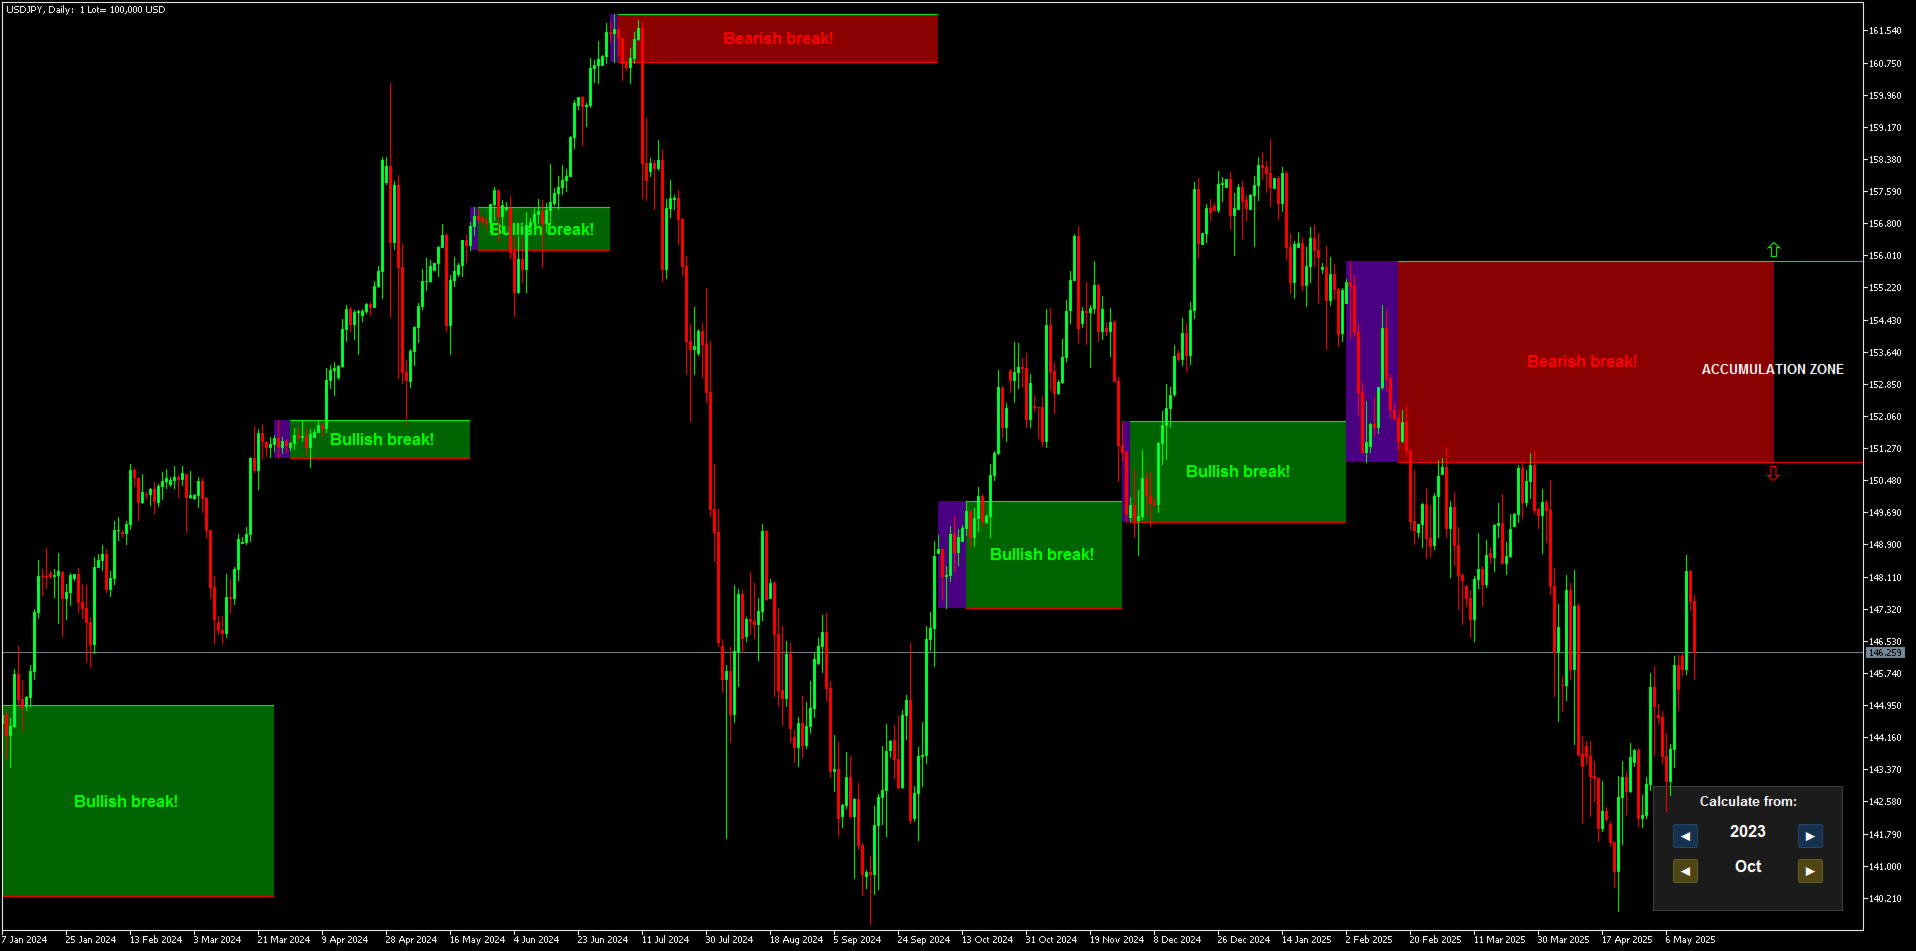
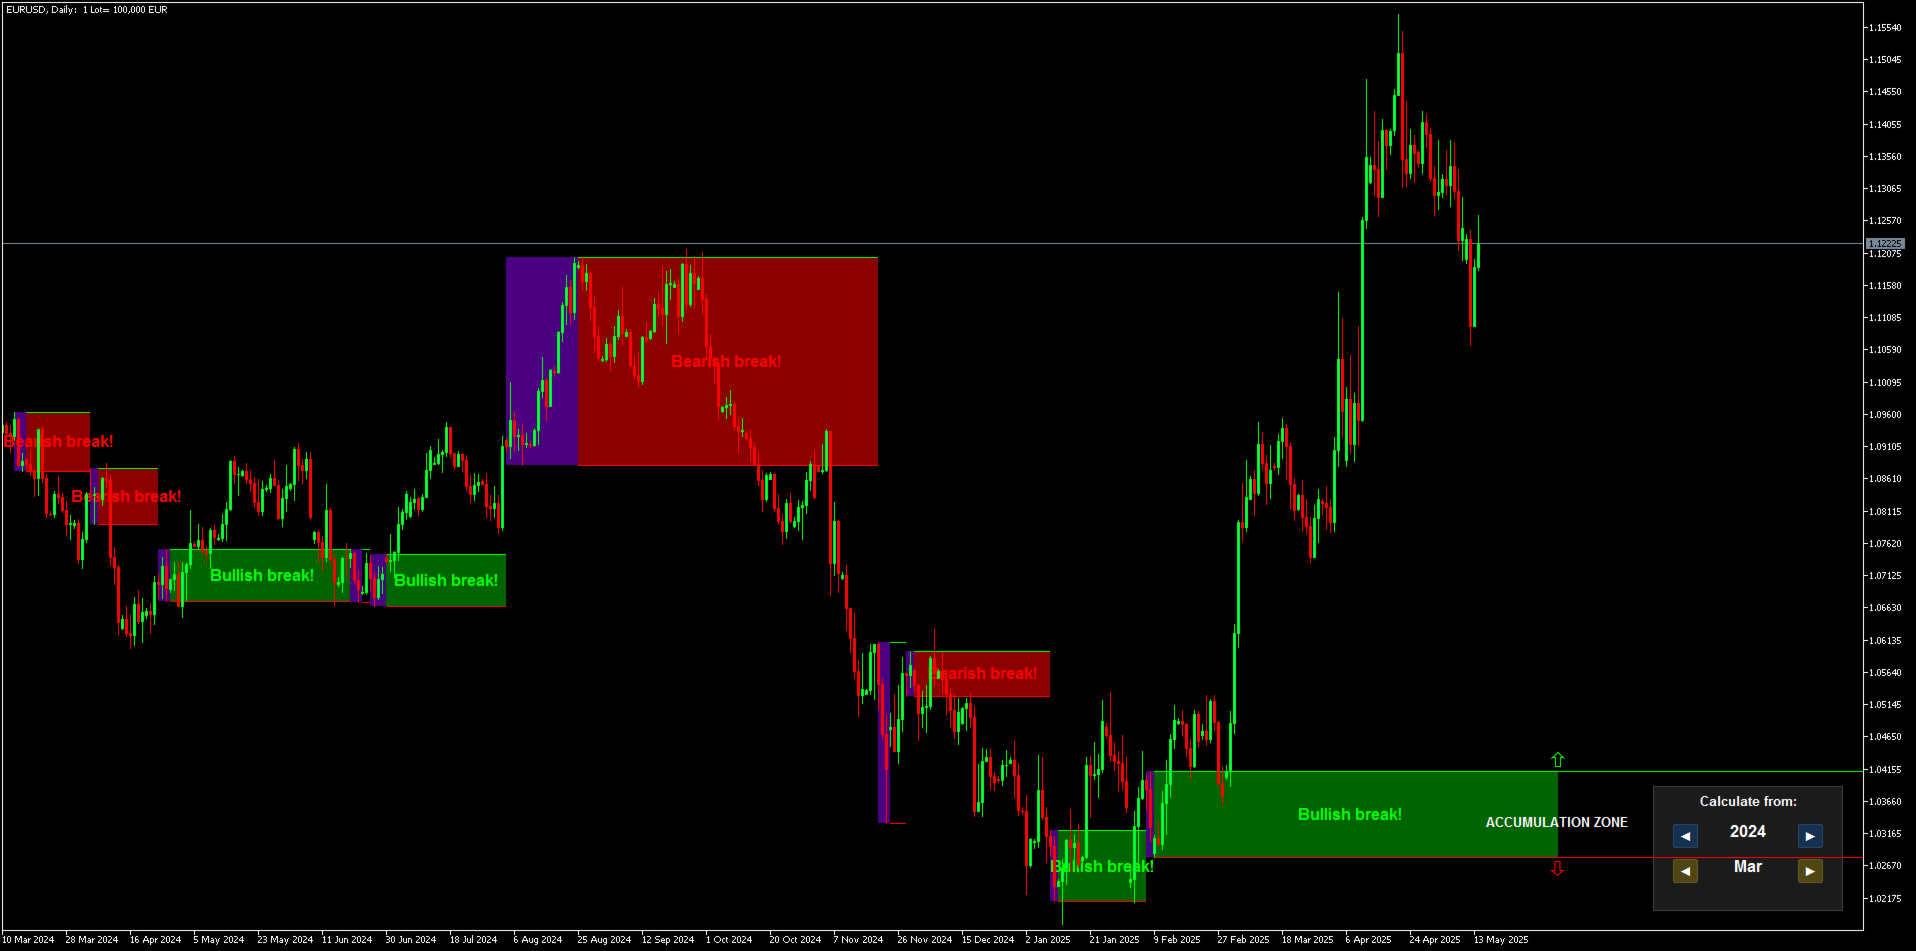
  • 宣言された関心(Declared Interest)ゾーン
    紫色の長方形でハイライトされます。

  • 注文累積(Orders Accumulation)ゾーン
    宣言された関心ゾーンの後に表示されます。

  • ブレイク判定

    • 累積ゾーンを上に突き抜けると、ゾーンは緑色に変わり、強気トレンドを示します。

    • 累積ゾーンを下に突き抜けると、ゾーンは赤色に変わり、弱気トレンドを示します。

    • ゾーンの境界に一切触れずに完全に外側で終値をつけたローソク足は「真のブレイクアウト」とみなされます。

ローソク足が累積ゾーンの外で完全に形成されると、それがブレイクアウトのシグナルとなり、マーケットの方向性を示します。トレンドは、逆方向へのブレイクアウトが発生するか、新たな関心ゾーンが形成されるまで有効です。

ゾーン・ツー・ゾーン戦略

  • 例1:
    累積ゾーンがブレイクされたら、その方向にエントリーします。

  • 例2:
    4時間足で強気のブレイクアウトが発生し、相場が上昇。その後1時間足のゾーンが形成されたら、ポジションをクローズし、次の指示を待ちます。

  • 例3:
    ゾーン内にいる場合、上端で売り、下端で買いを行い、ゾーンがブレイクされるまでホールドします。これはレンジトレードですが、リスクが高いため 決してインジケーターに逆らわないでください!
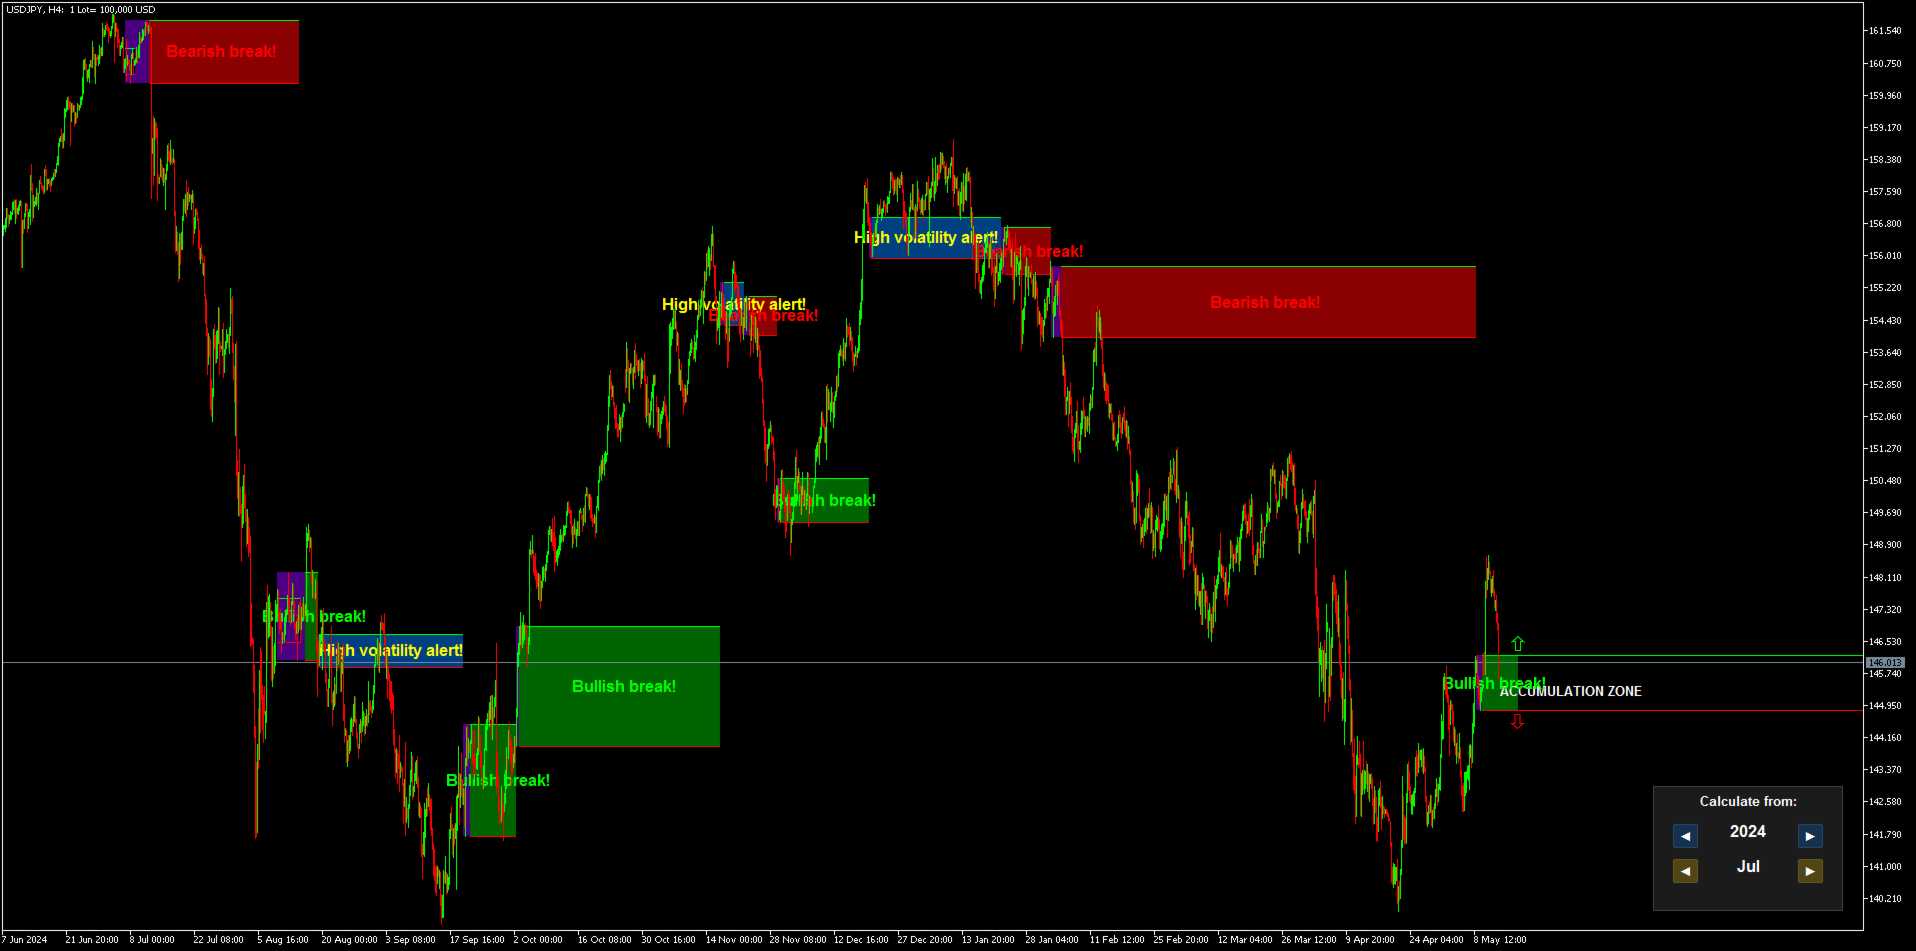
  • 高ボラティリティアラート
    あるゾーンが両方向にブレイクされると、High Volatility Alert シグナルが発生します。

これらは「資金の跡」です。ティックボリュームは誤解を招くため、肉眼では捉えられません。このインジケーターはティックボリュームを市場アクティビティに変換し、高度な分析ニーズに応える真剣なツールです。

推奨設定

  • 通貨ペア: EUR/USD、USD/JPY、GBP/USD など、ティックボリュームの大きい主要ペア

  • タイムフレーム: 全て対応

  • 最低入金額: なし

  • 口座タイプ: 制限なし

  • ブローカー: 制限なし(ただし、流動性の高い大手ブローカー推奨)

純粋なサイエンス。すべての人向けではありません。高価なのには理由があります。
大局を知りたいなら、ここに答えがあります。


レビュー 1
Mase
1679
Mase 2025.05.29 14:17 
 

Simply perfect! In combination with Ivan's other technical indicators, it is a powerful tool. Warning: highly addictive, as the indicators bring so much joy and success. Highly recommended.

おすすめのプロダクト
To download MT4 version please click here . - This is the exact conversion from TradingView: "Trend Direction Force Index - TDFI [wm]" By "causecelebre". - The screenshot shows similar results from tradingview and Metatrader when tested on ICMarkets on both platforms. - This indicator uses multiple levels of averaging to detect trend strength. - You can optimize filter low and filter high levels to achieve best results. - You have access to buffers to use in EAs. - This is a light-load processin
Manyal trading system, CovEchoTrend Robot, focuses on reliability and flexibility. By employing statistical analysis methods to study the relationships between the base indicator and market patterns, the system enables a deeper understanding of market processes. Intelligent pattern analysis: The application of statistical data processing helps identify key trend reversal points more accurately, signaling significant market shifts. Informed decision-making is based on the intersection of indicato
Range Directional Force Indicator – Designed for You to Optimize! The Range Directional Force Indicator is a cutting-edge tool designed to empower traders by visualizing market dynamics and directional strength. Built to offer insights into market trends and reversals, this indicator is an invaluable asset for traders seeking precision in their strategies. However, it is important to note that this indicator is not optimized, leaving room for you to tailor it to your unique trading preferences.
The key logic of SignalTech is generated by Artificial Intelligence. The machine learning module should continue optimizing the core logic on the server side to guarantee that SignalTech System can accurately track the market's movement.  SignalTech can generate AI based signals with Buy/Sell Arrows and Pop-Up/Sound Alerts. Each signal has clear Entry and stop Loss levels, which should be automatically flagged on the chart, as well as potential Targets 1, 2, and 3. SignalTech can work on EURU
Limitless MT5 is a universal indicator suitable for every beginner and experienced trader. works on all currency pairs, cryptocurrencies, raw stocks Limitless MT5 - already configured and does not require additional configuration And now the main thing Why Limitless MT5? 1 complete lack of redrawing 2 two years of testing by the best specialists in trading 3 the accuracy of correct signals exceeds 80% 4 performed well in trading during news releases Trading rules 1 buy signal - the ap
Was: $249  Now: $149   Market Profile defines a number of day types that can help the trader to determine market behaviour. A key feature is the Value Area, representing the range of price action where 70% of trading took place. Understanding the Value Area can give traders valuable insight into market direction and establish the higher odds trade. It is an excellent addition to any system you may be using. Inspired by Jim Dalton’s book “Mind Over Markets”, this indicator is designed to suit the
A scalping indicator based on mathematical patterns, which on average gives signals with relatively small SL, and also occasionally helps to catch big moves in the markets (more information in the video) This indicator has three main types of notifications: The first type warns of a possible/upcoming signal on the next bar The second type indicates the presence of a ready signal to enter the market/open a position The third type is for SL and TP levels - you will be notified every time price re
PipFinite Exit EDGE MT5
Karlo Wilson Vendiola
4.86 (29)
Did You Have A Profitable Trade But Suddenly Reversed? In a solid strategy, exiting a trade is equally important as entering. Exit EDGE helps maximize your current trade profit and avoid turning winning trades to losers. Never Miss An Exit Signal Again Monitor all pairs and timeframes in just 1 chart www.mql5.com/en/blogs/post/726558 How To Trade You can close your open trades as soon as you receive a signal Close your Buy orders if you receive an Exit Buy Signal. Close your Sell orders if
RAD CRITICAL LEVES RAD indicator tracks “Relevant Volume” in real time, identifying accumulation and distribution processes, projecting them in the chart as SUPPORT or RESISTANCE zones. Natural   support   and resistance levels are generated by Volume Accumulation and Distribution processes. As these processes evolve, levels at which the relevant volume in the market place is positioned, become difficult areas to cross upwards or downwards. By using this information, traders can identify very s
The Smooth Price technical indicator is used for plotting a smoothed line as close to the price of the financial instrument as possible, and serves to eliminate its noise components. The indicator is part of the Monarch trading system, but here it is presented as an independent technical analysis tool. The indicator is based on the cluster digital filter , which, unlike the ClusterSMA , is applied directly to the price time series. Smooth Price does not redraw (except the very last, zero bar) an
SMC Venom Model BPR インジケーターは、スマート マネー (SMC) コンセプトで取引するトレーダー向けのプロフェッショナル ツールです。価格チャート上の 2 つの主要なパターンを自動的に識別します。 FVG   (フェアバリューギャップ) は、3 本のローソク足の組み合わせで、最初のローソク足と 3 番目のローソク足の間にギャップがあります。ボリュームサポートのないレベル間のゾーンを形成し、価格修正につながることがよくあります。 BPR   (バランス価格範囲) は、2 つの FVG パターンの組み合わせで、「ブリッジ」を形成します。これは、価格がボリュームアクティビティの少ない動きで動くときに、ブレイクアウトしてレベルに戻るゾーンで、ローソク足の間にギャップを作成します。 これらのパターンは、大規模な市場プレーヤーと一般参加者の相互作用が発生するチャート上のボリュームと価格動向の分析に基づいて、トレーダーが主要なサポート/レジスタンス レベル、ブレイクアウト ゾーン、エントリ ポイントを識別するのに役立ちます。 インジケーターは、長方形と矢印の形でパターンを視覚
Indicator Name: Fibaction – price action candle Detector Description: Fibo Signal Boxes is a powerful Smart Money Concept (SMC)-inspired indicator that auto-detects price action candles. bullish hammers and shooting stars, then draws precise Fibonacci entry zones and multiple take-profit levels directly on the chart. as for the SL personally i use 40 pips rules  Key Features: Detects bullish hammer and shooting star reversal candles. Automatically draws Fibonacci entry and TP boxes. as
The Missing Edge You Need To Catch Breakouts Like A Pro. Follow a step-by-step system that detects the most powerful breakouts! Discover market patterns that generate massive rewards based on a proven and tested strategy. Unlock Your Serious Edge Important information here www.mql5.com/en/blogs/post/723208 The Reliable Expert Advisor Version Automate Breakout EDGE signals using "EA Breakout EDGE" Click Here Have access to the game changing strategy that will take your trading to the next l
Trend and Signals MT5  indicator scans  30 trading Instruments (Forex, Metals and Indices).     It uses special algorithm on the  current market   based on   Pure Price Action   and display the overall trend and signal on the dashboard. When signals are produced the indicator sends alert and notification. Strategy for Signals This indicator uses the daily timeframe to determine the direction of the trend. The hourly timeframe is used to identify possible entries. Main trend and is determined by
How to use Pair Trading Station Pair Trading Station is recommended for H1 time frame and you can use it for any currency pairs. To generate buy and sell signal, follow few steps below to apply Pair Trading Station to your MetaTrader terminal. When you load Pair Trading Station on your chart, Pair Trading station will assess available historical data in your MetaTrader platforms for each currency pair. On your chart, the amount of historical data available will be displayed for each currency pai
The new update makes this indicator a complete tool for studying, analyzing and operating probabilistic patterns. It includes: On-chart Multi-asset percentage monitor. Configurable martingales. Twenty-one pre-configured patterns, including Mhi patterns and C3. An advanced pattern editor to store up to 5 custom patterns. Backtest mode to test results with loss reports. Trend filter. Hit operational filter. Martingale Cycles option. Various types of strategies and alerts. Confluence between patter
Market Maestro: Your Ideal Partner for Automated Forex Trading If you're looking for a reliable assistant for trading in the currency market, Market Maestro is exactly what you need. This modern Forex bot is built using the latest technologies and algorithms, allowing it to effectively analyze market data and make informed trading decisions in real-time. Key Features of Market Maestro 1. Multicurrency Capability for Broad Opportunities Market Maestro can work with a wide range of currency pairs,
プレミアムレベルは、正しい予測の精度が80%を超える独自の指標です。 この指標は、最高のトレーディングスペシャリストによって2か月以上テストされています。 あなたが他のどこにも見つけられない作者の指標! スクリーンショットから、このツールの正確さを自分で確認できます。 1は、1キャンドルの有効期限を持つバイナリーオプションの取引に最適です。 2はすべての通貨ペア、株式、商品、暗号通貨で機能します 手順: 赤い矢印が表示されたらすぐにダウントレードを開き、青い矢印が表示されたら閉じます。青い矢印の後に開くこともできます。 試してテストしてください!推奨設定はデフォルトです! 日足チャートで最高の精度を示します! インディケータは、2600 Pipsの収益性に対して、約10Pipsという非常に小さなマージンを使用します。
I'll keep it Short and to the point.  Let Your Backtest Results Speak for Themselves. After much deliberation, we’ve decided to release the foundational logic behind our process for public use. This isn’t about changing the way you trade—because we know that’s unique to you. The best ways to enter a position? Those have always been confidential ! What we can share is the first of three essential steps we use before entering any trade. This tool is designed to keep you on the right side of the m
Our BOOM SELL ALERT indicator is specifically engineered to   take candles on BOOM 1000 , BOOM 500 is tool is optimized for M1 (1-minute) timeframe, ensuring you receive timely and actionable insights.   The indicator is a combination of   many indicators. -        AO Oscillator -        Stochastic   HOW TO USE THIS INDICATOR To use well this indicator , it   need to use SCHAFF TREND RSX ( 5 MIN OR M5) IF SCHAFF trend RSX is GREEN and you have a signal then SELL when you have ENTRY and out with
A powerful oscillator that provide Buy and Sell signals by calculating the investor liquidity. The more liquidity the more buy possibilities. The less liquidity the more sell possibilities. Please download the demo and run a backtest! HOW IT WORKS: The oscillator will put buy and sell arrow on the chart in runtime only . Top value is 95 to 100 -> Investors are ready to buy and you should follow. Bottom value is 5 to 0 -> Investors are ready to sell and you should follow. Alert + sound will appe
Sonic Edge Meter: Precision for Reversals and Price Surges Sonic Edge Meter is a powerful indicator built on original algorithms for extremum detection . It’s specifically designed to identify market reversals and sharp directional moves , giving you a clear signal before they happen. How Does Sonic Edge Meter Work? The indicator notifies you of potential turning points or price spikes by displaying visual markers directly on the chart: Blue dot — signal to buy Red dot — signal to sell
「この秘密のトレーディングツールはプロップ会社によって禁止されている(彼らはあなたに知られたくない!)」 EAなしで究極のトレーディング・エッジを発見!(トレーダーのために、トレーダーによって作られました。 ロボットではなく、純粋なトレーディング・パワーです。) 偽のブレイクアウト、突然の反転、市場操作に苦戦していませんか?この強力なトレーディングツールは、マーケットが速く動くときでも、レーザー精度のシグナルを提供します! --------------------------------------------------------------------------------------------------- 私のおすすめ:- 最高の電波強度設定 FXペア、金、指数、暗号通貨など、あらゆる種類のシグナルに対応。 ご希望のTFを選択し、バックテスト前に入力タブからシグナル値を変更してください。 >> ( 4または5 ) >> 1m / 5m / 15m / 30m / 1H / 4H の場合 >> (2または3) >>日足/週足/月足用 -----------------
STRICTLY FOR BOOM INDEX ONLY!!!!! Here I bring the Maximum Trend Arrows OT1.0 MT5 indicator. This indicator is made up of a combination of different trend indicators for entries and exits, for entries an orange arrow will paint on the chart below the current market and a red flag for closing of trades and it produces buy arrows only. When the orange arrow appears, it will appear along with it's sound to notify you. The 1H timeframe is recommended, don't use it anywhere else than on the 1H timefr
Introducing "X Marks the Spot" – Your Ultimate MetaTrader 5 Indicator for Perfect Trades! Are you tired of the guesswork in trading? Ready to take your MetaTrader 5 experience to a whole new level? Look no further – "X Marks the Spot" is here to revolutionize your trading strategy! What is "X Marks the Spot"? "X Marks the Spot" is not just another indicator – it's your personal trading compass that works seamlessly on all timeframes . Whether you're a beginner or an experienced trader,
SYSTEM INTRODUCTION:   The Binary Options Momentum System Is Specifically Designed For Binary Options Trading. Unlike Other Systems And Indicators That Were Adopted From Other Trading Environments For Binary Options. Little Wonder Why Many Of Such Systems Fail To Make Money . Many End Up Loosing Money For Their Users.  A Very Important Fact That Must Be Noted Is The Fact That Application Of Martingale Is not Required. Thus Making It Safer For Traders Usage And Profitability. A Trader Can Use Fi
インディケータは現在のクオートを作成し、これを過去のものと比較して、これに基づいて価格変動予測を行います。インジケータには、目的の日付にすばやく移動するためのテキスト フィールドがあります。 オプション: シンボル - インジケーターが表示するシンボルの選択; SymbolPeriod - 指標がデータを取る期間の選択; IndicatorColor - インジケータの色; HorisontalShift - 指定されたバー数だけインディケータによって描画されたクオートのシフト; Inverse - true は引用符を逆にします。false - 元のビュー。 ChartVerticalShiftStep - チャートを垂直方向にシフトします (キーボードの上下矢印)。 次は日付を入力できるテキストフィールドの設定で、「Enter」を押すとすぐにジャンプできます。
Naked Forex Kangaroo Tail Indicator Kangaroo Tail Indicator is a pattern recognition indicator for Forex, Stocks, Indices, Futures, Commodities and Cryptos. The Kangaroo Tail is a multi-bar pattern. The Kangaroo Tail pattern is very effective and is very simple to trade. The strategy that comes with the Kangaroo Tail is based on price action. The indicator does what it was designed for: displaying Kangaroo Tail patterns.   Don't expect to follow the up and down arrows and make money . Tradin
The AirShip indicator can help you to confirm the trend. The red dots mean uptrend, and the green dots mean downtrend. The AirShip indicator provides open and close positions signals when reaching overbought or oversold levels. It has a smart algorithm that detects the trend changes. If the trend reached the end of phase, the yellow dots will send you the notification. The AirShip indicator not only draw the red trend lines and the yellow trend lines using a multicriteria strength engine, but al
このプロダクトを購入した人は以下も購入しています
素晴らしいバックテスト 、驚異的な数字を伴う ライブ口座実績の証明 、そして あらゆる場所での統計結果 を備えたトレーディングインジケーターを購入したにもかかわらず、使用後に 口座を破綻させてしまった 経験は何度ありますか? シグナルを単独で信用すべきではありません。なぜそのシグナルが最初に現れたのかを知る必要があります。そして、それがRelicusRoad Proが最も得意とすることです! ユーザーマニュアル + 戦略 + トレーニングビデオ + VIPアクセス付きプライベートグループ + モバイル版利用可能 市場を見る新しい方法 RelicusRoadは、FX、先物、暗号通貨、株式、指数向けの「 世界で最も強力で最高の取引インジケーター 」であり、トレーダーが 口座を成長させる ために必要なすべての情報とツールを提供します。「 テクニカル分析 」と「 取引計画 」を提供し、「 初心者 」から「 上級者 」まで、「 すべてのトレーダーの成功 」を支援します。 これは、将来の市場を「 予測 」するのに十分な情報を提供する「 主要な取引インジケーター 」です。意味をなさない複数の異な
反転ゾーン / ピークボリューム / 主要プレーヤーのアクティブゾーン =       TS TPSプロシステム 説明書 RUS       /       説明書     英語     /           バージョン MT4        このインジケーターを購入したすべての購入者は、さらに以下を無料で受け取ります: RFI SIGNALS サービスからの取引シグナルへの 6 か月間のアクセス - TPSproSYSTEM アルゴリズムに従った既製のエントリ ポイント。 定期的に更新されるトレーニング資料 - 戦略に没頭し、プロフェッショナル レベルを高めます。 平日は 24 時間 365 日サポート、非公開のトレーダー チャットへのアクセス - コミュニケーション、サポート、市場状況の分析。 著者の設定ファイル - 余分な労力をかけずに最大の結果を達成するための自動インジケーター設定。 主な機能: 売り手と買い手のアクティブなゾーンを表示します。 このインジケーターは、購入と販売の正しい最初のインパルス レベル/ゾーンをすべて表示します。これらのレベル/ゾーンがアクティブに
ENIGMERA:マーケットの核 はじめに このインジケーターとトレーディングシステムは、金融市場に対する卓越したアプローチを提供します。ENIGMERA はフラクタルサイクルを利用してサポート(支持線)とレジスタンス(抵抗線)レベルを正確に計算します。真の蓄積フェーズを表示し、方向性とターゲットを示します。トレンド中でも調整局面でも機能するシステムです。 仕組み インジケーターの大部分の機能は、チャート左側のボタンで操作でき、市場状況に即座に対応できます。 ボタン ON/OFF – インジケーター全体の表示/非表示を切り替え。 Support – トレンドの主要サポートライン。 Ch – サポートチャネルを有効化し、許容できる乖離幅を示す。 Dev1(第1偏差) – サポート乖離内での価格変動を示し、市場のもみ合いまたは強さの蓄積を示唆。 Dev2(第2偏差) – 偏差間での価格変動を表示し、トレンドの形成および方向性を示唆。 Dev3(第3偏差) – トレンドの大きな加速と高いボラティリティを示す。 45deg(45度線) – 45度線に対する市場の速度と動きの安定性を示す。
MonetTrend — Премиум-индикатор для торговли по тренду (M30, H1, H4) MonetTrend — это мощный и визуально понятный трендовый индикатор, созданный для торговли на таймфреймах M30, H1 и H4. Он идеально подходит для работы с волатильными инструментами, такими как: • Золото (XAUUSD) • Криптовалюты (BTCUSD) • Валютные пары (EURUSD, USDJPY и др.) Ключевые особенности MonetTrend: • Автоматическое отображение Take Profit 1 (TP1) и Stop Loss (SL): После появления сигнала индикатор сразу показывает: • TP
Quantum TrendPulse を ご紹介します。これは、   SuperTrend   、   RSI   、および Stochastic のパワーを 1 つの包括的なインジケーターに組み合わせて、取引の可能性を最大限に引き出す究極の取引ツールです。精度と効率を求めるトレーダー向けに設計されたこのインジケーターは、市場のトレンド、勢いの変化、最適なエントリー ポイントとエグジット ポイントを自信を持って特定するのに役立ちます。 主な特徴: SuperTrend 統合: 現在の市場動向に簡単に追従し、収益性の波に乗ることができます。 RSI精度: 買われすぎと売られすぎのレベルを検出し、市場の反転のタイミングに最適で、SuperTrendのフィルターとして使用されます。 確率的精度: 確率的振動を活用して、変動の激しい市場で隠れたチャンスを見つけます。SuperTrend のフィルターとして使用されます。 マルチタイムフレーム分析:   M5 から H1 または H4 まで、さまざまなタイムフレームで市場を常に把握します。 カスタマイズ可能なアラート: カスタム取引条件が満たされ
VERSION MT4        —        ИНСТРУКЦИЯ RUS           —        INSTRUCTIONS  ENG 主な機能: レンダリングなしで正確な入力信号! シグナルが表示されると、それは関連性を維持します。これは、シグナルを提供してからそれを変更し、その結果、入金された資金が失われる可能性があるリドローインジケーターとの重要な違いです。より高い確率と精度で市場に参入できるようになりました。矢印が表示された後、ターゲットに到達する (利益確定) か反転シグナルが表示されるまで、ローソク足に色を付ける機能もあります。 STOP-LOSS/TAKE-PROFITゾーンの表示 エントリーポイントを検索する際の視覚的な明瞭さを改善するために、最適な市場エントリーポイントが検索される購入/販売ゾーンを最初に表示するモジュールが作成されました。ストップロスレベルを操作するための追加のインテリジェントロジックは、時間の経過とともにそのサイズを縮小するのに役立ち、それによって取引に参加するときの初期リスクを軽減します(Move SL)。 より高いタイ
The Trend Forecaster indicator utilizes a unique proprietary algorithm to determine entry points for a breakout trading strategy. The indicator identifies price clusters, analyzes price movement near levels, and provides a signal when the price breaks through a level. The Trend Forecaster indicator is suitable for all financial assets, including currencies (Forex), metals, stocks, indices, and cryptocurrencies. You can also adjust the indicator to work on any time frames, although it is recommen
ACB Breakout Arrows MT5
KEENBASE SOFTWARE SOLUTIONS
5 (1)
ACB Breakout Arrows インジケーターは、特別なブレイクアウトパターンを検出することで、市場における重要なエントリーシグナルを提供します。このインジケーターはチャートを常に監視し、一方向に勢いが定着してきた段階で、主要な値動きの直前に精度の高いエントリーシグナルを表示します。 マルチシンボル・マルチタイムフレームスキャナーはこちらから - ACB Breakout Arrows MT5 用スキャナー 主な機能 ストップロスとテイクプロフィットの水準が自動で表示されます。 すべての時間足のブレイクアウトシグナルを監視できるMTFスキャナーダッシュボードを搭載。 デイトレーダー、スイングトレーダー、スキャルパーに最適。 シグナル精度を高めるための最適化されたアルゴリズム。 損益分岐点やスキャルピングターゲットに使える特別なライン(クイックプロフィットライン)。 勝率、平均利益などのパフォーマンス分析メトリクスを表示。 リペイントなし。 トレードの確認 - 低確率のトレードを除外するために ACB Trade Filter インジケーター を使用してください。 強い買い:
トレンドトレーディング は、タイミングのプルバックとブレイクアウトにより、市場で起こっているトレンドから可能な限り利益を得るように設計された指標です。確立されたトレンドの中で価格が何をしているかを分析することにより、取引の機会を見つけます。 [ インストールガイド | 更新ガイド | トラブルシューティング | よくある質問 | すべての製品 ] 自信を持って効率的に金融市場を取引する むち打ちにならずに確立されたトレンドから利益を得る 収益性の高いプルバック、ブレイクアウト、早期の逆転を認識する この指標は、独自の品質とパフォーマンスを分析します 複数時間枠のダッシュボードを実装します インジケーターは再描画されていません 電子メール/音声/視覚アラートを実装します 確立されたトレンドは多くの取引機会を提供しますが、ほとんどのトレンド指標はそれらを完全に無視しています。インジケーターの解釈はかなり簡単です: (1) トレンドの変化 (2) トレンドの方向への後退 (3) トレンドの方向へのブレイクアウト 赤いダッシュ は下降トレンド中の修正です 青いダッシュ は上昇トレンド中
Pro Thunder V10: バイナリーオプション取引の究極のインジケーター! Pro Thunder V10 で取引を次のレベルへ引き上げましょう!最先端の ニューラルネットワークAI技術 に基づいたこの革新的なインジケーターは、比類のない精度と信頼性を提供するよう設計されています。リアルタイムの非リペイント信号から、変動する市場条件でもシームレスなパフォーマンスまで、 Pro Thunder V10 はあなたの取引における究極のパートナーです。 主な特徴: 圧倒的な精度: 高精度の信号で市場を制覇。重要なニュースイベントを含むあらゆる市場状況で実証済み。 OTC対応: OlympTrade、Pocket Option、Quotex、Binomo、IQ Option などのプラットフォームで完璧に動作。 MT5専用: 最も先進的な取引プラットフォームである MetaTrader 5 のために特別に設計されています。 パフォーマンスダッシュボード: 勝敗や信号を直感的に追跡できる使いやすい画面。 永久アクセス: 一度の購入で、すべてのアップデートに生涯アク
Was: $299  Now: $149  Supply Demand uses previous price action to identify potential imbalances between buyers and sellers. The key is to identify the better odds zones, not just the untouched ones. Blahtech Supply Demand indicator delivers functionality previously unavailable on any trading platform. This 4-in-1 indicator not only highlights the higher probability zones using a multi-criteria strength engine, but also combines it with multi-timeframe trend analysis, previously confirmed swings
The   Kecia Market News Detector  is a cutting-edge MT5 indicator designed to detect and quantify the impact of news events and market anomalies across multiple currency pairs in real-time. By leveraging 20+ advanced statistical metrics, this tool identifies abnormal market behavior, liquidity shifts, and volatility regimes often triggered by economic news, geopolitical events, or institutional order flow. Key Features: Multi-Symbol Dashboard : Monitor up to 30 currency pairs simultaneously in a
IQ Gold Gann Levels a non-repainting, precision tool designed exclusively for XAUUSD/Gold intraday trading. It uses W.D. Gann’s square root method to plot real-time support and resistance levels, helping traders spot high-probability entries with confidence and clarity. William Delbert Gann (W.D. Gann) was an exceptional market analyst, whose trading technique was based on a complex blend of mathematics, geometry, astrology, and ancient mathematics which proved to be extremely accurate. Download
TPA True Price Action indicator reveals the true price action of the market makers through 100% non-repainting signals strictly at the close of a candle! TPA shows entries and re-entries, every time the bulls are definitely stronger than the bears and vice versa. Not to confuse with red/green candles. The shift of power gets confirmed at the earliest stage and is ONE exit strategy of several. There are available now two free parts of the TPA User Guide for our customers. The first "The Basics"
すべての時間枠とすべての通貨ペアの価格反転ポイントを正確に決定するための指標。市場の技術分析と数学的診断モデルの助けを借りて、この指標は価格の逆転点と現在の傾向の方向を非常に効率的に決定します。インジケーターは、この情報を矢印と線の形でチャートに表示します。矢印はトレンド反転ポイントを示し、線は現在のトレンド方向を示します。 この指標は、既存の取引戦略に統合することができ、スキャルピングまたは長期投資のための新しい取引戦略を構築するためにも使用できます。このインジケーターで頭皮を剥ぎ、日中に注文を開始する場合は、M5-M15の時間枠を使用し、インジケーターがチャートに矢印を描くときに取引を開始することをお勧めします。長期投資の場合は、H1、H4、D1の時間枠で取引することをお勧めします。この場合、インジケーターが引く線の方向にトレードする方が良いです。 インジケーターの利点: 値を再描画しません。 すべての時間枠で取引されます。 すべての通貨ペアで取引されます。 スキャルピングまたは長期取引に使用できます。 セットアップはとても簡単です。 インジケーター設定: Indicator
[ MT4 Version ] Are you tired of spending months on demo or live accounts to test your trading strategies? The Backtesting Simulator is the ultimate tool designed to elevate your backtesting experience to new heights. Utilizing Metatrader historical symbol information, it offers an unparalleled simulation of real market conditions. Take control of your testing speed, test ideas quickly or at a slower pace, and witness remarkable improvements in your testing performance. Forget about wasting tim
NOTE: CYCLEMAESTRO is distributed only on this website, there are no other distributors. Demo version is for reference only and is not supported. Full versione is perfectly functional and it is supported. CYCLEMAESTRO , the first and only indicator of Cyclic Analysis, useful for giving signals of TRADING, BUY, SELL, STOP LOSS, ADDING. Created on the logic of   Serghei Istrati   and programmed by   Stefano Frisetti ;   CYCLEMAESTRO   is not an indicator like the others, the challenge was to inter
Quantum Trend Sniper
Bogdan Ion Puscasu
4.73 (51)
ご紹介   クォンタム トレンド スナイパー インジケーターは 、トレンド反転を特定して取引する方法を変革する画期的な MQL5 インジケーターです。 13年以上の取引経験を持つ経験豊富なトレーダーのチームによって開発されました。     クォンタムトレンドスナイパーインジケーター   は、非常に高い精度でトレンドの反転を識別する革新的な方法で、あなたのトレーディングの旅を新たな高みに押し上げるように設計されています。 ***Quantum Trend Sniper Indicatorを購入すると、Quantum Breakout Indicatorを無料で入手できます!*** クォンタム ブレイクアウト インジケーターは、トレンドの反転を特定するとアラートを発し、矢印を示し、3 つのテイクプロフィットレベルを提案します。 初心者トレーダーにもプロのトレーダーにも適しています。 量子EAチャネル:       ここをクリック MT4のバージョン:       ここをクリック 推奨事項: 期間:すべての時間枠。最良の結果を得るには、M15、M30、H1 のタイムフ
Berma Bands
Muhammad Elbermawi
5 (4)
Berma Bands (BBs) インジケーターは、市場のトレンドを特定して活用したいトレーダーにとって貴重なツールです。価格と BBs の関係を分析することで、トレーダーは市場がトレンド段階にあるか、レンジ段階にあるかを判断できます。 詳細については、[ Berma Home Blog ] をご覧ください。 バーマ バンドは、上部バーマ バンド、中部バーマ バンド、下部バーマ バンドの 3 つの異なる線で構成されています。これらの線は価格の周りにプロットされ、全体的な傾向に対する価格の動きを視覚的に表します。これらのバンド間の距離から、ボラティリティや潜在的な傾向の反転についての洞察を得ることができます。 バーマ バンドの線がそれぞれ離れると、市場が横ばいまたはレンジ相場の期間に入っていることを示すことがよくあります。これは、明確な方向性の偏りがないことを示しています。トレーダーは、これらの期間中にトレンドを特定するのが難しいと感じる可能性があり、より明確なトレンドが出現するまで待つ場合があります。 バーマ バンドの線が 1 本の線に収束すると、強いトレンド環境の兆候となること
これはMT5のインジケーターで、再描画なしで取引に参入するための正確なシグナルを提供します。 外国為替、暗号通貨、金属、株式、インデックスなど、あらゆる金融資産に適用できます。かなり正確な見積もりを提供し、取引を開始して終了するのに最適な時期を教えてくれます。1つのシグナルを処理しただけでインジケーターの元が取れた例の 動画 (6:22)をご覧ください。Entry PointsPro インジケーターの助けを借りたほとんどのトレーダーの最初の1週間の結果が改善しています。 Telegramグループ に登録してください。Entry Points Proインジケーターのメリットは次の通りです。 再描画のないエントリーシグナル 再描画されるインジケーターでは一度表示されたシグナルが削除されて大きな金銭的損失につながることがありますが、これと異なり、表示されて確認されたシグナルは消えることがありません。 エラーなしの取引開始 インジケーターアルゴリズムによって取引を開始する(資産を売買する)理想的な瞬間を見つけることができます。それを使用するすべてのトレーダーの成功率が向上します。 あら
note: this indicator is for METATRADER4, if you want the version for METATRADER5 this is the link:  https://www.mql5.com/it/market/product/108106 TRENDMAESTRO ver 2.4 TRENDMAESTRO recognizes a new TREND in the bud, he never makes mistakes. The certainty of identifying a new TREND is priceless. DESCRIPTION TRENDMAESTRO identifies a new TREND in the bud, this indicator examines the volatility, volumes and momentum to identify the moment in which there is an explosion of one or more of these data a
ご紹介     Quantum Breakout PRO は 、ブレイクアウト ゾーンの取引方法を変革する画期的な MQL5 インジケーターです。 13年以上の取引経験を持つ経験豊富なトレーダーのチームによって開発されました。     クォンタム ブレイクアウト プロ   は、革新的でダイナミックなブレイクアウト ゾーン戦略により、あなたのトレーディングの旅を新たな高みに押し上げるように設計されています。 クォンタム ブレイクアウト インジケーターは、5 つの利益ターゲット ゾーンを備えたブレイクアウト ゾーン上のシグナル矢印と、ブレイクアウト ボックスに基づいたストップロスの提案を提供します。 初心者トレーダーにもプロのトレーダーにも適しています。 量子EAチャネル:       ここをクリック 重要!購入後、インストールマニュアルを受け取るためにプライベートメッセージを送ってください。 推奨事項: 時間枠: M15 通貨ペア: GBPJPY、EURJPY、USDJPY、NZDUSD、XAUUSD アカウントの種類: ECN、Raw、またはスプレッドが非常に低い R
このインディケータは、価格アクション分析とドンチャンチャネルのみを使用して、ジグザグ方式で価格の反転を検出します。再描画やバックペインティングを一切行わずに、短期取引向けに特別に設計されています。それは彼らの操作のタイミングを増やすことを目指している賢明なトレーダーにとって素晴らしいツールです。 [ インストールガイド | 更新ガイド | トラブルシューティング | よくある質問 | すべての製品 ] 驚くほど簡単に取引できます すべての時間枠で価値を提供します 自己分析統計を実装します 電子メール/音声/視覚アラートを実装します 可変長のブレイクアウトと混雑ゾーンに基づいて、インディケータは価格アクションのみを使用して取引を選択し、市場が非常に高速に行っていることに反応します。 過去のシグナルの潜在的な利益が表示されます この指標は、独自の品質とパフォーマンスを分析します 負けブレイクアウトは強調表示され、説明されます インジケータは、非バックペインティングおよび非再ペイントです この指標は、日中のトレーダーが単一の価格反転を見逃さないようにするのに役立ちます。ただし、すべての
これはほぼ間違いなく、MetaTraderプラットフォームで見つけることができる最も完全な調和価格形成自動認識インジケーターです。 19種類のパターンを検出し、フィボナッチプロジェクションをあなたと同じように真剣に受け止め、潜在的逆転ゾーン(PRZ)を表示し、適切なストップロスとテイクプロフィットレベルを見つけます。 [ インストールガイド | 更新ガイド | トラブルシューティング | よくある質問 | すべての製品 ] 19の異なる調和価格形成を検出します プライマリ、派生および補完フィボナッチ投影(PRZ)をプロットします 過去の価格行動を評価し、過去のすべてのパターンを表示します この指標は、独自の品質とパフォーマンスを分析します 適切なストップロスとテイクプロフィットのレベルを表示します ブレイクアウトを使用して適切な取引を通知します すべてのパターン比をグラフにプロットします 電子メール/音声/視覚アラートを実装します スコット・M・カーニーの本に着想を得て、この指標は最も純粋で急を要するトレーダーのニーズを満たすように設計されています。ただし、トレードを容易にする
Viking_Strategy_Signal Indicator is a solution I offer to beginner, amateur, and professional traders. My scalping robot :  https://www.mql5.com/fr/market/product/133191 By purchasing this indicator, you will first save time because it automatically analyzes the market based on Dow Theory and the Smart Money Concept (High (H), Low (L), Higher High (HH), Lower Low (LL), Break of Structure (BOS) to determine market structure and trend). It is built on my strategy, which relies on the NRTR theory t
MetaBands M5
Vahidreza Heidar Gholami
4.5 (2)
MetaBandsは、強力でユニークなアルゴリズムを使用してチャンネルを描画し、トレンドを検出して、トレーダーに取引の入出ポイントを提供することができます。チャンネル指標に加えて、強力なトレンド指標でもあります。入力パラメータを使用して新しいチャンネルを作成するために、異なるタイプのチャンネルを統合することができます。MetaBandsは、市場のイベントについてユーザーに通知するために、すべてのタイプのアラートを使用します。 特徴 ほとんどのチャンネルアルゴリズムをサポート 強力なトレンド検出アルゴリズム 異なるタイプのチャンネルを統合する能力 マルチタイムフレームおよびマルチカレンシー(シグナルマトリックス) すべてのタイプのアラート機能(サウンド、画面フラッシャー、プッシュ通知、メール、ポップアップ、矢印) 再描画しない トレンド検出 MetaBandsは、チャネル内を振動する青いラインを使用してトレンドを検出します。ラインがチャネルの上部バンドに達すると、下降トレンドの開始を示し、下部バンドに達すると上昇トレンドの開始を示します。青いラインが中心ラインに近づくと、市場はコンソリ
Elliott Wave Trend was designed for the scientific wave counting. This tool focuses to get rid of the vagueness of the classic Elliott Wave Counting using the guideline from the template and pattern approach. In doing so, firstly Elliott Wave Trend offers the template for your wave counting. Secondly, it offers Wave Structural Score to assist to identify accurate wave formation. It offers both impulse wave Structural Score and corrective wave Structure Score. Structural Score is the rating to sh
The AT Forex Indicator MT5 is a sophisticated trading tool designed to provide traders with a comprehensive analysis of multiple currency pairs. This powerful indicator simplifies the complex nature of the forex market, making it accessible for both novice and experienced traders. AT Forex Indicator uses advanced algorithms to detect trends, patterns and is an essential tool for traders aiming to enhance their forex trading performance. With its robust features, ease of use, and reliable signal
スイングトレーディング は、トレンドの方向のスイングと可能な反転スイングを検出するように設計された最初のインジケーターです。トレーディングの文献で広く説明されているベースラインスイングトレーディングアプローチを使用します。インディケータは、いくつかの価格と時間のベクトルを調査して、全体的なトレンドの方向を追跡し、市場が売られ過ぎまたは買われ過ぎて修正の準備ができている状況を検出します。 [ インストールガイド | 更新ガイド | トラブルシューティング | よくある質問 | すべての製品 ] むち打ちを起こさずに市場スイングの利益 インジケーターは常にトレンドの方向を表示します 色付きの価格帯は機会のベースラインを表します 色付きのダッシュは、可能な反転スイングを表します この指標は、独自の品質とパフォーマンスを分析します 複数時間枠のダッシュボードを実装します カスタマイズ可能なトレンドおよびスイング期間 電子メール/サウンド/プッシュアラートを実装します インジケータは再描画またはバックペインティングではありません Swing Tradingとは Swing Tradingは
Introduction to Fractal Pattern Scanner Fractal Indicator refers to the technical indicator that makes use of the fractal geometry found in the financial market. Fractal Pattern Scanner is the advanced Fractal Indicator that brings the latest trading technology after the extensive research and development work in the fractal geometry in the financial market. The most important feature in Fractal Pattern Scanner is the ability to measure the turning point probability as well as the trend probabil
作者のその他のプロダクト
Enigmera
Ivan Stefanov
5 (7)
ENIGMERA: 市場の中心 重要:MQL5.comのデモはStrategy Testerで実行されており、Enigmeraの機能を完全には反映していない場合があります。詳細については、説明、スクリーンショット、ビデオをご確認ください。質問があれば、遠慮なくメッセージを送ってください! インジケーターのコードは完全に書き直されました。バージョン3.0は新機能を追加し、インジケーターの開始以来蓄積されたバグを修正しました。 紹介 このインジケーターとトレーディングシステムは、金融市場への注目すべきアプローチです。ENIGMERAはフラクタルサイクルを使用して、サポートとレジスタンスのレベルを正確に計算します。真の蓄積フェーズを示し、方向と目標を提供します。トレンドでも修正でも機能するシステムです。 動作方法 インジケーターのほとんどの機能は、チャートの左側にあるボタンで制御され、市場の状況に迅速に対応できるようになっています。 ボタン ON/OFF – インジケーター全体を表示または非表示にします。 Channel – サポートチャネルを有効にし、許容範囲の偏差を示します。 Dev
ENIGMERA:マーケットの核 はじめに このインジケーターとトレーディングシステムは、金融市場に対する卓越したアプローチを提供します。ENIGMERA はフラクタルサイクルを利用してサポート(支持線)とレジスタンス(抵抗線)レベルを正確に計算します。真の蓄積フェーズを表示し、方向性とターゲットを示します。トレンド中でも調整局面でも機能するシステムです。 仕組み インジケーターの大部分の機能は、チャート左側のボタンで操作でき、市場状況に即座に対応できます。 ボタン ON/OFF – インジケーター全体の表示/非表示を切り替え。 Support – トレンドの主要サポートライン。 Ch – サポートチャネルを有効化し、許容できる乖離幅を示す。 Dev1(第1偏差) – サポート乖離内での価格変動を示し、市場のもみ合いまたは強さの蓄積を示唆。 Dev2(第2偏差) – 偏差間での価格変動を表示し、トレンドの形成および方向性を示唆。 Dev3(第3偏差) – トレンドの大きな加速と高いボラティリティを示す。 45deg(45度線) – 45度線に対する市場の速度と動きの安定性を示す。
価格のみに基づいてレベルを計算する、非常に珍しいインジケーターの一つです。このインジケーターは、時間足やトレンド、市場サイクルの影響を受けません。これまでに作られた中で最も論理的なインジケーターの一つです。 FIFTY インジケーターは、現在自動化バージョンとして登場し、レベルを手動で描画する必要がなくなりました。このバージョンでは、日足・週足・月足・年足のレベルが自動でチャートに描画され、正確さと時間の節約を実現します。さらに、各レベルの表示を切り替えるためのボタンも用意されており、完全にカスタマイズが可能です。手動を好む方のために、無料版も引き続き利用可能で、十分に機能します。トレーダーは自分の取引スタイルに応じて、手動と自動のツールを選ぶことができます。 非常に信頼性が高く、強くおすすめします!手動版の FIFTY インジケーターをご希望の方は、お問い合わせください
Sense
Ivan Stefanov
5 (2)
SENSEは、厳選されたGANN手法とフラクタル計算を組み合わせた自動システムです。このシステムは、どこで取引を開始し、どこで決済するかを教えてくれます。もう複雑な計算に時間を費やす必要はありません。インジケータをインストールするだけです。 基本原則: 価格が白い線の上にある時、市場は強気である。 白い線の上で買い、下で止める 緑線は上値目標 白い線より下にあるときは弱気。 白い線より下で売り、上で止める。 赤線は下値目標 緑または赤の線が二重になっている場合は、強いエリアであることを示す。 なぜSENSEなのか? 利益目標 SENSEは自動的に利益確定のターゲットを設定し、取引の成功を最大化するお手伝いをします。 自動適応: このインディケータは、どのような時間枠に対しても自動的に再計算を行い、手動で調整する必要なく、正確で信頼性の高いシグナルを提供します。 スキャルピングにも最適です。 デモをチェック
2 SNAKES  is a first class scalping system. As the entries are quite precise, you are likely to become addicted to this system very quickly.  You have 2 snakes. When you see a candle above or below them that does not touch them - that is your scalping signal. Then buy or sell at the green line or close. If you use a larger time frame, scalping can become trend following. The snakes are calculated precisely in relation to the current state of the market. They ARE NOT moving averages.  You decide
このインディケータは、選択した期間における強気と弱気の不均衡を測定し、2 点間の直線を示す。 強気派が弱気派より出来高が多ければ、線は緑色に変わる。 ベアの方が出来高が多い場合、線は赤になる。 線は、出来高の差のパーセンテージも示します。 このインジケーターは、同じデータを別ウィンドウで表示します。また、分割された出来高を見ることもできます。 このインジケーターには2つのモードがあります。 そのために、左上にボタンがあります、  - ボタンを押さなければ、市場の任意のポイントと現在の価格との間の不均衡を測定します。 - ボタンを押すと、市場の任意の2点間のバランスを測定できます。 このインディケータは、選択した期間における強気と弱気の不均衡を測定し、2 点間の直線を示す。 強気派が弱気派より出来高が多ければ、線は緑色に変わる。 ベアの方が出来高が多い場合、線は赤になる。 線は、出来高の差のパーセンテージも示します。 このインジケーターは、同じデータを別ウィンドウで表示します。また、分割された出来高を見ることもできます。 このインジケーターには2つのモードがあります
このインジケーターは、各ポイントのボリュームを分析し、そのボリュームに対する市場の疲労レベルを計算します。 インジケーターは3本のラインで構成されています: 強気のボリューム疲労ライン 弱気のボリューム疲労ライン 市場のトレンドを示すライン。このラインは、市場が強気か弱気かに応じて色が変わります。 任意の開始点から市場を分析できます。一度ボリューム疲労ラインに達したら、次の分析を開始するための新しいポイントを設定してください。 トレンドや修正を分析できます。良いアプローチは、トレンドラインに達したときや、トップやボトムがヒットしたときにインジケーターを移動させることです。 トレンドラインとボリューム疲労ラインの距離が大きいほど、その方向のボリュームは大きくなります。 トレンドラインはオーダーを開く場所として使用でき、疲労ラインは利益を取るために使用されます。 このシステムは非常にユニークですが、非常に直感的でもあります。 市場には同様の製品はありません。 使用に制限はありません。すべての市場およびすべての時間枠で適用できます。 重要:MetaTrader4のテスターで確認する際は、紫色
GANNの正確な目標は、彼の時代を超えた方法に基づいて計算され、目の前に提示されます。このツールは、取引をよりスムーズで直感的にするために設計されています。白いラインを上に、または緑のラインを下に動かすことで、なぜGANNの技法が取引の世界で今なお影響力を持っているのかがすぐにわかるでしょう。 GANNの戦略は、市場の動きを高精度で予測することに焦点を当てており、このツールはその力をあなたの手元に提供します。経験豊富なトレーダーであっても、初心者であっても、ラインを操作することで、彼の手法がなぜ時の試練に耐えてきたのかを深く理解することができるでしょう。 GANNの正確な目標は、彼の時代を超えた方法に基づいて計算され、目の前に提示されます。このツールは、取引をよりスムーズで直感的にするために設計されています。白いラインを上に、または緑のラインを下に動かすことで、なぜGANNの技法が取引の世界で今なお影響力を持っているのかがすぐにわかるでしょう。 GANNの戦略は、市場の動きを高精度で予測することに焦点を当てており、このツールはその力をあなたの手元に提供します。経験豊富なトレーダーであっ
この指標は実際の経験に基づいている。 トップ/ボトムの日付/時刻を入れてください。 トップ/ボトムから現在までの最も訪問されたレベルを計算します。 ローソク足が更新されるたびに自動的に更新されます。 異なるトレンドと時間枠の複数のインディケータを同時に使用することができます。 長さは常にあなたの期間の開始から現在にプロットされます。 便利なPROツール。 この指標は実際の経験に基づいている。 トップ/ボトムの日付/時刻を入れてください。 トップ/ボトムから現在までの最も訪問されたレベルを計算します。 ローソク足が更新されるたびに自動的に更新されます。 異なるトレンドと時間枠の複数のインディケータを同時に使用することができます。 長さは常にあなたの期間の開始から現在にプロットされます。 便利なPROツール。
FREE
FIFTYインジケーターは、手動でレベルを描画する必要がない自動バージョンを提供するようになりました。このバージョンでは、日次、週次、月次、年次のレベルが自動的にチャート上に描画され、精度を確保しながら時間を節約できます。さらに、これらのレベルの表示を切り替えるボタンが用意されており、完全なカスタマイズが可能です。手動操作を好む方のために、無料版のインジケーターも引き続き利用可能で、完全な機能を備えています。トレーダーは、自分の取引スタイルに応じて手動ツールと自動ツールを選択できます。 最も論理的なインジケーターの一つ。 高い信頼性。 FIFTYインジケーターは、手動でレベルを描画する必要がない自動バージョンを提供するようになりました。このバージョンでは、日次、週次、月次、年次のレベルが自動的にチャート上に描画され、精度を確保しながら時間を節約できます。さらに、これらのレベルの表示を切り替えるボタンが用意されており、完全なカスタマイズが可能です。手動操作を好む方のために、無料版のインジケーターも引き続き利用可能で、完全な機能を備えています。トレーダーは、自分の取引スタイルに応じて手動ツ
このインディケータは、外為市場のティックボリュームを強気と弱気に効果 的に分けます。  さらに、選択した任意の期間の強気と弱気のティックボリュームの合計を計算し、表示する機能を提供します。  チャート上の2本の青い線を動かすことで簡単に期間を調整でき、お客様の取引ニーズに合わせたカスタマイズ可能で正確な出来高分析が可能です。  もしお役に立つようでしたら、レビューをお寄せください!  それでは、良いお取引を! このインディケータは、外為市場のティックボリュームを強気と弱気に効果 的に分けます。 さらに、選択した任意の期間の強気と弱気のティックボリュームの合計を計算し、表示する機能を提供します。 チャート上の2本の青い線を動かすことで簡単に期間を調整でき、お客様の取引ニーズに合わせたカスタマイズ可能で正確な出来高分析が可能です。 もしお役に立つようでしたら、レビューをお寄せください! それでは、良いお取引を!
FREE
Levelss
Ivan Stefanov
5 (1)
LEVELSSインディケータが示す: - 日足の強気ゾーンと弱気ゾーン。毎日00:00から23:59まで表示。 - 週足の強気・弱気ゾーン。毎週月曜日0:00から金曜日23:59まで表示されます。 - 特定のタイムフレームから特別に計算されたチャネルで、他のすべてのタイムフレームに表示されます。デフォルトでは、これは4時間のタイムフレームで、取引したい他のタイムフレームに変更することができます。これはノンストップで計算されます。 画面の左上には、ゾーンとチャネルが強気、弱気、中立のいずれであるかが表示されています。この3つすべてが強気の場合、現在のローソク足に緑の点が表示されます。3つとも弱気の場合、ピンクの点が表示されます。 このインディケータに制限はありません。
フィルタ:
Mase
1679
Mase 2025.05.29 14:17 
 

Simply perfect! In combination with Ivan's other technical indicators, it is a powerful tool. Warning: highly addictive, as the indicators bring so much joy and success. Highly recommended.

レビューに返信
バージョン 2.58 2025.05.30
Minor improvement.
バージョン 2.57 2025.05.30
A new button has been added that allows you to hide all labels, making the chart cleaner.
バージョン 2.54 2025.05.29
- New S/R Button Added
The indicator now continuously calculates support and resistance levels. The larger the number displayed on the line, the more times that level has been tested.

- Calendar Enhanced with Date Functionality
You can now select and analyze specific days individually, enabling more precise and targeted analysis.

バージョン 2.52 2025.05.24
- Added button for MANUAL MODE
- Other minor changes
バージョン 2.51 2025.05.22
Algo improved
バージョン 2.50 2025.05.22
Algo updated.
バージョン 2.20 2025.05.20
Zones recognized much better.
バージョン 2.0 2025.05.19
Big volume colored candles.
Zones with dash lines.
バージョン 1.80 2025.05.15
Auto mode added. Improved logic.
バージョン 1.60 2025.05.14
Many improvements.
バージョン 1.20 2025.05.13
A calendar has been added directly to the chart. You can quickly compare different periods of time.