• 概要
  • レビュー (16)
  • コメント (24)
  • 最新情報

Weis Wave with Alert MT5

5

Rental/Lifetime Package Options and Privileges 


Rent Monthly Six Months   Yearly/Lifetime
Weis Wave with Speed with Alert+Speed Index
x
x
x
Manual 
x
x
x
Quick Set up Video
x
x
x
Blog
x
x
x
Lifetime Updates
x
x
x
Setup and Training Material
x
x
Discord Access Channel "The SI traders"          x
Rectangle Break Alert Tool     
x


How to trade with it:   http://www.tradethevolumewaves.com 

** If you purchase please contact me to setup your  : Two hour  webinar and  training Room and  complete manual access. 


Weis Wave with Alert MT5

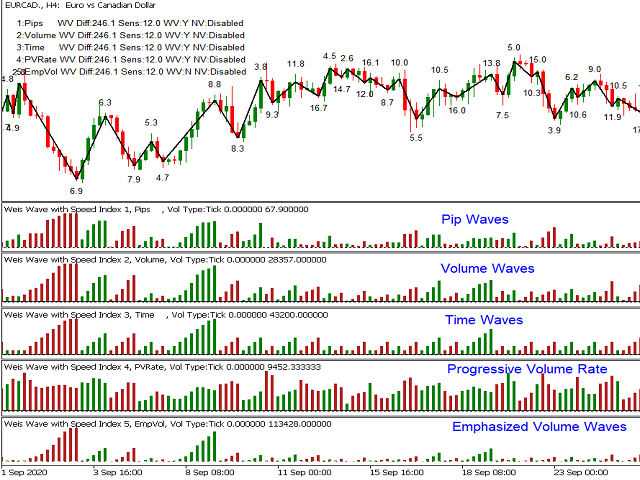
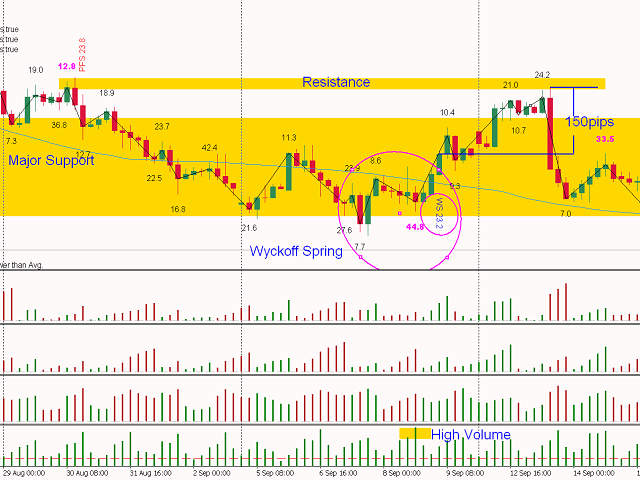
This is a Weis Wave indicator which is based on Richard D. Wyckoff theory. It works in all time periods, range bar and tick bar charts and it can be applied to any market.

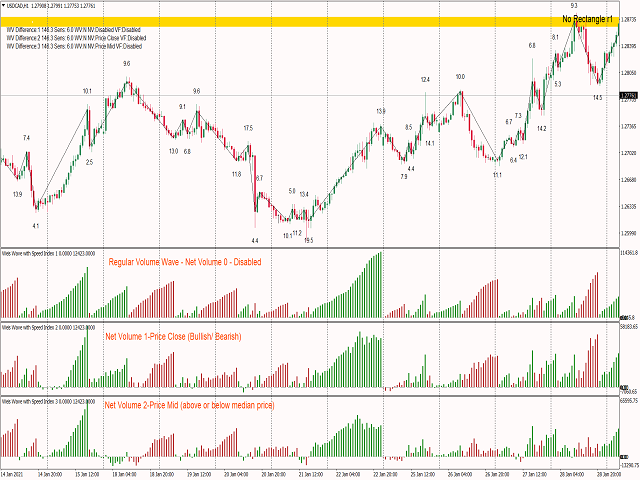
This indicator is an evolution of Weis Wave because it offers the autowaves feature, five different wave types as well as the powerful Speed Index.  Each price wave is moving in a specific direction up or down until it reverses. In order for the indicator wave to reverse in the opposite direction, the price should exceed the number of points (pip*10) set in the parameters. Therefore, the last wave repaints but the theory behind this trading method is forecasting where the market will go by reading  the previous waves.


Trading Strategies: www.tradethevolumewaves.com Setup Parameters
  • Indicator Number: Multiple Indicators can be added on the same chart. Valid values "0 to 9" and "a-z"
  • Show Orders: display or not your orders
  • Load all Bars: true/false, if false Number of bars back will be loaded
  • Number of bars back: numbers of bars that the indicator will load
  • Wave Direction Change difference in Points: Number of points required for the current wave to reverse and form a new wave
  • AutoDifference: true/false - Neglects the Wave Direction difference  and adjusts the Difference automatically creating more accurate waves.
  • AutoSensitivity: The higher the number the higher the sensitivity and therefore more waves are formed.
  • Volumetype= true=Tick Volume, false=Real Volume
  • Weighted Volume: true/false - Weights volume of  different sessions taking into consideration that when London and US are operating at same time have the highest volume of all sessions occurs and adjusts the rest of the sessions. With this parameter it very easy visualize which volumes are significant even on Asian hours or non-significant on London-US hrs.
  • Net Volume: 0-Disabled, 1-Price Close, 2 Price Median
  • Wave Type: 0-Regular Volume, 1-Pips, 2-Progressive Volume Rate, 3-Time,4 Emphasized Volume Waves, 5 Inverse Progressive Pip Rate
Speed Index Display and Alert Parameters
  • SI Display: Show or not speed index on the chart 0-No Display, 1 Speed Index only, 2 Volume and Speed Index, 3 Speed Index and Average Speed Index, 4 Speed Index and Wave speed (Fast or SLow)
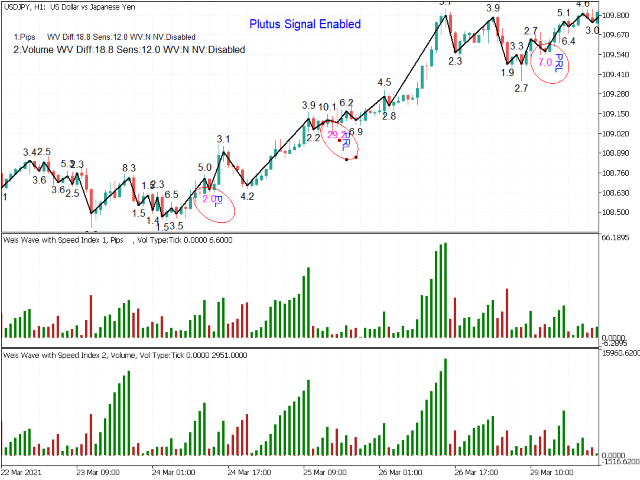
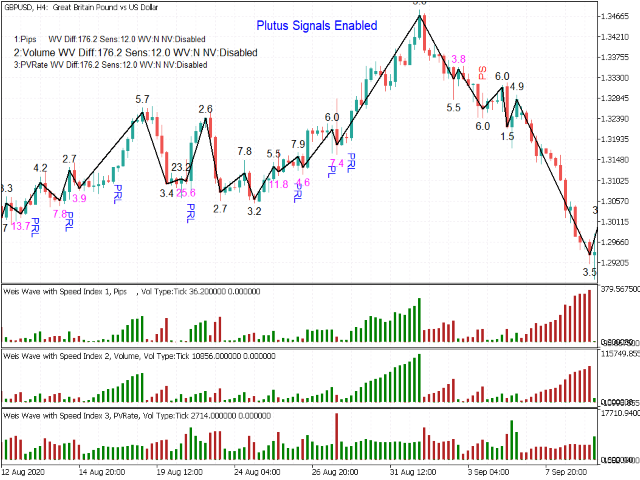
  • Show Plutus Patterns or Not
  • Alert on Plutus Patterns: Popup, Sound, Email, Push Notification
  • SpeedAlert: There are two ways that you can be notified for Extreme Speed Index numbers the Automatic and the Manual, please refer to the manual for explanations.
    • Alerts :Popup, Sound, Email, Push

Format Wave and Label
  • ShowLabels: Display or not the wave type the pips and the number of bars of each wave
  • What to Display:1-Volume,2-Pips, 3-Bars, 4-All, 5-Volume and Pips
  • ShowWaveLine: Draw the wave line or not on the price chart
  • Format: LabelShift, Font size, Color Up, Color Dn, wave color, wave width

Volume Alert The information displayed by the alert function are: the pair, the period, a message “High Down Volume” or “High Up Volume” and the time.
  • Volume Alert Above this limit: The value of cumulative volume that will be triggered if the alert is exceeded
  • Alerts: Popup, Sound, Email, Push
Format Numbers for better display parameters
  • VolDivBy: Volume divider in order to avoid big numbers on the display
  • PipDivBy: Pip distance  divider in order to avoid big numbers on the display
  • SI Multiplier: Speed Index Multiplier for better display
  • Reverse Style: inverts wave style


レビュー 16
Mr_Corazon
59
Mr_Corazon 2024.03.10 09:28 
 

I read a book by David Weis and watched a video of his, from there I found this product which has been developed by Takis. He is passionate about what he has created and he is generous with his offering of expertise and more importantly he is generous with his time. It looks very complicated but its quite simple in essence and time spent with the creator and programmer himself was a pleasure. Thank you for everything so far Takis. And here is to a plentiful 2024

TruthMV
49
TruthMV 2023.06.03 00:23 
 

I just want to say thank for sharing your experience in putting together the "Weis Wave with Speedy Index Indicator". Using the Wyckoff Method, David Weis's Wave theory with Forex all in one. I would say it's not really a indicator, it's a way to read the charts for your self and not dependent on a line crosses this line or candle crossed a MA. I've been searching for many years trying to find some sort of logical process and common denominator in trading, I've spent thousands on all sort of esoteric books, platforms, data feeds etc. and was almost ready to quit, thinking I'm not smart enough to figure all this out. I've been applying the, "Trade The Volume Wave Method" for only three months, but I've had more consistent results and the confidence in what I'm learning will work. Even though I've made mistakes, now I know why and learn from them. Also, thanks for offering a two hour training session for free, for now, to get me up and running and the Discord Channel where we can discuss potential trades. Thank you Panagiotis (Takis) for giving all of us retail traders peace of mind and hope. Mark USA

mistaeff
159
mistaeff 2023.01.05 22:15 
 

Throughout my time using the MQL5 platform, I have never come across anyone who is more devoted to the success of their customers. The developer is a great guy, he spends hours sharing his knowledge and is a successful professional trader in his own right. He has developed a personal trading system, along with a pretty unique indicator that will enable you to consistently profit in the forex markets. I would highly recommend this product, whether you are starting a brand new strategy or even adding additional verifications to an existing strategy.

おすすめのプロダクト
Limitless MT5 is a universal indicator suitable for every beginner and experienced trader. works on all currency pairs, cryptocurrencies, raw stocks Limitless MT5 - already configured and does not require additional configuration And now the main thing Why Limitless MT5? 1 complete lack of redrawing 2 two years of testing by the best specialists in trading 3 the accuracy of correct signals exceeds 80% 4 performed well in trading during news releases Trading rules 1 buy signal - the ap
RAD CRITICAL LEVES RAD indicator tracks “Relevant Volume” in real time, identifying accumulation and distribution processes, projecting them in the chart as SUPPORT or RESISTANCE zones. Natural   support   and resistance levels are generated by Volume Accumulation and Distribution processes. As these processes evolve, levels at which the relevant volume in the market place is positioned, become difficult areas to cross upwards or downwards. By using this information, traders can identify very s
FDIS v1.08 is a multi-layered trend and signal indicator designed to offer precise insight into market direction, volatility, and momentum. Combining the power of RSI smoothing, volatility bands, and signal cross alerts, FDIS helps traders make faster and more informed decisions. Core Features: Green Line : Smoothed RSI (RSI Price Line) Red Line : Trade Signal Line Orange Line : Market Base Line (dynamic support/resistance) Blue Bands : Volatility Zones (standard deviation-based) Mu
Our BOOM SELL ALERT indicator is specifically engineered to   take candles on BOOM 1000 , BOOM 500 is tool is optimized for M1 (1-minute) timeframe, ensuring you receive timely and actionable insights.   The indicator is a combination of   many indicators. -        AO Oscillator -        Stochastic   HOW TO USE THIS INDICATOR To use well this indicator , it   need to use SCHAFF TREND RSX ( 5 MIN OR M5) IF SCHAFF trend RSX is GREEN and you have a signal then SELL when you have ENTRY and out with
The Smooth Price technical indicator is used for plotting a smoothed line as close to the price of the financial instrument as possible, and serves to eliminate its noise components. The indicator is part of the Monarch trading system, but here it is presented as an independent technical analysis tool. The indicator is based on the cluster digital filter , which, unlike the ClusterSMA , is applied directly to the price time series. Smooth Price does not redraw (except the very last, zero bar) an
The Tik Tok indicator was created on the basis of the original extreme search indicators, the indicator is well suited for determining a reversal or a big sharp jerk in one direction, thanks to it you will know when this happens it will notify you when a blue dot for buying red for sale appears. It basically uses the process of detecting the rate of change in price growth and allows you to find entry and exit points from the market. fundamental technical indicator that allows you to assess the
Do you use volume in your reading of the market? Certainly many traders use it, and do not imagine operating without it. The Color Histogram Volume Set indicator allows the user to choose the value that he considers interesting to monitor. When you pass this you will have visual confirmation and if you want you will also have the audible alert that is given by the indicator. Of course, there are other ways to try to find a high volume, such as assessing whether the volume is above av
The latest most requested Binary Options arrow indicator in the Garuda Signals product line is now on MT5! Binary options signal based on multiple time frame cross over analysis. Gets confirmation from the most consistent signals known to man; Ichimoku, SMA, Bollinger Bands; and also uses the 1 Hour time frame as trend confirmation , so you don't have to open up multiple chart and waste time. - Can be used for all time frames up to 1 hour, but is most POWERFUL for 1 and 5 min options. - Place yo
SYSTEM INTRODUCTION:   The Binary Options Momentum System Is Specifically Designed For Binary Options Trading. Unlike Other Systems And Indicators That Were Adopted From Other Trading Environments For Binary Options. Little Wonder Why Many Of Such Systems Fail To Make Money . Many End Up Loosing Money For Their Users.  A Very Important Fact That Must Be Noted Is The Fact That Application Of Martingale Is not Required. Thus Making It Safer For Traders Usage And Profitability. A Trader Can Use Fi
Ultra AS MT5
Yaroslav Varankin
3 (2)
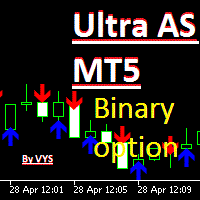
The indicator is designed for binary options trading. The "period" parameter can be adjusted to fit your trading strategy, allowing you to customize the number and quality of signals. A red arrow pointing down indicates a sell signal, while a blue arrow pointing up indicates a buy signal. Recommended expiration time is one candle. You can enter a trade either when the signal appears or on the next candle. Attention: the signal may sometimes disappear on the current candle, so it's important to
The Plasma Trend indicator is a simple technical indication that is used to determine the current trend direction in the market. The Plasma Trend indicator is a powerful tool for determining the direction of the trend in the Forex market. It is based on both standard technical indicators and proprietary mathematical calculations, which provides a more accurate and reliable trend determination. Its implementation in the form of lines of two colors simplifies the visual determination of a change
MarketMagnet
Kelly Adediran Raymond
Are you ready to take your trading journey to new heights? Look no further than MarketMagnet, this groundbreaking indicator designed to propel your trading success with excitement and accuracy. Powered by the convergence of Momentum and CCI (Commodity Channel Index), MarketMagnet equips traders with the ultimate tool to determine direction and entry prices for a wide range of recommended currency pairs and instruments. It is designed for traders seeking to scalp for a few pips on lower timeframe
VeMAs インジケータは、出来高動態と市場構造を分析することにより、あなたの取引戦略を強化するために設計された革新的な取引ツールです。 あなたが初心者であろうと経験豊富なトレーダーであろうと、VeMAs はあなたに優位性を与えます。 インジケーター VeMAs が 50 $ ドルで入手可能。オリジナル価格 299 $ を期間限定でご提供。 購入後、私に連絡して、個人的なボーナスを入手してください! VeMAs インジケータをマルチタイムフレームにするクールなユーティリティ( VeMAs ユーティリティ MTF )を無料で入手できます! Version MT4 Here are some blogs on the VeMAs indicator 市場の出来高と構造は、注視すべき数少ない主要な事柄である。 VeMAsは、出来高の変化と価格の動きを評価するために高度なアルゴリズムを使用しています。正確性と効率性を求めるトレーダーのために設計されています。 このインディケータは、資産の出来高の値動きを分析し、理想的なエントリーポイントを特定します。 正確なエントリーポイントにより
Naked Forex Kangaroo Tail Indicator Kangaroo Tail Indicator is a pattern recognition indicator for Forex, Stocks, Indices, Futures, Commodities and Cryptos. The Kangaroo Tail is a multi-bar pattern. The Kangaroo Tail pattern is very effective and is very simple to trade. The strategy that comes with the Kangaroo Tail is based on price action. The indicator does what it was designed for: displaying Kangaroo Tail patterns.   Don't expect to follow the up and down arrows and make money . Tradin
Price action is among the most popular trading concepts. A trader who knows how to use price action the right way can often improve his performance and his way of looking at charts significantly. However, there are still a lot of misunderstandings and half-truths circulating that confuse traders and set them up for failure. Using PA Trend Reversal will be possible to identify high probability exhaustion moves of a trend. Features The indicator gives alerts in real-time when the conditions are me
ZigZag SMC Premium MT5
Kallebe Lins De Oliveira Santos
If you are looking for precision in identifying strategic tops and bottoms, the ZigZag SMC/SMT Indicator for MT5 is the tool that will contribute to your technical analysis. Developed based on the advanced concepts of Smart Money Concepts (SMC) and Smart Money Trap (SMT), it offers an insight into market behavior, helping you make decisions. What will you find in this indicator? Automatic identification of strategic tops and bottoms Based on institutional strategies Ideal for analyzing liqu
Trend indicator, a revolutionary unique solution for trend trading and filtering with all important trend features built into one tool! This is a 100% non-repainting multi-timeframe and multi-currency indicator that can be used on all currency pairs. HandleTrend is an effective trend following indicator that gives trend signals in the form of arrows on the chart.
Supply and Demand Monster
Tsog Erdene Borjigon Enkhkhudulmur
Supply and demand zones are at the heart of   supply and demand trading . These zones are areas that show  liquidity at a specific price.  The supply zone is also called the distribution zone, while the demand zone is called the accumulation zone.   Our indicator automatically draw supply and demand zones in Metatrader 5. It give opportunity to understand trading zone and avoiding risk.
To download MT4 version please click here . - This is the exact conversion from TradingView: "Trend Direction Force Index - TDFI [wm]" By "causecelebre". - The screenshot shows similar results from tradingview and Metatrader when tested on ICMarkets on both platforms. - This indicator uses multiple levels of averaging to detect trend strength. - You can optimize filter low and filter high levels to achieve best results. - You have access to buffers to use in EAs. - This is a light-load processin
Lorentzian AI
Michael Prescott Burney
5 (1)
The Lorentzian A.I Indicator System is designed to enhance trading strategies across Crypto, Indices, Forex, and Stocks by utilizing adaptive algorithms and real-time market analysis. It applies Lorentzian Classification to generate buy and sell signals while integrating K-Nearest Neighbors filtration for data normalization and improved signal reliability. Neural network processing incorporates multidimensional signals with time-space calculations to refine trend forecasting. The system continu
FREE
A powerful oscillator that provide Buy and Sell signals by calculating the investor liquidity. The more liquidity the more buy possibilities. The less liquidity the more sell possibilities. Please download the demo and run a backtest! HOW IT WORKS: The oscillator will put buy and sell arrow on the chart in runtime only . Top value is 95 to 100 -> Investors are ready to buy and you should follow. Bottom value is 5 to 0 -> Investors are ready to sell and you should follow. Alert + sound will appe
当社の製品を使用する前に、英語の免責事項を注意深くお読みください。当社の製品は、市場の潜在的なトレンドや価格の動きに関する情報を提供するために設計されています。しかしながら、当社の製品を利用することによって特定の結果を保証することや、利益を保証することはできません。金融市場取引にはリスクが伴いますので、慎重にご判断いただき自己責任でご利用いただくようお願い申し上げます。詳細については、英語の免責事項をご参照ください。 当社の製品を使用する前に、英語の免責事項を注意深くお読みください。当社の製品は、市場の潜在的なトレンドや価格の動きに関する情報を提供するために設計されています。しかしながら、当社の製品を利用することによって特定の結果を保証することや、利益を保証することはできません。金融市場取引にはリスクが伴いますので、慎重にご判断いただき自己責任でご利用いただくようお願い申し上げます。詳細については、英語の免責事項をご参照ください。
Forex Relative Performance indicator This indicator calculates the relative strength of major currencies against the US dollar. The basic idea behind this indicator is "to buy strong currency and to sell weak currency". This indicator allows you to quickly identify the best forex pair to trade according to your trading style (Intraday, Scalping, Swing, or Long Term)
Binary Options Assistant (BOA) BOIL Signals Indicator provides signals based on Ana Trader Binary Options Strategy. Indicators: Stochastic Stop missing trades, stop jumping from chart to chart looking for trade set-ups and get all the signals on 1 chart! U se any of the BOA Signals Indicator with the  Binary Options Assistant (BOA) Multi Currency Dashboard .  All BOA Signal Indicator settings are adjustable to give you more strategy combinations. The signals can be seen visually and heard audi
Range Directional Force Indicator – Designed for You to Optimize! The Range Directional Force Indicator is a cutting-edge tool designed to empower traders by visualizing market dynamics and directional strength. Built to offer insights into market trends and reversals, this indicator is an invaluable asset for traders seeking precision in their strategies. However, it is important to note that this indicator is not optimized, leaving room for you to tailor it to your unique trading preferences.
Bonjour cette vente nous vous apportera rien elle a juste pour but de récupérer des fond d’un broker malhonnête je n’ai rien à vendre ni à promouvoir bon trade à tous et passez votre chemin. Je doit continuer d’écrire pour valider les 300 caractères mais vraiment n’attendez rien de ce système , un groupe de personne c’est fait arnaquer par un broker qui ne veut pas valider de retrait alors je vais récupérer les fond différents mêmes s’il faut s’assoir sur une jolie Com’ prise par Mql5
A scalping indicator based on mathematical patterns, which on average gives signals with relatively small SL, and also occasionally helps to catch big moves in the markets (more information in the video) This indicator has three main types of notifications: The first type warns of a possible/upcoming signal on the next bar The second type indicates the presence of a ready signal to enter the market/open a position The third type is for SL and TP levels - you will be notified every time price re
Hello There, Today I want to show you my new researchable fore BUY SELL indicator, it work all asset, and also work Derive Volatility asset! it work all time frame, but i recommend start 5 minute to H1 when you receive a signal just take trade and stay wait for your take profit asset All Major Pair And minor IT WORK ALSO XAUUSD Fantastic results,  for more info,,, message us thank you   
Hello There, Today I want to show you my new researchable fore BUY SELL indicator, Golden Scalp System v2 it work all asset, it work all time frame, but i recommend start 5 minute to H1 when you receive a signal just take trade and stay wait for your take profit asset All Major Pair And minor IT WORK ALSO XAUUSD Fantastic results,  for more info,,, message us thank you 
SYSTEM INTRODUCTION:   The Binary Options Conqueror System Is Specifically Designed For Binary Options Trading. Unlike Other Systems And Indicators That Were Adopted From Other Trading Environments For Binary Options. Little Wonder Why Many Of Such Systems Fail To Make Money . Many End Up Loosing Money For Their Users.     Forward Testing Of The System Has Shown Remarkable Results . The Results Of Forward Testing On Live Trading Account Is Consistent With The Results Obtained By Back Testing .
このプロダクトを購入した人は以下も購入しています
ENIGMERA:マーケットの核 はじめに このインジケーターとトレーディングシステムは、金融市場に対する卓越したアプローチを提供します。ENIGMERA はフラクタルサイクルを利用してサポート(支持線)とレジスタンス(抵抗線)レベルを正確に計算します。真の蓄積フェーズを表示し、方向性とターゲットを示します。トレンド中でも調整局面でも機能するシステムです。 仕組み インジケーターの大部分の機能は、チャート左側のボタンで操作でき、市場状況に即座に対応できます。 ボタン ON/OFF – インジケーター全体の表示/非表示を切り替え。 Support – トレンドの主要サポートライン。 Ch – サポートチャネルを有効化し、許容できる乖離幅を示す。 Dev1(第1偏差) – サポート乖離内での価格変動を示し、市場のもみ合いまたは強さの蓄積を示唆。 Dev2(第2偏差) – 偏差間での価格変動を表示し、トレンドの形成および方向性を示唆。 Dev3(第3偏差) – トレンドの大きな加速と高いボラティリティを示す。 45deg(45度線) – 45度線に対する市場の速度と動きの安定性を示す。
This indicator is based on the mathematics of the great trader W.D. Ganna. With its help, you can easily find strong levels by analyzing swings to find the optimal entry point. The indicator works on all instruments and all timeframes. The indicator is fully manual and has control buttons. All you need to do is press the NEW button, a segment will appear, which you can place on any movement, swing or even 1 candle that you want to analyze. By placing the segment, press the OK button. A grid (th
The indicator is designed to work on any trading platform. The program is based on proprietary algorithms and W.D.Ganna's mathematics, allowing you to calculate target levels of price movement based on three points with the highest degree of certainty. It is a great tool for stock trading. The indicator has three buttons: NEW - call up a triangle for calculation. DEL - delete the selected triangle. DELS - completely remove all constructions. The probability of achieving the goals is more than 80
NOTE: CYCLEMAESTRO is distributed only on this website, there are no other distributors. Demo version is for reference only and is not supported. Full versione is perfectly functional and it is supported. CYCLEMAESTRO , the first and only indicator of Cyclic Analysis, useful for giving signals of TRADING, BUY, SELL, STOP LOSS, ADDING. Created on the logic of   Serghei Istrati   and programmed by   Stefano Frisetti ;   CYCLEMAESTRO   is not an indicator like the others, the challenge was to inter
IVISTscalp5
Vadym Zhukovskyi
5 (6)
iVISTscalp5インジケーターをご紹介します。このインジケーターは、トレーディングにおいて独自でありながら効果的です。時間データに基づくこのインジケーターは、多年にわたる経験と金融市場の深い分析の結果です。iVISTscalp5インジケーターは、手動トレーディングにとって優れたツールです。便利さ、簡単さ、可視化 - すべての複雑さが内部に隠されています。私たちは、iVISTscalp5インジケーターの設定と使用を最大限に簡素化しました。このインジケーターは、MT5ターミナルにあるすべての金融商品に適しています。 稼働時間は、4時から20時(UTC+3)です。 iVISTscalp5インジケーターメニュー(スクリーンショット1を参照): History - 引用を計算する週数 dT_min - 時間間隔の選択(分) TFline - 水平ボリュームの作成(時間枠) BARSline - 水平ボリュームの作成(バー数) TFtrend1 - デイリーチャンネルの作成(時間枠) BARStrend1 - デイリーチャンネルの作成(バー数) TFtrend2 - 週次チャンネルの作成(時
note: this indicator is for METATRADER4, if you want the version for METATRADER5 this is the link:  https://www.mql5.com/it/market/product/108106 TRENDMAESTRO ver 2.4 TRENDMAESTRO recognizes a new TREND in the bud, he never makes mistakes. The certainty of identifying a new TREND is priceless. DESCRIPTION TRENDMAESTRO identifies a new TREND in the bud, this indicator examines the volatility, volumes and momentum to identify the moment in which there is an explosion of one or more of these data a
Pro Thunder V10: バイナリーオプション取引の究極のインジケーター! Pro Thunder V10 で取引を次のレベルへ引き上げましょう!最先端の ニューラルネットワークAI技術 に基づいたこの革新的なインジケーターは、比類のない精度と信頼性を提供するよう設計されています。リアルタイムの非リペイント信号から、変動する市場条件でもシームレスなパフォーマンスまで、 Pro Thunder V10 はあなたの取引における究極のパートナーです。 主な特徴: 圧倒的な精度: 高精度の信号で市場を制覇。重要なニュースイベントを含むあらゆる市場状況で実証済み。 OTC対応: OlympTrade、Pocket Option、Quotex、Binomo、IQ Option などのプラットフォームで完璧に動作。 MT5専用: 最も先進的な取引プラットフォームである MetaTrader 5 のために特別に設計されています。 パフォーマンスダッシュボード: 勝敗や信号を直感的に追跡できる使いやすい画面。 永久アクセス: 一度の購入で、すべてのアップデートに生涯アク
CBT Quantum Maverick 高効率バイナリーオプション取引システム CBT Quantum Maverickは、高いパフォーマンスとシンプルさを追求するトレーダー向けに設計されたバイナリーオプション取引システムです。カスタマイズの必要がなく、最適化された状態で使用を開始できます。シグナルに従うだけで、少しの練習でマスターできます。 主な特徴: シグナルの精度: 現在のローソク足を基に次のローソク足の取引シグナルを生成し、頻繁な再描画がありません。 多様な市場対応: バイナリーオプション取引に特化し、さまざまなブローカーや資産クラスに対応しています。 対応可能: Deriv Synthetic Charts :すべてのタイムフレームで使用可能。 OTCチャート :Quotex、PocketOption、Binomo、Stockity、IQOption、Exnova、OlympTrade、Deriv、Binolla、Homebrokerなどのブローカーに対応。MT5へのインポートは最初の1週間無料、その後は有料サービス。 FX、仮想通貨、商品市場 :幅広い資産利用が可能
「この秘密のトレーディングツールはプロップ会社によって禁止されている(彼らはあなたに知られたくない!)」 EAなしで究極のトレーディング・エッジを発見!(トレーダーのために、トレーダーによって作られました。 ロボットではなく、純粋なトレーディング・パワーです。) 偽のブレイクアウト、突然の反転、市場操作に苦戦していませんか?この強力なトレーディングツールは、マーケットが速く動くときでも、レーザー精度のシグナルを提供します! --------------------------------------------------------------------------------------------------- 私のおすすめ:- 最高の電波強度設定 FXペア、金、指数、暗号通貨など、あらゆる種類のシグナルに対応。 ご希望のTFを選択し、バックテスト前に入力タブからシグナル値を変更してください。 >> ( 4または5 ) >> 1m / 5m / 15m / 30m / 1H / 4H の場合 >> (2または3) >>日足/週足/月足用 -----------------
WHY IS OUR FXACCCURATE LS MT5 THE PROFITABLE ? PROTECT YOUR CAPITAL WITH RISK MANAGEMENT Gives entry, stop and target levels from time to time. It finds Trading opportunities by analyzing what the price is doing during established trends. POWERFUL INDICATOR FOR A RELIABLE STRATEGIES We have made these indicators with a lot of years of hard work. It is made at a very advanced level. Established trends provide dozens of trading opportunities, but most trend indicators completely ignore them! The
トレンドを見極める。パターンを読む。エントリーのタイミングを掴む。 30秒以内の3ステップ!分析不要で簡単トレード — あなたのスマートアシスタントがワークフローを簡素化します チャートの過剰な情報にもう悩まされない。 スマートバイアス検出で自信を持ってトレード。 すべての通貨、暗号資産、株式、金属、指数、あらゆる時間足に対応。 クリックして実行するだけ — それだけで十分。 スピードと明快さを求める忙しいトレーダーに最適。 TPTSyncXは、 トレンド、パターン、 ローソク足のトリガー 分析を、洗練されたインテリジェントなビジュアルシステムとしてシームレスに統合する、強力なオールインワンMetaTrader 5インジケーターです。明確さ、正確さ、スピードを求めるトレーダー向けに設計されており、プライスアクション、構造的パターン、市場タイミングツールを組み合わせて、高確率のトレードセットアップを特定するのに役立ちます。 主な機能: スマートビジュアル表示: チャート上に価格構造パターンを自動的に描画し、高値更新(HH)、安値更新(LL)、高値切り下げ(LH)、安値切り上げ(HL)を
This indicator identifies and displays zones, as it were areas of strength, where the price will unfold. The indicator can work on any chart, any instrument, at any timeframe. The indicator has two modes. The indicator is equipped with a control panel with buttons for convenience and split into two modes. Manual mode: To work with manual mode, you need to press the NEW button, a segment will appear. This segment is stretched over the movement and the LVL button is pressed. The level is displayed
The   Time_Price_SQ9_Degree   indicator is based on the 9 Gann square. Using this indicator, you can identify strong time and price zones. The indicator displays the levels as a degree value. The degrees can be set in the settings. After launching, the MENU button appears. If it is highlighted, it can be moved to any point on the graph, and after double-clicking on it, it stops being highlighted and menu buttons appear. To hide the menu, just double-click on the button, it will become highlight
Viking_Strategy_Signal Indicator is a solution I offer to beginner, amateur, and professional traders. My scalping robot :  https://www.mql5.com/fr/market/product/133191  4 copies left the next price 699.99$ Final price 999.99$ By purchasing this indicator, you will first save time because it automatically analyzes the market based on Dow Theory and the Smart Money Concept (High (H), Low (L), Higher High (HH), Lower Low (LL), Break of Structure (BOS) to determine market structure and trend). It
This Indicator creates a heatmap based on depth of market of the current symbol or another symbol. Other symbol is useful when you trade futures market and a contract has 'mini' and 'full' split. For example, in Brazil (B3 - BMF&Bovespa), WDO and DOL are future Forex contract of BRL/USD (where 1 DOL = 5 WDO) and big banks work mostly with DOL (where liquidity is important). Please use with M1 timeframe , objects are too small to be displayed at higher timeframes (MT5 limit). The number of level
Hello I Want to introduce The Forex Buy Sell Arrow Premium MT5 i recently release this premium indicator! its 1000% Non Repaint Indicator, It Work Perfectly Well,, i tested it day by day, Just mind blowing Result,  Including Powerful trend Algorithm! How It Work? well, it work market trend formula, when trend Bullish Or when trend Bearish,  Recommend Timeframe M30, H1 it work all timeframe, and all currency pair, 100% non repaint, How to take signal From Forex Buy Sell Arrow Premium Ind
The Naveen Dynamic Square  MT5  is one of the best known  technical analysis tools  inspired  by WD Gann along with the Gann Fan and Gann Box. It is considered a cornerstone of his trading technique that is based on time and price symmetry. The Naveen Dynamic Square MT5   is a powerful tool in finance for determining support and resistance levels based on a stock's extreme price points. It works by extrapolating probable price levels from a central value, typically an all-time or cyclical high o
Reversal ALGO
Muhammad Abdullah Bhatti
Reversal Algo は、市場のトレンド転換点を特定するために設計された高度なテクニカル指標です。過去の価格データを詳細に分析し、トレンドの変化を示唆する重要な高値と安値を検出します。チャート上に明確な視覚シグナルを提供し、トレーダーが転換点となる可能性のある重要なエリアを特定できるようにします。 主な特徴 重要な価格レベルの検出: Reversal Algo は過去の価格データをスキャンし、市場ノイズを排除しながら、統計的に重要な高値・安値を特定します。 高度なノイズフィルター: ボラティリティに基づいたフィルターを使用し、小さな価格変動による誤ったシグナルを最小限に抑えます。 カスタマイズ可能なパラメータ: 感度や閾値を調整できるため、トレードスタイルや市場環境に応じて最適化が可能です。 強力なデータ分析: 過去の価格データを幅広く分析し、市場の動向を把握するための有益な情報を提供します。 仕組み 極値レベルの分析: 市場の高値・安値を詳細に評価し、ボラティリティ閾値を適用することで、重要な価格変動のみを抽出します。 シグナルの確認: 他のテクニカル指標(オシレー
Multi Currency Multi Time Market Scan Signals It is an Advanced multi-utility dashboard which works with full customization of signal settings and graphical interface. It works with Multi Symbols and Multi-Time frames from 1 SINGLE CHART TEMPLATE. It will automatically open the charts where the latest signals had formed- showing the important levels (Entry, Targets, Stop Loss) Many types of sorting methods for the scanner. A robust ENTRY based on  TREND OF MULTI-TIME FRAMES ( Complex Signals
Crash500 Spike Detector v1.0 Crash500 spike detector prints Down non repaint Arrow for catching crash spikes. It is suitable for 1M time frame for majorly crash500  When the Red arrow prints, it indicates high probability of crash spikes downwards. Its pretty straight forward since I designed it to follow strong trends.  Use default settings, however, you can change the color of your chart background as may be appropriate. The system uses mathematical approach in to display statistical data inf
Super Zone   For several years of observing the principles of the market, Super Zone worked, both then and now, because the indicator  allows you to see the trading range of the  week and even the month that major market participants use. It’s very easy to use, we work on H4 in the weekly range (  in the tester it doesn’t work in the demo mode  ) - we sell from the upper zones, we buy from the lower ones. It marks the zones from the beginning of the week (month) that are  not redrawn  , works on
TMA Channel is a price channel obtained through a special calculation method based on traditional TMA . The channel has upper, middle, and lower tracks . When the price approaches or exceeds the upper track, it is already in an overbought state, and attention should be paid to the situation of reversal and decline; When the price approaches or falls below the lower track, it is already in an oversold state, and attention should be paid to the situation of reversal and rise . The indicator will
Introduction to X3 Chart Pattern Scanner X3 Cherart Pattern Scanner is the non-repainting and non-lagging indicator detecting X3 chart patterns including Harmonic pattern, Elliott Wave pattern, X3 patterns, and Japanese Candlestick patterns. Historical patterns match with signal patterns. Hence, you can readily develop the solid trading strategy in your chart. More importantly, this superb pattern scanner can detect the optimal pattern of its kind. In addition, you can switch on and off individu
How to use Pair Trading Station Pair Trading Station is recommended for H1 time frame and you can use it for any currency pairs. To generate buy and sell signal, follow few steps below to apply Pair Trading Station to your MetaTrader terminal. When you load Pair Trading Station on your chart, Pair Trading station will assess available historical data in your MetaTrader platforms for each currency pair. On your chart, the amount of historical data available will be displayed for each currency pai
Happy entries
Godwill Fortune Otieno Juma
The  product gives optimized entries for 3min ,1 hr and day timeframes  Does well with indices  ASIAN- HK50 AND CHINA A50 USA-US30,US100,US500 GER40 ,UK100 For stocks trade with the day timeframes Happy Entry employs advanced algorithms and real-time data analysis to identify optimal entry points with unprecedented accuracy. Its adaptive nature allows it to seamlessly adjust to changing market conditions, ensuring you never miss out on profitable opportunities. Whether you're a beginner or seas
这个指标采用一种特殊的思路来指示市场方向,指标加载在一小时和15分钟图表效果最好。 当指标显示红色时,表明市场趋势为多头,绿色表明市场趋势为空头,黄色为不明确,此时应避免开单。 我们需要达成共识的一点是:市场行情是随机发展的,无法完全准确预测,我们能做的只有跟随,不和市场趋势对着干,才能做到顺势而为。 本指标就是在这个思路下研发的,紧紧跟随市场行情发展,确认行情展开了才会显示对应的颜色。跟随本指标,只需要按照指示操作即可。 长期跟随的情况下,交易绩效是很不错的。 另外一点:本指标更适合趋势性较强的品种,比如镑日,美日,黄金等。 依据本指标交易镑日的话,可以用在5分钟或15分钟周期,获利30个点离场是比较可行的。
VTrende Pro
Andrii Diachenko
5 (1)
VTrende Pro - MTF indicator for trend trading with a display panel for MT5 *** Videos can be translated into any language using subtitles (video language - Russian) Although the signals of the VTrende Pro indicator can be used as signals of a full-fledged trading system, it is recommended to use them in conjunction with the Bill Williams TS. VTrende Pro is an extended version of the VTrende indicator. Difference between Pro version and VTrende: - Time zones - Signal V - signal 1-2 waves -    S
XCalper TFO
Aecio de Feo Flora Neto
This oscillator was developed exclusively by xCalper in 2015 based on moving averages calculations to indicate and try predicting oversold and overbought levels. The fast line (white, by default) oscillates basically between values -0.5 (oversold) and +0.5 (overbought). Whenever this line crosses upward value -0.5, it means an oversold price level. When it crosses downward value +0.5, it means an overbought price level. When fast line crosses value 0.0 and returns, it is a strong pull-back indic
The Expert Advisor and the video are attached in the Discussion tab . The robot applies only one order and strictly follows the signals to evaluate the indicator efficiency. Pan PrizMA CD Phase is an option based on the Pan PrizMA indicator. Details (in Russian). Averaging by a quadric-quartic polynomial increases the smoothness of lines, adds momentum and rhythm. Extrapolation by the sinusoid function near a constant allows adjusting the delay or lead of signals. The value of the phase - wave s
Классификатор силы тренда. Показания на истории не меняет. Изменяется классификация только незакрытого бара. По идее подобен полной системе ASCTrend, сигнальный модуль которой, точнее его аппроксимация в несколько "урезанном" виде, есть в свободном доступе, а также в терминале как сигнальный индикатор SilverTrend . Точной копией системы ASCTrend не является. Работает на всех инструментах и всех временных диапазонах. Индикатор использует несколько некоррелируемых между собой алгоритмов для класси
作者のその他のプロダクト
Anchored VWAP with Alert MT5
Trade The Volume Waves Single Member P.C.
5 (1)
What is the Volume Weighted Average Price (VWAP)? The volume weighted average price (VWAP) is a trading benchmark used by traders that gives the average price an instrument has traded at throughout the day, based on both volume and price.  It is important because it provides traders with insight into both the trend and value of the instrument. What is the Difference between VWAP and AVWAP? While VWAP is having as starting point the beggining of the day,week,month etc. in the AVWAP you can pla
Weis Wave with Alert
Trade The Volume Waves Single Member P.C.
4.81 (21)
Rental/Lifetime Package Options and Privileges' Rent Monthly Six Months   Yearly/Lifetime Weis Wave with Speed with Alert+Speed Index x x x Manual  x x x Quick Set up Video x x x Blog x x x Lifetime Updates x x x Setup and Training Material x x Rectangle Break Alert Tool      x Discord Access Channel "The SI traders" x   How to trade info visit:    http://www.tradethevolumewaves.com   ** If you purchase please contact me to setup your  : Two hour  webinar and  training Room and  complete m
No Demand No Supply MT5
Trade The Volume Waves Single Member P.C.
No Demand No Supply   This indicator identifies   No Demand –No Supply candles to your chart and plots volume bars colored according to the signal. It can be applied to all timeframes or to a specific one only. It can also be used as regular volume indicator  with exceptional future of WEIGHTED VOLUME. Furthermore is has an alert notification, sound and email when a signals occurs. The indicator does not repaint but the alert will come on two candles back due to the definition of No Demand No Su
Anchored VWAP with Alert
Trade The Volume Waves Single Member P.C.
5 (4)
What is the Volume Weighted Average Price (VWAP)? The volume weighted average price (VWAP) is a trading benchmark used by traders that gives the average price an instrument has traded at throughout the day, based on both volume and price.  It is important because it provides traders with insight into both the trend and value of the instrument. What is the Difference between VWAP and AVWAP? While VWAP is having as starting point the beggining of the day,week,month etc. in the AVWAP you can plac
TrendLines Cross with Alert
Trade The Volume Waves Single Member P.C.
3.67 (3)
Trend Lines Cross  This indicator will alert you on any cross of a Trendline. You can draw up to two trend lines and form a channel, a pennant , a triangle or a simple trend and when the price crosses either trend line the indicator  will provide you with alerts that you define plus an up or down arrow when the cross happened. How to:   Draw the 1st trendline and name it tl1.  Draw the 2nd trendline and name it tl2. Select which type of alerts you would like in the indicator properties and you a
FREE
No Demand No Supply
Trade The Volume Waves Single Member P.C.
4.5 (4)
This indicator identifies No Demand –No Supply candles  to your chart and plots volume bars colored according to the signal. It can be applied to all timeframes or to a specific one only. It can also be used as regular volume indicator but with exceptional future of WEIGHTED VOLUME. Furthermore is has an alert notification, sound and email when a signals occurs. The indicator does not repaint but the alert will come on two candles back due to the definition of No Demand No Supply. The VSA (Volum
Wave Anatomy
Trade The Volume Waves Single Member P.C.
5 (1)
Wave Anatomy Visit:   http://www.tradethevolumewaves.com   for more information Construct your own 5 Waves and analyze the price movements stages: Easy Movement Hard time to move Fast move This indicator is based on Wyckoff’s, David’s Weis and my Speed Index Theory. This indicator will you help analyze what is happening in 5 Price Waves that you can construct yourself. This tool is designed for scalpers and swing traders and will help them to analyze any wave on any timeframe at the same time.
Wave Anatomy MT5
Trade The Volume Waves Single Member P.C.
Wave Anatomy Visit:  http://www.trafethevolumewaves.com  for more information Construct your own 5 Waves and analyze the price movements stages: Easy Movement Hard time to move Fast move This indicator is based on Wyckoff’s, David’s Weis and my Speed Index Theory. This indicator will you help analyze what is happening in 5 Price Waves that you can construct yourself. This tool is designed for scalpers and swing traders and will help them to analyze any wave on any timeframe at the same time. Fur
フィルタ:
Mr_Corazon
59
Mr_Corazon 2024.03.10 09:28 
 

I read a book by David Weis and watched a video of his, from there I found this product which has been developed by Takis. He is passionate about what he has created and he is generous with his offering of expertise and more importantly he is generous with his time. It looks very complicated but its quite simple in essence and time spent with the creator and programmer himself was a pleasure. Thank you for everything so far Takis. And here is to a plentiful 2024

Trade The Volume Waves Single Member P.C.
6121
開発者からの返信 Panagiotis Diamantopoulos 2024.03.10 09:39
Thank you for your honest review and kind words.
TruthMV
49
TruthMV 2023.06.03 00:23 
 

I just want to say thank for sharing your experience in putting together the "Weis Wave with Speedy Index Indicator". Using the Wyckoff Method, David Weis's Wave theory with Forex all in one. I would say it's not really a indicator, it's a way to read the charts for your self and not dependent on a line crosses this line or candle crossed a MA. I've been searching for many years trying to find some sort of logical process and common denominator in trading, I've spent thousands on all sort of esoteric books, platforms, data feeds etc. and was almost ready to quit, thinking I'm not smart enough to figure all this out. I've been applying the, "Trade The Volume Wave Method" for only three months, but I've had more consistent results and the confidence in what I'm learning will work. Even though I've made mistakes, now I know why and learn from them. Also, thanks for offering a two hour training session for free, for now, to get me up and running and the Discord Channel where we can discuss potential trades. Thank you Panagiotis (Takis) for giving all of us retail traders peace of mind and hope. Mark USA

Trade The Volume Waves Single Member P.C.
6121
開発者からの返信 Panagiotis Diamantopoulos 2023.06.03 06:12
Thank you for your kind words Mark.
mistaeff
159
mistaeff 2023.01.05 22:15 
 

Throughout my time using the MQL5 platform, I have never come across anyone who is more devoted to the success of their customers. The developer is a great guy, he spends hours sharing his knowledge and is a successful professional trader in his own right. He has developed a personal trading system, along with a pretty unique indicator that will enable you to consistently profit in the forex markets. I would highly recommend this product, whether you are starting a brand new strategy or even adding additional verifications to an existing strategy.

Trade The Volume Waves Single Member P.C.
6121
開発者からの返信 Panagiotis Diamantopoulos 2023.01.05 22:18
Thank you for your honest review!
Mark Renier
33
Mark Renier 2022.11.27 07:57 
 

I wanted to have Weis wave indicator in my charts and I decided for this indicator because additional features that it offers. Actually I changed the platform just to get Weis wave indicator and I decided for MT5. MT5 has its flaws, so I would rather recommend others to choose MT4 if they have to made the same decision. Support for this indicator is exelent. Takis is always available for help and he is answering any questions. And personal private teaching from Takis is also very valuable. Beside that you get access to private discord group where trade opportunites are shared and also other discussions regarding Weis wave. I would like to thank Takis for his help and support.

Trade The Volume Waves Single Member P.C.
6121
開発者からの返信 Panagiotis Diamantopoulos 2022.11.27 09:54
Thank you Mark.
baszim
240
baszim 2022.06.21 17:22 
 

ユーザーは評価に対して何もコメントを残しませんでした

Trade The Volume Waves Single Member P.C.
6121
開発者からの返信 Panagiotis Diamantopoulos 2022.06.21 17:58
Thank you for your review Bas. It is worth noting what you mentioned about this not being a signal indicator, if it was that easy I would have created a robot trading but markets change and you need to be able to read them and adjust accordingly. This is a tool that will help read the market and understand Wyckoff better as you already mentioned. Thanks again for the review!
Sh_Mikhail
236
Sh_Mikhail 2022.01.31 08:21 
 

Very pleased with the purchase. The two hours training with Takis are extremely valuable, and it does not stop at that. He is using a community App to share a lot of tips and to explain the rational behind some of the trades he takes. That means we are getting continuous education to improve our skills using the indicator. He also shares signals with us which he does not have to do. Highly recommended if you are serious about improving your manual trading. Thanks a lot Takis for all your efforts. Highly appreciated

Trade The Volume Waves Single Member P.C.
6121
開発者からの返信 Panagiotis Diamantopoulos 2022.01.31 08:25
Thank you for your kind words! Trying my best to educate retail traders because I have been there and know how it is. Thanks again.
Leguar
65
Leguar 2022.01.07 11:43 
 

The indicator is just the tip of the iceberg. The real value is the education you get for the price of the indicator. I highly recommend it and thank you!

Trade The Volume Waves Single Member P.C.
6121
開発者からの返信 Panagiotis Diamantopoulos 2022.01.07 13:45
Thank you Leguar. Exactly as you mention, the real value is the education behind it and it is worth much more than the indicator. Furthermore, I think it is worthwhile to mention that I am trading with the indicator myself, not just selling it. Thanks again.
Sumit Dubey
1459
Sumit Dubey 2021.12.13 05:09 
 

Excellent indicator and support. Best part is , knowledge to apply indicator and understand market move is free with indicator. Must say , price for education not indicator. Thanks a lot Mr. Panagiotis !

Trade The Volume Waves Single Member P.C.
6121
開発者からの返信 Panagiotis Diamantopoulos 2021.12.13 07:22
Thank you Sumit, I hope you make lots of pips with it.
Andre Gomes
2856
Andre Gomes 2021.10.14 20:30 
 

Excellent indicator and customer support. This tool really gives you an edge. Totally recommend it.

Trade The Volume Waves Single Member P.C.
6121
開発者からの返信 Panagiotis Diamantopoulos 2021.10.14 20:45
Thank you Andre!
Rutt Tungkiratichai
2181
Rutt Tungkiratichai 2021.09.13 05:43 
 

This is the price for education not only indicator.This indicator open new world for me.

Trade The Volume Waves Single Member P.C.
6121
開発者からの返信 Panagiotis Diamantopoulos 2021.09.13 06:54
Thank you Rutt!
adonis4ex
6351
adonis4ex 2021.07.29 11:49 
 

what can i say but, just an amazing product put forward by an aamazing guy. Panagiotis is so personable and really is looking to help you out as much as you are willnig to ask for help and work with him. i told him i wanted to learn everything i could and he is enthusiastic about teaching, im a former high level athlete and i call him my coach now, with his help and the help of this indicator i will master the foreign exchange market... just to bne clear i already am afull time trader and make my living doing it but i am never one to think i know everything adn i knew i wanted to take my trading to the next level, well this is definitely the next level. thank you my friend i lookk forward to us working together and making lots of money and happiness. anyone that is already doing well trading but kind of is still loking for that ultimate method or for that deper knowledge, this is the place

Trade The Volume Waves Single Member P.C.
6121
開発者からの返信 Panagiotis Diamantopoulos 2021.07.29 12:21
Thank you for your kind words Adonis4ex
satish vangipuram
33
satish vangipuram 2020.12.26 17:06 
 

this product and the methods taught by takis are geared towards practical trading purposes. there are not a lot of products out there about which this can be said. the personal mentoring and help by takis is high quality. he will work with you to develop a trading strategy. no bullshit. well worth the money.

SamitR
1386
SamitR 2020.06.23 00:13 
 

If there was a way I could give someone 100 stars , then this would be it !!!!! I have never had anyone like Panagiotis during all my time in the field of trading He literally held my hand and went through all the steps of how to use his fabulous indicators He is a true gentleman..God Bless

malmegrin
69
malmegrin 2019.12.04 18:27 
 

The Best Weis Wave indicator available!!!! Blazing fast and full of features. And the tech support is Awesome!!!!!! Thx a lot for the Work Mr. Panagiotis.

Eduardo Silva Vian
328
Eduardo Silva Vian 2019.11.30 05:00 
 

Excelente indicador. De todos weis wave, sem dúvida esse é o melhor. O speed index é muito efetivo para antecipar grandes movimentos, sem dúvida, o melhor indicador para rastrear o "smart money". Recomento. Um investimento que você não vai se arrepender.

Excellent indicator. Of all weis wave, no doubt this is the best. Speed index is very effective for anticipating large movements, arguably the best indicator for tracking smart money. I recommend it. An investment you will not regret.

Globex43
214
Globex43 2019.09.11 13:45 
 

Excellent!

レビューに返信
バージョン 10.0 2023.10.08
Added alerts for the two new signals PFBL and PFBS
バージョン 9.9 2023.10.08
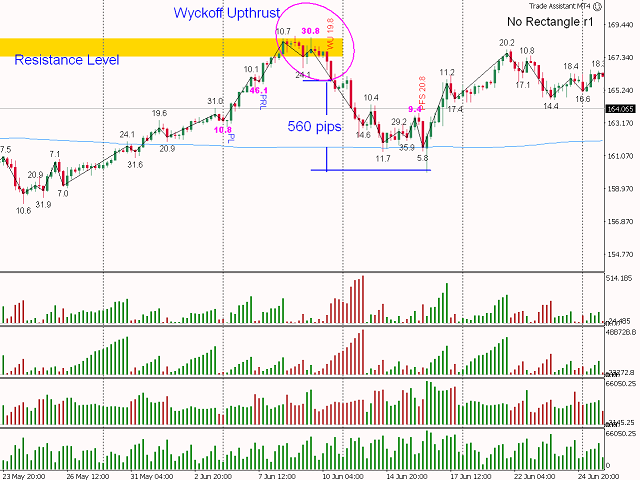
Two more Fake Break Signals have been added:
PFBL - Plutus Fake Break Long
PFBS - Plutus Fake Break Short
バージョン 9.8 2023.07.17
New Wave Type added IPPR: Inverse Progressive Pip Rate. Please refer to the manual for a detail explanation!
バージョン 9.7 2023.03.12
Added a double signal of WS+PRL or WU+PRS when both conditions are met
バージョン 9.6 2023.02.14
New Feature added making the indicator faster by calculating part of the code only on New Bar creation. Just set "Calc OnNewBar=true"
This feature is extremely useful when you are working with Custom charts such as Tick Charts, Renko, Range, etc which are very CPU intensive but also if you have lots of charts open.
バージョン 9.5 2023.01.16
Fixed Plutus signal moving to next bars
バージョン 9.4 2022.12.23
Rollback
バージョン 9.3 2022.12.23
Fixed displaying Pips instead of Points on Autowaves
バージョン 9.2 2022.12.16
Updated Autowaves Algorithm - AutoSensitivity adjustment might be necessary.
New Feature - Auto Fast and Slow Waves
Setting Speed Index Display to 4 the indicator will display next to Speed Index the letter F="Fast" or "S"=Slow to designate if the wave is fast or slow compared to the Average Speed Index.
You can set how fast or slow from the Extreme_Threshold parameter. For example., if you set the Extreme Threshold to 0.5 (50%) then if the wave's speed index is less than 50% of Average Speed Index it will be signified as F=Fast wave or if the wave's speed index is greater than 50% of the Average Speed Index it will be signified as S="Slow".
バージョン 9.1 2022.12.08
New Improved Autowaves Algorithm.
You might need to adjust your Autosensitivity setting.
バージョン 9.0 2022.11.25
Fixed out of range bug
バージョン 8.9 2022.11.24
Improved Plutus Signals Algorithm
バージョン 8.8 2022.11.18
Improved real volume loop calculations
バージョン 8.7 2022.10.19
Code Improvements
バージョン 8.6 2022.10.11
Improve Autowaves Algorithm
バージョン 8.5 2022.10.07
Code Improvements
バージョン 8.4 2022.10.06
Fixed disappearing labels.
バージョン 8.3 2022.10.06
1. Added weighted average of Speed Index AvgWSI
2. Added weighted average of Speed Index of up waves uWSI
3. Added weighted average of Speed Index of dn waves dWSI
4. Code improvements
バージョン 8.2 2022.09.23
Fix a small bug on High Volume Alert
バージョン 8.1 2022.09.22
New feature
Added Wyckoff and Fake Break Signals.
Option to Display Avg Speed Index next to Speed Index
Keyboard Z button to refresh chart (needed for tick charts)
バージョン 8.0 2022.06.17
Various Code Improvements
バージョン 7.9 2022.03.08
Improved Speed Index Algorithm
バージョン 7.8 2022.02.28
Fix deleting all objects when changing timeframe after last update.
バージョン 7.7 2022.02.23
Display/Calculate or not Average SI
バージョン 7.6 2022.02.23
Code optimization made it faster
Fixed Object delete
Fixed Array out of Range
バージョン 7.5 2022.02.15
1. New Feature: Automatic Extreme Speed Index Alert for Slow and Fast Waves
2. Added different color for Plutus SIs
バージョン 7.4 2021.11.18
empty array error fixed
バージョン 7.3 2021.09.18
Code improvements om Speed Index Display
バージョン 7.2 2021.05.13
Fixed an array issue
バージョン 7.1 2021.04.28
Fix issue with Signal Alert
Removed Show Individual Signals
バージョン 7.0 2021.04.23
Plutus Patterns Signals added.These signals offer high probability Long and Short trades. No need to scan your charts for Plutus Patterns, just setup the alert and you are ready to get notified.
Recomended setting:
Show Plutus Signal=true
SI Ratio =2.0 (Speed Index Ratio)
Min Wave Bars = This is the total number of bars of both waves forming the pattern. I recommend 4 when trading the 1HR, 3 when trading higher TFs. The smaller TF you are trading the higher number.
バージョン 6.0 2021.03.01
All In One
Choose what Wave Type you would like to display:
Regular Volume, Pips, Progressive Volume Rate, Time or Emphasized Volume Waves
バージョン 5.3 2021.02.06
Code Improvement
Weight Volumed Algorithm Adjustment
バージョン 5.2 2021.01.29
Multiple Indicators can be added to the same chart
Show your orders or not on the chart
New Net Volume wave calculation according to Price Median
New Volume Filter = Progressive Volume Rate
バージョン 5.1 2020.12.18
Added Net Volume Waves option. Bulish Candle is considered a +volume and bearish Candlet is considered a -Volume.
The Net Volume Wave= Absolute(+volume-volume)
バージョン 5.0 2020.09.23
Labelshift code improvement,you need to adjust your Labeshift start with value =0.5 or 1 ,
Added Volume and SI display together
Added SI Multiplier
Remove weighted volume on specific bars, weighted volume calculates all bars
バージョン 4.9 2020.09.10
Updated SI Algorithm & changed indicator name
バージョン 4.8 2020.09.07
Added Weighted Volume features!
バージョン 4.7 2020.08.16
Added the option to Load All Bars or Specific Number of Bars
Weighted volume under development
バージョン 4.6 2019.09.19
Adjusted Weighted Volume - added all bars weight-added DayLight Savings
バージョン 4.5 2019.08.13
Updated Speed Index, Volume divider and Pip Divider
バージョン 4.4 2019.07.18
Adjusted Autowaves
バージョン 4.3 2019.07.15
Adjusted Autowaves Algorithm
バージョン 4.1 2019.06.02
Added display of AutoSensitivity parameter on chart
バージョン 4.0 2019.05.28
1. ****NEW Auto Volume Waves ****

AutoDifference: true/false - Neglects the Wave Direction difference and adjusts the Difference automatically creating more accurate waves.
AutoSensitivity: The higher the number the higher the sensitivity and therefore more waves are formed.
Format Parameters for Auto Difference value displayed on chart as "WV Difference:xx" (Corner, Y offset, X offset, Font, Font Size)

2. Adjusted Label Shift

バージョン 3.2 2019.03.31
Added parameters for Speed Index color and Speed Index Alerts color
バージョン 3.1 2019.03.21
Pip display adjustment.
バージョン 3.0 2019.03.21
Added Advanced Volume Filter that emphasizes on significant volume waves.
バージョン 2.0 2019.02.03
Major Update:
New functions added to the indicator
1. PipDivBy: Pips divider in order to avoid big numbers on the display
2. Ability to choose which labels to display: 1 - Volume, 2 -Pips, 3 -Bars, 4- ALL, 5- Volume and Pips

New Speed Index Display and Alert
Speed Index= Wave Volume/Pip Distance - which means how much volume was needed to move 1 pip. The smaller the number is the faster the wave is. The larger the number is the slower the wave is.

Alert functionality has been added if speed index is above a certain value and/or below a certain value.


Push Notification has been added on both Volume and Speed Index