• 미리보기
  • 리뷰 (1)
  • 코멘트

Candle Time MT5

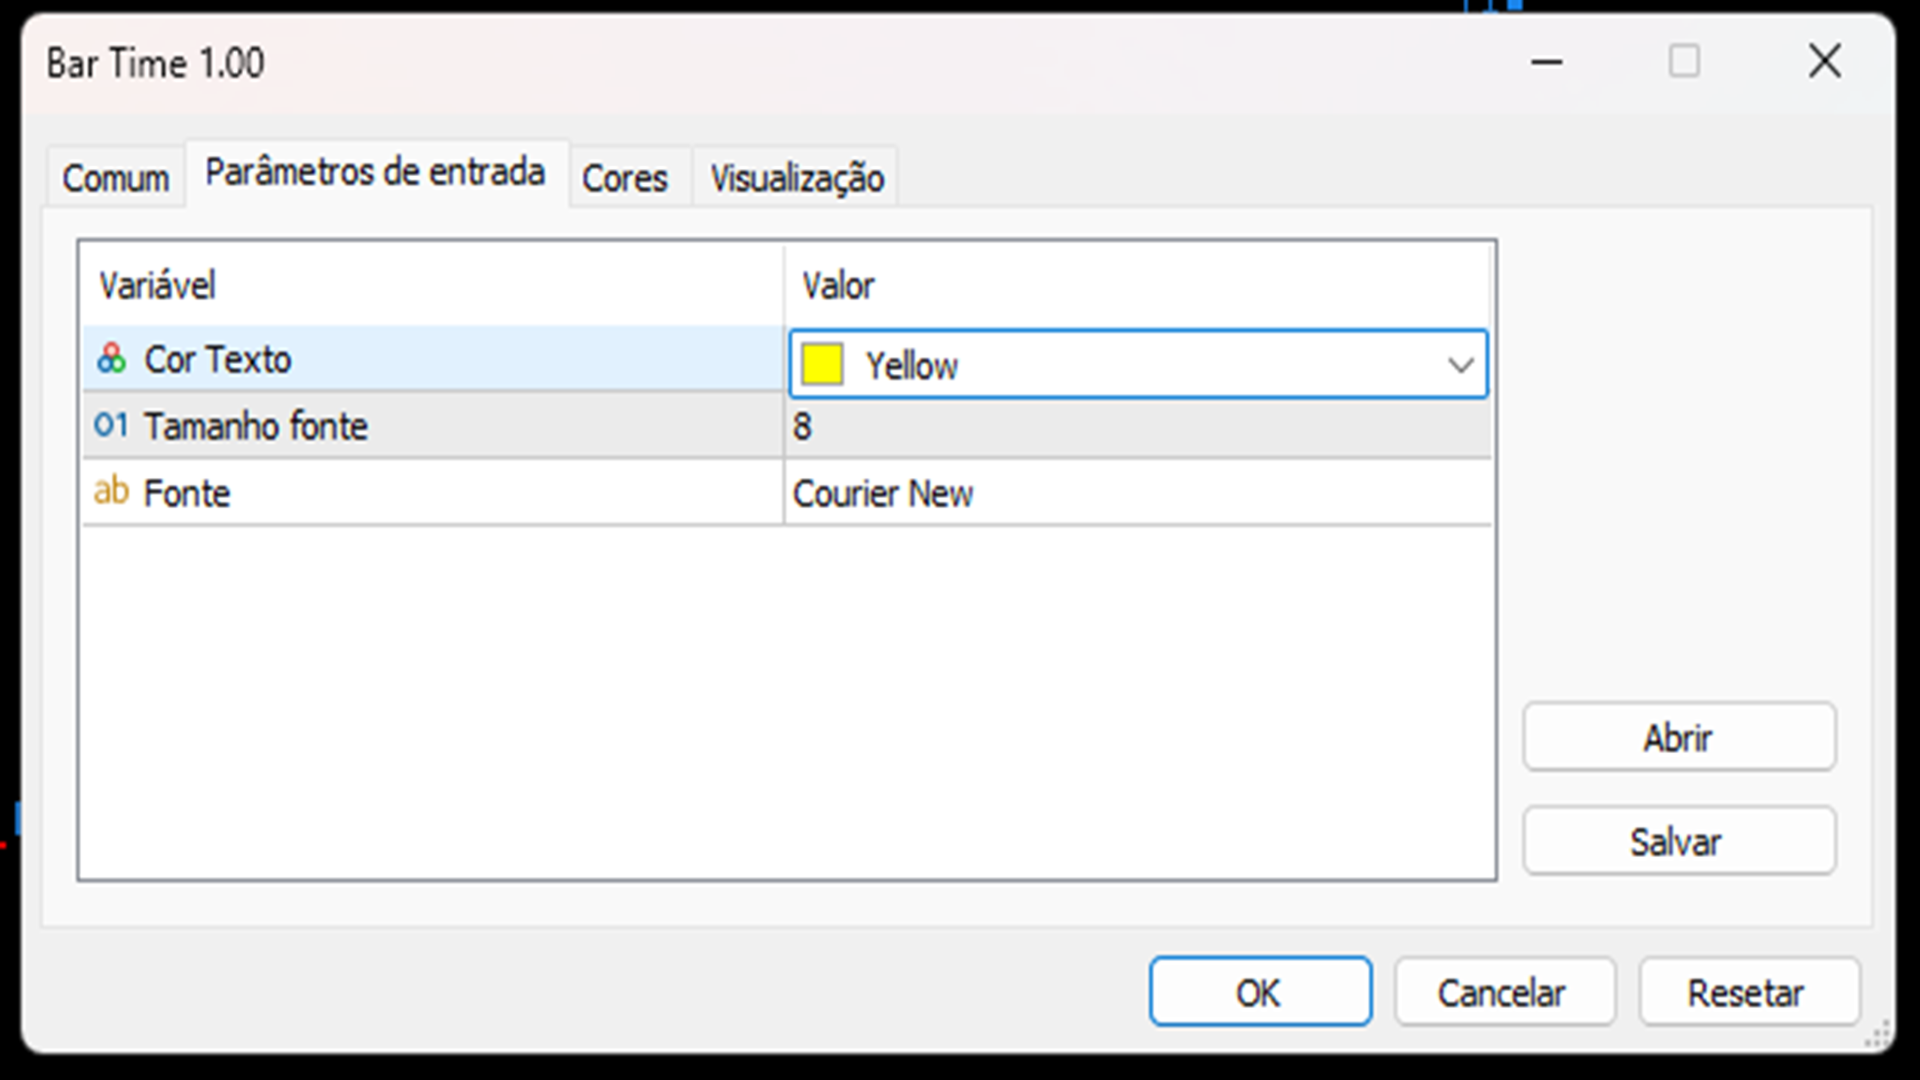
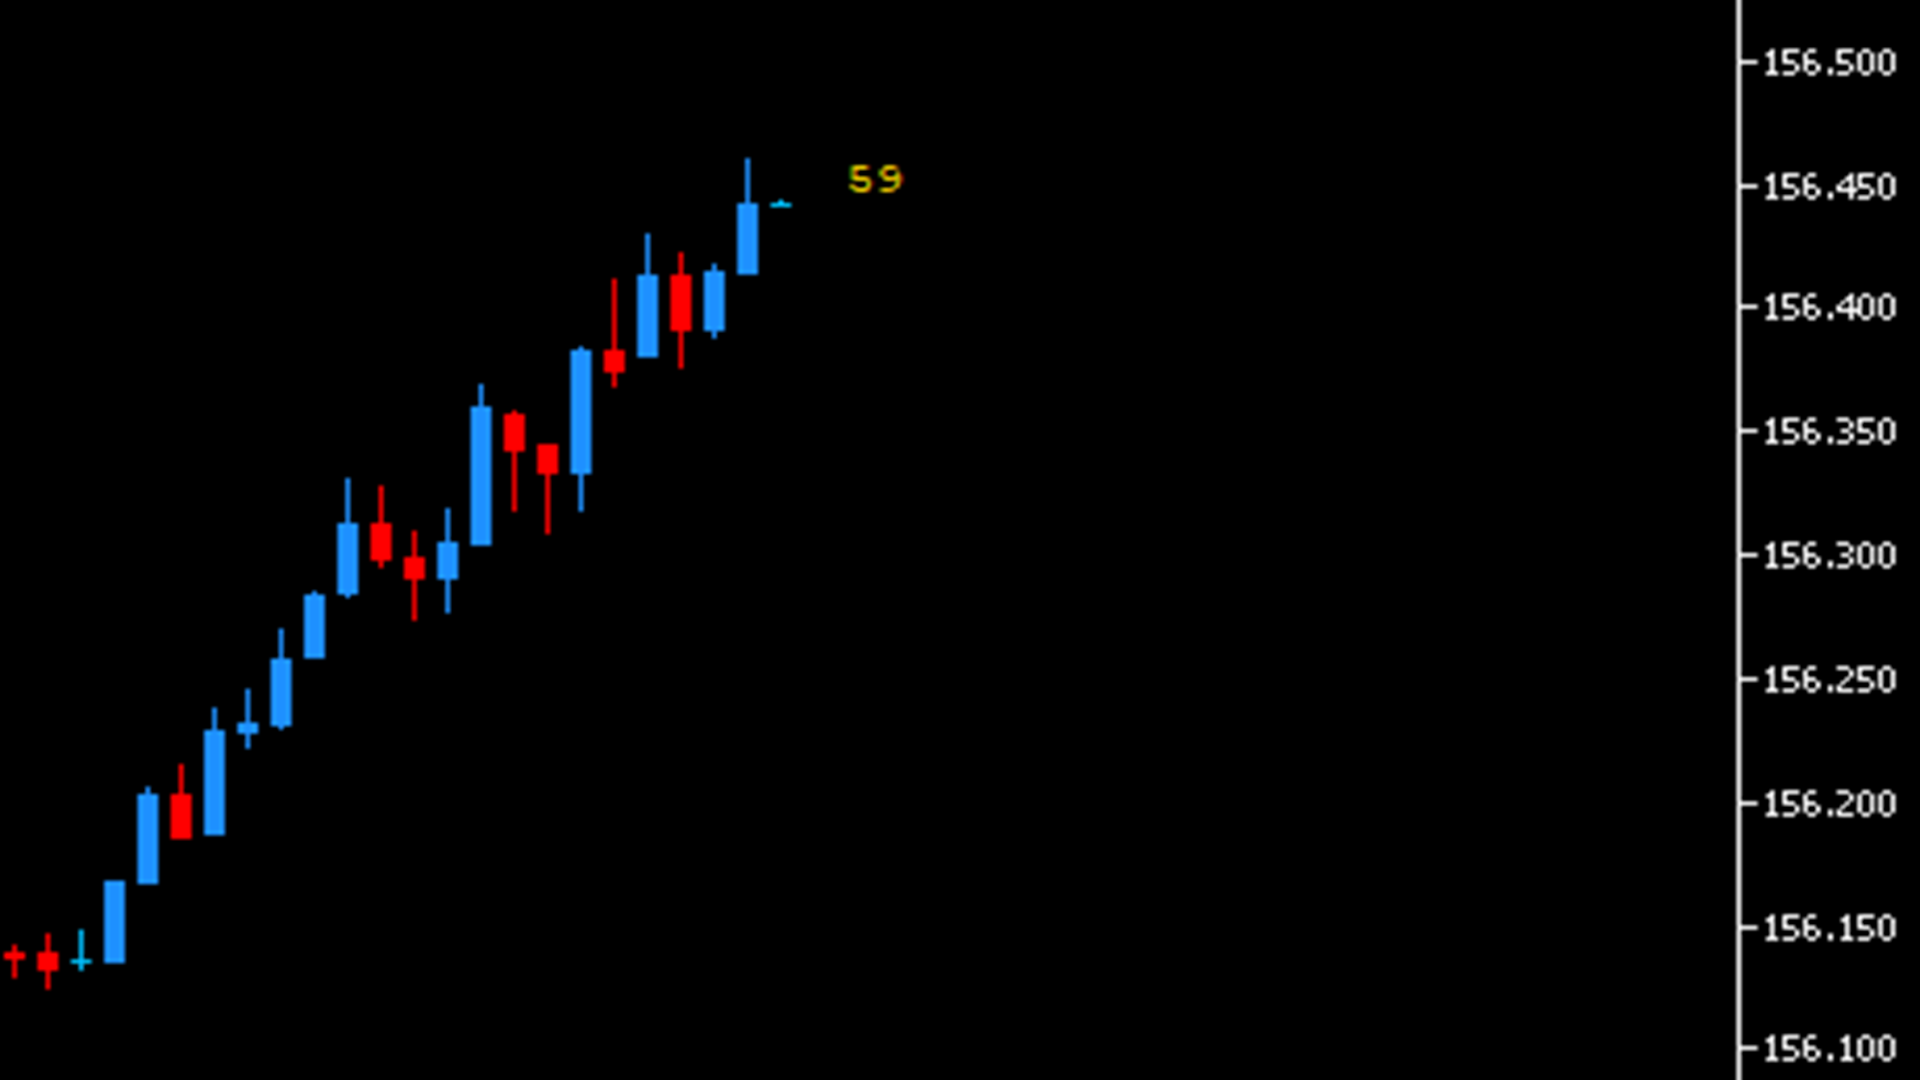
Free indicator that displays the remaining time until the current candle closes directly on the chart. Designed for traders who demand precision and timing, this lightweight and fully customizable tool enhances your trading experience. It is easy to install, compatible with all assets, markets, and timeframes, and provides real-time updates to support smarter decision-making.


추천 제품
Cybertrade Keltner Channels
Emanuel Andriato
4.75 (4)
Cybertrade Keltner Channels - MT5 Created by Chester Keltner, this is a volatility indicator used by technical analysis. It is possible to follow the trend of financial asset prices and generate support and resistance patterns. In addition, envelopes are a way of tracking volatility in order to identify opportunities to buy and sell these assets. It works on periods longer than the period visible on the chart. All values ​​are available in the form of buffers to simplify possible automations.
FREE
Weis Waves
Flavio Javier Jarabeck
2.83 (18)
The original author is David Weis, an expert in the Wyckoff Method. The Weis Wave is a modern adaptation of the 1930's Wyckoff Method, another expert in Tape Reading techniques and Chart Analysis. Weis Waves takes market volume and stacks it into waves according to price conditions giving the trader valuable insights about the market conditions. If you want to learn more about this subject you can find tons of videos in YouTube. Just look for "The Wickoff Method", "Weis Wave" and "Volume Spread
FREE
Server Clock
Flavio Javier Jarabeck
5 (5)
Many friends asked me for a simple, non-obtrusive, resource-friendly clock to track the time during their trades. It seems pretty obvious, but it is a must-have for those trading the market manually, waiting for the Market News, or just to visually know what time it is... Trading is an absorbing endeavor! So, here it is... Totally configurable, including Font Type, Font Size and Chart Location: Upper Left/Center/Right OR Lower Left/Center/Right, with a little twist of adjusting the Offset, just
FREE
Value Chart Candlesticks
Flavio Javier Jarabeck
4.75 (12)
The idea of a Value Chart indicator was presented in the very good book I read back in 2020 , " Dynamic Trading Indicators: Winning with Value Charts and Price Action Profile ", from the authors Mark Helweg and David Stendahl. The idea is simple and the result is pure genius: Present candlestick Price analysis in a detrended way! HOW TO READ THIS INDICATOR Look for Overbought and Oversold levels. Of course, you will need to test the settings a lot to find the "correct" one for your approach. It
FREE
Free automatic Fibonacci is an indicator that automatically plots a Fibonacci retracement based on the number of bars you select on the BarsToScan setting in the indicator. The Fibonacci is automatically updated in real time as new highest and lowest values appears amongst the selected bars. You can select which level values to be displayed in the indicator settings. You can also select the color of the levels thus enabling the trader to be able to attach the indicator several times with differe
FREE
Bollinger Bands B
Flavio Javier Jarabeck
4.5 (2)
John Bollinger created this indicator in 2010 as a way to read the original indicator (Bollinger Bands) in a more "technical" way, shown as an oscillator. The typical range of the Bollinger Bands %B is 0 - 0.5 - 1.0, where "0" represents the lower band, the "0.5" the middle band, and "1" the upper band. The line on the indicator represents the Closing prices. As simple as that. SETTINGS Bollinger Bands period of analysis Standard Deviation multiplier Shift Price type to be analyzed If you like
FREE
Donchian Pro
Paulo Henrique Faquineli Garcia
5 (3)
The Donchian Channel Channels are among the most popular tools of technical analysis, as they visually convey to the analyst the limits within which most price movement tends to occur. Channel users know that valuable information can be obtained at any time, whether prices are in the central region of a band or close to one of the border lines. One of the best known techniques to explore these concepts is Bollinger Bands. However, John Bollinger was not the only one to research the application
FREE
RSI abcd
Francisco Gomes Da Silva
3 (1)
RSI ABCD 패턴 파인더: 기술적 전략 1. 지표 작동 방식 클래식 RSI 와 ABCD 하모닉 패턴 자동 감지를 결합합니다. 주요 구성 요소 표준 RSI (조정 가능한 기간) 고점 및 저점 마커 (화살표) ABCD 패턴 (초록/빨강 선) 과매수 (70) 및 과매도 (30) 필터 2. MT5 설정 period = 14 ; // RSI 기간 size = 4 ; // 최대 패턴 크기 OverBought = 70 ; // 과매수 수준 OverSold = 30 ; // 과매도 수준 Filter = USE_FILTER_ YES ; // 확인 필터 3. 트레이딩 전략 3.1. 매수 진입 (강세 ABCD) 조건: RSI가 다음을 형성: 저점 ( A ) → 고점 ( B ) → 더 높은 저점 ( C ) D 는 과매도 (30) 위지만 C 아래 확인: A-B-C-D 연결 초록 선 목표: TP1: B-C의 61.8% TP2: B-C의 100% 손절: D 아래 3.2. 매도 진입 (약세 ABCD) 조건:
FREE
Functional in the Forex market. Functional in the B3 market - Bolsa Brasil Balcão. Motivation The technical Fibonacci retraction indicator for many is essential and the basis for all market movement forecasts. The name of the tool comes from the Italian mathematician Leonardo de Pisa (13th century). This DEMO version will work in Meta Trader with Demo and Strategy Tester. To purchase the Full version that works on a Real account, click on: https://www.mql5.com/en/market/product/38089 Opera
FREE
VisualVol EURUSD
Maxim Kuznetsov
The indicator highlights the points that a professional trader sees in ordinary indicators. VisualVol visually displays different volatility indicators on a single scale and a common align. Highlights the excess of volume indicators in color. At the same time, Tick and Real Volume, Actual range, ATR, candle size and return (open-close difference) can be displayed. Thanks to VisualVol, you will see the market periods and the right time for different trading operations. This version is intended f
FREE
Quantitative Candlesticks Qstick
Flavio Javier Jarabeck
4 (2)
Qstick is a way to objectively quantify candlestick analysis and improve the interpretation of candlestick patterns. Qstick was developed by Tushar Chande and published in his book " The New Technical Trader - Boost Your Profit by Plugging Into the Latest Indicators (1994) ". Qstick is built based on a moving average of the difference between the Open and Close prices. The basis of the idea is that the Opening and Closing prices are the heart of candlestick analysis. We strongly recommend the re
FREE
This robot sends Telegram notifications based on the coloring rules of PLATINUM Candle indicator. Example message for selling assets: [SPX][M15] PLATINUM TO SELL 11:45. Example message for buying assets : [EURUSD][M15] PLATINUM TO BUY 11:45 AM. Before enable Telegram notifications  you need to create a Telegram bot, get the bot API Key and also get your personal Telegram chatId. It's not possible to send messages to groups or channels. You can only send messages to your user chatId. You should
FREE
PZ Penta O MT5
PZ TRADING SLU
3.5 (4)
The Penta-O is a 6-point retracement harmonacci pattern which usually precedes big market movements. Penta-O patterns can expand and repaint quite a bit. To make things easier this indicator implements a twist: it waits for a donchian breakout in the right direction before signaling the trade. The end result is an otherwise repainting indicator with a very reliable trading signal. The donchian breakout period is entered as an input. [ Installation Guide | Update Guide | Troubleshooting | FAQ | A
FREE
LT Donchian Channel
Thiago Duarte
4.83 (6)
Donchian Channel is an indicator created by Richard Donchian. It is formed by taking the highest high and the lowest low of the last specified period in candles. The area between high and low is the channel for the chosen period. Its configuration is simple. It is possible to have the average between the upper and lower lines, plus you have alerts when price hits one side. If you have any questions or find any bugs, please contact me. Enjoy!
FREE
MIDAS Super VWAP
Flavio Javier Jarabeck
4.4 (10)
Imagine VWAP, MVWAP and MIDAS in one place... Well, you found it! Now you can track the movement of Big Players in various ways, as they in general pursue the benchmarks related to this measuring, gauging if they had good execution or poor execution on their orders. Traders and analysts use the VWAP to eliminate the noise that occurs throughout the day, so they can measure what prices buyers and sellers are really trading. VWAP gives traders insight into how a stock trades for that day and deter
FREE
Trendline mt5 indicator
David Muriithi
3 (1)
Are you tired of drawing trendlines every time you're analyzing charts? Or perhaps you would like more consistency in your technical analysis. Then this is for you. This indicator will draw trend lines automatically when dropped on a chart. How it works Works similar to standard deviation channel found on mt4 and mt5. It has 2 parameters: 1. Starting Bar 2. Number of bars for calculation The   starting bar   is the bar which drawing of the trend lines will begin, while the   number of bars for c
FREE
ZP Day Trading Indicator in MT5 The ZP Day Trading Indicator is one of the tools developed based on Price Action trading style concepts in MetaTrader 5. This indicator uses color-coded boxes to identify Trading Ranges on the chart. A trading range forms when the price moves within a specific range between a resistance level (ceiling) and a support level (floor) over a period of time. In such scenarios, buyers and sellers reach equilibrium within the defined range. «Indicator Installation & User
FREE
Bar Color Trend
Germano Chagas
4.38 (8)
Combining the best of Price Action , Directional Movement , and Divergence/Convergence analysis, Candle Color Trend is a easy and reliable way to identify trend direction. The indicator automatically paints the candles according to the assumption that an uptrend is defined by prices that form a series of higher highs and higher lows. In contrast, a downtrend is defined by prices that form a series of lower highs and lower lows. Additionally, ADX Wilder indicator is used to measure trend weakness
FREE
High Low Open Close
Alexandre Borela
4.98 (40)
이 프로젝트를 좋아한다면 5 스타 리뷰를 남겨주세요. 이 지표는 열리고, 높은, 낮은 및 마감 가격을 지정합니다. 기간과 그것은 특정한 시간대를 위해 조정될 수 있습니다. 이들은 많은 기관 및 전문가에 의해 보는 중요한 수준입니다 상인은 당신이 더 많은 것일 수있는 장소를 알고 도움이 될 수 있습니다 이름 * 사용 가능한 기간: 이전 날. 이전 주. 지난 달. 이전 분기. 이전 연도. 또는: 현재 날. 현재 주. 현재 달. 현재 분기. 현재 년.
FREE
Exact Time — detailed time on the seconds chart. The utility shows the opening time of the selected candle. This is necessary when working with seconds charts. For example, it can be used on a seconds chart built using the Seconds Chart utility. Inputs Base corner — the chart corner to which an object Is attached. X distance — the horizontal distance from the chart corner. Y distance — the vertical distance from the chart corner. Text font — font name Font size — font size Color — text color
FREE
Follow The Line MT5
Oliver Gideon Amofa Appiah
4.52 (29)
This indicator obeys the popular maxim that: "THE TREND IS YOUR FRIEND" It paints a GREEN line for BUY and also paints a RED line for SELL. (you can change the colors). It gives alarms and alerts of all kinds. IT DOES NOT REPAINT and can be used for all currency pairs and timeframes. Yes, as easy and simple as that. Even a newbie can use it to make great and reliable trades. NB: For best results, get my other premium indicators for more powerful and reliable signals. Get them here: https://www.m
FREE
Supports And Resistances Lines
Francisco Gomes Da Silva
4.74 (38)
지원 및 저항 구역 표시기 MT5 이 표시기는 상단과 하단을 자동으로 식별하는 방법을 알고 있습니다. 이 지지선과 저항선 표시기는 상단과 하단을 기준으로 지지선과 저항선을 만듭니다. 지지선과 저항선을 만드는 방법. 자동 지지선과 저항선을 만드는 지표입니다. 지표로 지원 수준을 찾는 방법 이 표시기는 자동으로 상단과 하단을 찾습니다. 지그재그(ZigZag)가 자동으로 바닥을 생성하거나 새로운 바닥을 이전 바닥보다 낮게 만들 때마다 표시기가 자동으로 지지선을 생성하므로 표시기가 자동으로 화면에 자동 지지선을 그립니다. 저항선을 만드는 방법. 지그재그(ZigZag)가 새로운 최고점이나 최고점을 이전 최고점보다 높게 만들 때마다 표시기가 지지선을 생성하는 것과 같은 방식으로 자동으로 저항선을 생성하므로 표시기가 자동으로 새로운 저항을 생성하므로 사용자가 상단과 하단 레벨이 어디에 있는지 걱정해야 합니다. 이 지표는 트레이더가 차트에 지지와 저항을 표시할 수 있는 쉬운 방법입니다. 상단 표시
FREE
Spike Catch Pro
Amani Fungo
4.14 (7)
Spike Catch Pro 22:03 release updates Advanced engine for searching trade entries in all Boom and Crash pairs (300,500 and 1000) Programmed strategies improvements Mx_Spikes (to combine Mxd,Mxc and Mxe), Tx_Spikes,   RegularSpikes,   Litho_System,   Dx_System,   Md_System,   MaCross,   Omx_Entry(OP),  Atx1_Spikes(OP),   Oxc_Retracement (AT),M_PullBack(AT) we have added an arrow on strategy identification, this will help also in the visual manual backtesting of the included strategies and see ho
FREE
LT Agression Indicator
Thiago Duarte
5 (3)
This is a buyer and seller aggression indicator that analyzes the shape of each candle and project this data in a histogram form. There are 4 histograms in one. On the front we have two: Upper - Buyer force. Lower - Seller force. At the background we also have two histogram, both with same color. They measure the combined strenght of buyers and sellers. This histograms can be turned off in Input Parameters. It is also possible to have the real or tick volume to help on this force measurement. IN
FREE
Tabajara V5
Flavio Javier Jarabeck
4.83 (35)
Metatrader 5 version of the famous Andre Machado's Tabajara indicator. If you don't know Andre Machado's Technical Analysis work you don't need this indicator... For those who need it and for those several friend traders who asked this porting from other platforms, here it is... FEATURES 8-period Moving Average 20-period Moving Average 50-period Moving Average 200-period Moving Average Colored candles according to the inflexion of the 20-period MA SETTINGS You can change the Period of all MA's
FREE
Volume Weighted Average Price or VWAP is an indicator wich shows different average prices on chart. This is very useful to find strong negotiation price areas and as trend following. Configurations: Day, Week and Month - Show different VWAPs according to the period. You can change each line style on "colors" tab. Any doubt or suggestion please contact us. Enjoy! This is a free indicator, but it took hours to develop. If you want to pay me a coffee, I appreciate a lot   <3 PayPal, Skrill, Nete
FREE
Aggression Volume
Flavio Javier Jarabeck
4.2 (15)
Aggression Volume Indicator is the kind of indicator that is rarely found in the MQL5 community because it is not based on the standard Volume data provided by the Metatrader 5 platform. It requires the scrutiny of all traffic Ticks requested on the platform... That said, Aggression Volume indicator requests all Tick Data from your Broker and processes it to build a very special version of a Volume Indicator, where Buyers and Sellers aggressions are plotted in a form of Histogram. Additionally,
FREE
Weis Wave Scouter Basic
Jean Carlos Martins Roso
Weis Wave Scouter Basic은 MetaTrader 5용으로 설계된 당사의 유명한 인디케이터의 기본 버전으로, Wyckoff 방법론과 VSA(Volume Spread Analysis) 개념을 쉽고 효율적으로 탐색하려는 트레이더를 위해 설계되었습니다. 볼륨 파동 읽기를 기반으로 하여 시장 움직임을 명확하게 식별할 수 있으며, Richard Wyckoff가 가르친 노력 대 결과 및 수요 공급 원칙에 중점을 둡니다. Weis Wave Scouter Basic을 사용하면 기본 색상 테마(Classic)로 상승 및 하락 파동을 직관적인 히스토그램으로 시각화할 수 있어 트렌드 및 반전 해석이 쉬워집니다. Brick Size 및 Volume Scale Factor와 같은 기본 조정을 지원하며, 틱 볼륨 또는 실제 볼륨을 사용할 수 있는 옵션을 제공하여 Forex, 주식, 암호화폐 등 다양한 시장에 적합합니다. 초보자나 간단한 도구를 원하는 트레이더에게 완벽한 Weis Wave Sco
FREE
Fibomathe
Almaquio Ferreira De Souza Junior
Fibomathe Indicator: Support and Resistance Tool for MT5 The Fibomathe Indicator is a technical analysis tool designed for MetaTrader 5 (MT5) that assists traders in identifying support and resistance levels, take-profit zones, and additional price projection areas. It is suitable for traders who use structured approaches to analyze price action and manage trades. Key Features Support and Resistance Levels: Allows users to define and adjust support and resistance levels directly on the chart.
FREE
The Rayol Code Hour Interval Lines indicator was  designed to assist your trading experience.  It  draws the range of hours chosen by the user directly on the chart, so that it enables traders to visualize price movements during their preferred trading hours, providing  traders a more comprehensive view of price movements and market dynamics. This indicator allows the user to choose not only the Broker's time, but also the Local time. This way, the user no longer needs to calculate local time in
FREE
이 제품의 구매자들이 또한 구매함
Trade Assistant MT5
Evgeniy Kravchenko
4.42 (185)
거래당 위험 계산, 라인을 사용한 손쉬운 신규 주문, 부분 청산 기능을 통한 주문 관리, 7가지 유형의 트레일링 스탑 및 기타 유용한 기능을 제공합니다. 추가 자료 및 지침 설치 지침   -   애플리케이션 지침   -   데모 계정용 애플리케이션 평가판 라인 기능       - 차트에 개시선, 손절매, 차익실현을 표시합니다. 이 기능을 사용하면 새로운 주문을 쉽게 하고 개봉 전에 추가 특성을 볼 수 있습니다. 위기 관리       -       위험 계산 기능은 설정된 위험과 손절매 주문의 크기를 고려하여 새 주문의 볼륨을 계산합니다. 이를 통해 손절매 크기를 설정하고 동시에 설정된 위험을 존중할 수 있습니다. 로트 계산 버튼 - 위험 계산을 활성화/비활성화합니다. 필요한 위험 값은 위험 필드에 0에서 100 사이의 백분율 또는 예금 통화로 설정됩니다. 설정 탭에서 위험 계산 옵션을 선택합니다. $ 통화, % 잔액, % 지분, % 자유 마진, % 사용자 정의, % AB 이전
Trade Manager EA에 오신 것을 환영합니다. 이 도구는 거래를 보다 직관적이고 정확하며 효율적으로 만들기 위해 설계된 궁극적인 리스크 관리 도구 입니다. 단순한 주문 실행 도구가 아닌, 원활한 거래 계획, 포지션 관리 및 리스크 제어를 위한 종합 솔루션입니다. 초보자부터 고급 트레이더, 빠른 실행이 필요한 스캘퍼에 이르기까지 Trade Manager EA는 외환, 지수, 상품, 암호화폐 등 다양한 시장에서 유연성을 제공합니다. Trade Manager EA를 사용하면 복잡한 계산은 이제 과거의 일이 됩니다. 시장을 분석하고 진입, 손절 및 익절 수준을 차트의 수평선으로 표시한 후 리스크를 설정하면, Trade Manager가 이상적인 포지션 크기를 즉시 계산하고 SL 및 TP 값을 실시간으로 표시합니다. 모든 거래가 간편하게 관리됩니다. 주요 기능: 포지션 크기 계산기 : 정의된 리스크에 따라 거래 크기를 즉시 결정합니다. 간단한 거래 계획 : 진입, 손절, 익절을 위한
EasyInsight AIO MT5
Alain Verleyen
5 (5)
EASY Insight AIO – 스마트하고 손쉬운 트레이딩을 위한 올인원 솔루션 개요 외환, 금, 암호화폐, 지수, 심지어 주식까지 — 전 시장을 몇 초 만에, 수동 차트 확인이나 복잡한 설치, 인디케이터 설정 없이 스캔할 수 있다고 상상해 보세요. EASY Insight AIO 는 AI 기반 트레이딩을 위한 궁극의 플러그 앤 플레이(Plug & Play) 데이터 내보내기 도구입니다. 단 하나의 깔끔한 CSV 파일로 전체 시장 스냅샷을 제공하며, ChatGPT, Claude, Gemini, Perplexity 등 다양한 AI 플랫폼에서 즉시 분석할 수 있습니다. 창 전환, 복잡함, 차트 오버레이는 더 이상 필요 없습니다. 자동으로 내보내지는 순수하고 구조화된 데이터 인사이트만으로, 반복적인 차트 감시 대신 데이터 기반의 스마트한 의사결정에 집중할 수 있습니다. 왜 EASY Insight AIO인가요? 진정한 올인원 • 별도의 설정, 인디케이터 설치, 차트 오버레이가 필요 없습
Local Trade Copier EA MT5
Juvenille Emperor Limited
4.98 (91)
Local Trade Copier EA MT5 를 사용하여 매우 빠른 거래 복사 경험을 해보세요. 1분 안에 간편하게 설정할 수 있으며, 이 거래 복사기를 사용하면 Windows 컴퓨터 또는 Windows VPS에서 여러 개의 MetaTrader 터미널 간에 거래를 0.5초 미만의 초고속 복사 속도로 복사할 수 있습니다. 초보자든 전문가든   Local Trade Copier EA MT5 는 다양한 옵션을 제공하여 사용자의 특정 요구에 맞게 맞춤 설정할 수 있습니다. 이는 수익 잠재력을 높이려는 모든 사람을 위한 최고의 솔루션입니다. 지금 사용해보시고 이것이 왜 시장에서 가장 빠르고 쉬운 무역용 복사기인지 알아보세요! 팁: 여기 에서 데모 계정에서 Local Trade Copier EA MT5 데모 버전을 다운로드하여 사용해 볼 수 있습니다. 다운로드한 무료 데모 파일을 MT5 >> File >> Open Data Folder >> MQL5 >> Experts 폴더에 붙여넣고 터
TradePanel MT5
Alfiya Fazylova
4.84 (134)
Trade Panel은 다기능 거래 보조원입니다. 이 애플리케이션에는 수동 거래를 위한 50개 이상의 거래 기능이 포함되어 있으며 대부분의 거래 작업을 자동화할 수 있습니다. 전략 테스터에서는 애플리케이션이 작동하지 않습니다. 구매하기 전에 데모 계정에서 데모 버전을 테스트할 수 있습니다. 데모 버전 여기 . 전체 지침 여기 . 거래. 한 번의 클릭으로 거래 작업을 수행할 수 있습니다: 자동 위험 계산을 통해 지정가 주문 및 포지션을 엽니다. 한 번의 클릭으로 여러 주문과 포지션을 열 수 있습니다. 주문 그리드를 엽니다. 그룹별 대기 주문 및 포지션을 마감합니다. 포지션 반전(매수 청산 후 매도 개시 또는 매도 청산 후 매수 개시). 포지션 고정(매수 포지션과 매도 포지션의 양을 동일하게 하는 추가 포지션 개설). 한 번의 클릭으로 모든 포지션을 부분 청산합니다. 모든 포지션의 이익실현과 손절매를 동일한 가격 수준으로 설정합니다. 모든 포지션에 대한 손절매를 해당 포지션의 손익 분기
Telegram To MT5 Receiver
Levi Dane Benjamin
4.77 (13)
가입한 모든 채널에서 (개인 및 제한된 채널 포함) 시그널을 바로 MT5로 복사합니다.   이 도구는 사용자를 고려하여 설계되었으며 거래를 관리하고 모니터하는 데 필요한 많은 기능을 제공합니다. 이 제품은 사용하기 쉽고 시각적으로 매력적인 그래픽 인터페이스로 제공됩니다. 설정을 사용자 정의하고 제품을 몇 분 안에 사용할 수 있습니다! 사용자 가이드 + 데모  | MT4 버전 | 디스코드 버전 데모를 시도하려면 사용자 가이드로 이동하십시오. Telegram To MT5 수신기는 전략 테스터에서 작동하지 않습니다! Telegram To MT5 특징 여러 채널에서 동시에 신호를 복사합니다. 개인 및 제한된 채널에서 신호를 복사합니다. Bot 토큰이나 채팅 ID가 필요하지 않습니다.   (원하는 경우에는 사용할 수 있습니다) 위험 % 또는 고정된 로트로 거래합니다. 특정 심볼을 제외합니다. 모든 신호를 복사할지 또는 복사할 신호를 사용자 정의할지 선택할 수 있습니다. 모든 신호를 인
Grid Manual MT5
Alfiya Fazylova
4.89 (18)
"Grid Manual"은 주문 그리드 작업을 위한 거래 패널입니다. 이 유틸리티는 보편적이며 유연한 설정과 직관적인 인터페이스를 제공합니다. 그것은 손실을 평균화하는 방향뿐만 아니라 이익을 증가시키는 방향으로 주문 그리드와 함께 작동합니다. 거래자는 주문 그리드를 만들고 유지할 필요가 없으며 유틸리티에서 수행합니다. 거래자가 주문을 시작하는 것으로 충분하며 "Grid Manual"는 자동으로 그를 위한 주문 그리드를 생성하고 거래가 마감될 때까지 그와 동행할 것입니다. 전체 설명 및 데모 버전 여기 . 유틸리티의 주요 기능: 모바일 터미널을 포함하여 어떤 방식으로든 열린 주문과 함께 작동합니다. "제한" 및 "중지"의 두 가지 유형의 그리드와 함께 작동합니다. 고정 및 동적(ATR 표시기 기반)의 두 가지 유형의 그리드 간격 계산과 함께 작동합니다. 오픈 오더 그리드의 설정을 변경할 수 있습니다. 차트에서 각 주문 그리드의 손익분기점 수준을 표시합니다. 각 주문 그리드에 대한 이익
The product will copy all telegram signal to MT5 ( which you are member) , also it can work as remote copier.  Easy to set up, copy order instant, can work with almost signal formats, image signal,  s upport to translate other language to English Work with all type of channel or group, even channel have "Restrict Saving Content", work with  multi channel, multi MT5 Work as remote copier: with signal have ticket number, it will copy exactly via ticket number. Support to backtest signal. How to s
Trade Dashboard MT5
Fatemeh Ameri
4.95 (77)
Tired of complex order placement and manual calculations? Trade Dashboard is your solution. With its user-friendly interface, placing orders becomes effortless, by a single click, you can open trades, set stop loss and take profit levels, manage trade lot size, and calculate risk to reward ratios, allowing you to only focus on your strategy. Say goodbye to manual calculations and streamline your trading experience with Trade Dashboard. Download  Demo Version  right now. You can find  Details of
Exp COPYLOT CLIENT for MT5
Vladislav Andruschenko
3.91 (32)
MT5용 트레이드 복사기는 metaТrader 5 플랫폼용 트레이드 복사기입니다   . 그것은 사이의   외환 거래를 복사합니다       모든 계정   COPYLOT MT5 버전의 경우   MT5   -   MT5, MT4   -   MT5 (또는 COPYLOT MT4 버전의 경우   MT4 -   MT4 MT5   -  MT4) 믿을 수 있는 복사기! MT4 버전 전체 설명   +DEMO +PDF 구입 방법 설치하는 방법     로그 파일을 얻는 방법     테스트 및 최적화 방법     Expforex의 모든 제품 МТ4 터미널에서 거래를 복사할 수도 있습니다(   МТ4   -   МТ4, МТ5   -   МТ4   ):   COPYLOT CLIENT for MT4 이 버전은 МТ5   -   МТ5, МТ4   -   МТ5   터미널 간을 포함합니다. 거래 복사기는 2/3/10 터미널 사이의 거래/포지션을 복사하기 위해 만들어졌습니다. 데모 계정 및 투자 계정에서
EasyInsight MT5
Alain Verleyen
5 (3)
EASY Insight – 더 스마트한 트레이딩, 여기서 시작하세요 개요 만약 단 몇 초 만에 외환, 금, 암호화폐, 지수, 심지어 주식 시장까지 전체를 수동 차트 확인 없이 스캔할 수 있다면 어떨까요? EASY Insight 는 인디케이터 데이터를 실행 가능한 트레이딩 인사이트로 바꿔주는 AI 준비형 데이터 내보내기 도구입니다. 추측이나 복잡한 시각적 혼란에 더 이상 시간을 낭비하고 싶지 않은 트레이더를 위해 개발되었으며, 하나의 깔끔한 CSV 파일로 전체 시장 스냅샷을 제공합니다. 이것이야말로 완전히 새로운 차원의 트레이딩입니다. 끝없는 창 전환도, 복잡한 차트 오버레이도 없습니다. 여러분이 이미 잘 알고 있는 도구(FX Power (FXP), FX Volume (FXV), FX Dynamic (FXD), FX Levels (FXL), 그리고 비외환 자산용 IX Power (IXP))에서 얻는 구조화된 순수 인사이트만을 제공합니다. 더욱 편리함을 원한다면, EASY Insig
Trade Manager DaneTrades
Levi Dane Benjamin
4.31 (26)
거래 관리자는 위험을 자동으로 계산하는 동시에 거래를 빠르게 시작하고 종료하는 데 도움을 줍니다. 과잉 거래, 복수 거래 및 감정 거래를 방지하는 데 도움이 되는 기능이 포함되어 있습니다. 거래를 자동으로 관리할 수 있으며 계정 성과 지표를 그래프로 시각화할 수 있습니다. 이러한 기능은 이 패널을 모든 수동 거래자에게 이상적으로 만들고 MetaTrader 5 플랫폼을 향상시키는 데 도움이 됩니다. 다중 언어 지원. MT4 버전  |  사용자 가이드 + 데모 트레이드 매니저는 전략 테스터에서 작동하지 않습니다. 데모를 보려면 사용자 가이드로 이동하세요. 위기 관리 % 또는 $를 기준으로 위험 자동 조정 고정 로트 크기 또는 거래량과 핍을 기반으로 한 자동 로트 크기 계산을 사용하는 옵션 RR, Pips 또는 Price를 사용한 손익분기점 손실 설정 추적 중지 손실 설정 목표 달성 시 모든 거래를 자동으로 마감하는 최대 일일 손실률(%)입니다. 과도한 손실로부터 계정을 보호하고 과도한
Trade copier MT5
Alfiya Fazylova
4.55 (31)
Trade Copier는 거래 계정 간의 거래를 복사하고 동기화하도록 설계된 전문 유틸리티입니다. 복사는 공급자의 계정/단말기에서 동일한 컴퓨터 또는 vps에 설치된 수신자의 계정/단말기로 발생합니다. 구매하기 전에 데모 계정에서 데모 버전을 테스트할 수 있습니다. 데모 버전 여기 . 전체 지침 여기 . 주요 기능 및 이점: 복사기는 "МТ5> МТ5", "МТ4> МТ5", "МТ5> МТ4" 복사를 지원합니다. 복사기는 데모 계정 > 실 계정, 실 계정 > 데모 계정, 데모 계정 > 데모 계정 및 실제 계정 > 실 계정 복사를 지원합니다. 복사기는 읽기 전용 암호가 적용된 투자자 계정에서 복사를 지원합니다. 하나의 공급자 터미널은 여러 수신 터미널로 트랜잭션을 보낼 수 있고 하나의 수신 터미널은 여러 공급자 터미널에서 트랜잭션을 수신할 수 있습니다. 복사기는 귀하 또는 귀하의 고문이 거래하는 동일한 터미널에서 작동할 수 있습니다. 높은 복사 속도(0.5초 미만). 복사기에는 간편
All in one Keylevel
Trinh Minh Tung
5 (1)
Instead of sticking to the Charts,let's use ALL IN ONE KEYLEVEL Announcement: We are pleased to announce the latest version 14.02 of the One In One Keylevel product. This is a reliable product that has been upgraded with many new features and improvements to make your work easier and more efficient. Currently, we have a special promotion for this new version. The current discounted price is $500, and there are only 32 units left. After that, the price will increase to $1000, and will continue to
Custom Alerts: 여러 시장을 동시에 모니터링하고 중요한 기회를 놓치지 마세요 개요 Custom Alerts 는 여러 종목에서 발생하는 잠재적 세트업을 중앙 집중 방식으로 추적하고자 하는 트레이더를 위한 역동적인 솔루션입니다. FX Power, FX Volume, IX Power 등 주요 도구들의 데이터를 통합하여 Custom Alerts 는 여러 차트를 번갈아 보거나 중요한 기회를 놓칠 위험 없이, 시장의 중요 변화를 자동으로 알려 줍니다. 보다 스마트하고 효율적인 트레이딩을 원하신다면, Custom Alerts 를 통해 모니터링 능력을 한 단계 끌어올려 보세요. 1. 왜 Custom Alerts가 트레이더에게 매우 유용한가 올인원 시장 모니터링 • Custom Alerts 는 8대 주요 통화, 골드, 그리고 최대 7개의 지수 혹은 상품을 포함한 다양한 종목의 신호를 수집 및 통합합니다. • 여러 차트를 계속 전환할 필요 없이 명확하고 집중된 알림을 받아 볼 수 있
Trade Assistant 38 in 1
Makarii Gubaydullin
4.9 (21)
다기능 도구: 로트 계산기, 가격 조치, R/R 비율, 무역 관리자, 공급 및 수요 영역을 포함한 65개 이상의 기능 데모 버전   |   사용자 매뉴얼   |   MT4 버전 이 유틸리티는 전략 테스터에서 작동하지 않습니다.   여기에서 데모   버전을 다운로드하여 제품을 테스트할 수 있습니다. 질문/개선 아이디어가 있는 경우/버그가 발견된 경우   저에게 연락 하십시오. 거래 프로세스를 간소화, 가속화 및 자동화하십시오. 이 대시보드로 표준 터미널 기능을 확장하십시오. 유틸리티는 외환, 주식, 지수, 암호화폐 등 모든 거래 수단에서 작동합니다. 1. 새로운 거래 열기 : 로트/리스크/RR 계산: 1. Lot 계산기 (리스크 규모에 따른 거래량 계산) 2. 리스크 계산기 (로트 규모에 따른 리스크 금액) 3. 위험/보상 비율(RR) 4. 주문에 대한 활성화 트리거 + StopLimit 구매 / StopLimit 판매 5. 가상 SL / TP 레벨 (숨겨진 SL, TP: 브로커에게
Telegram to MT5 Coppy
Sergey Batudayev
4.83 (6)
Telegram에서 MT5로:   최고의 신호 복사 솔루션 DLL 없이도 Telegram 채널과 채팅에서 MetaTrader 5 플랫폼으로 거래 신호를 직접 복사하는 최신 도구인 Telegram to MT5를 사용하여 거래를 간소화하세요. 이 강력한 솔루션은 정밀한 신호 실행, 광범위한 사용자 정의 옵션을 제공하고 시간을 절약하며 효율성을 높여줍니다. [지침   ] [   데모   ] 주요 특징 직접 Telegram API 통합 전화번호와 보안 코드를 통해 인증하세요. 사용자 친화적인 EXE 브리지를 통해 채팅 ID를 쉽게 관리하세요. 여러 채널/채팅을 추가, 삭제, 새로 고침하여 동시에 신호를 복사합니다. 고급 필터를 사용한 신호 파싱 예외 단어(예: "보고서", "결과")가 포함된 원치 않는 신호를 건너뜁니다. 유연한 SL 및 TP 형식을 지원합니다: 가격, 핍 또는 포인트. 가격 대신 포인트를 지정하는 신호에 대한 진입 포인트를 자동으로 계산합니다. 주문 맞춤화 및 유연성 고정
EasyTrade MT5
Alain Verleyen
5 (2)
Easy Trade – 스마트하고 간단하며 강력한 트레이드 관리 Easy Trade는 리스크를 철저히 관리하고 실행을 더욱 원활하게 하려는 MetaTrader 사용자들을 위한 올인원 트레이드 관리 솔루션입니다. 트레이더들의 피드백을 바탕으로 처음부터 설계된 Easy Trade는 여러 종목의 거래를 간단하게 실행, 모니터링 및 관리할 수 있도록 하며, 작업 흐름을 복잡하게 만들지 않습니다. 수동 스캘핑이든, 소규모 전략 포트폴리오 관리든, Easy Trade는 트레이더가 현명한 판단과 안정적인 수익에 집중할 수 있도록 돕습니다. ⸻ Easy Trade를 사용해야 하는 이유 정밀한 리스크 관리: 고정 로트 또는 퍼센트 기반 리스크 설정 가능. 실시간 리스크 및 수익률 정보 제공. 바스켓 기반 트레일링: 여러 거래의 수익을 모니터링하고 목표 달성 시 이익을 부분 확정 가능. 군집 진입에 이상적. 거래 캡처: 각 거래를 스크린샷으로 기록 가능 – 트레이딩 저널 및 성과 분석에 적합.
MT5 to Telegram Signal Provider 는 사용하기 쉽고 완전히 커스터마이즈 가능한 유틸리티로, 특정 신호를 Telegram의 채팅, 채널 또는 그룹으로 전송하고, 귀하의 계정을 신호 제공자 로 만듭니다. 경쟁 제품과 달리 DLL 임포트를 사용하지 않습니다. [ 데모 ] [ 매뉴얼 ] [ MT4 버전 ] [ 디스코드 버전 ] [ 텔레그램 채널 ] 설정 단계별 사용자 가이드 가 제공됩니다. 텔레그램 API에 대한 지식은 필요하지 않습니다; 개발자가 제공하는 모든 것이 필요합니다. 주요 특징 구독자에게 보낸 주문 상세 정보를 커스터마이즈할 수 있습니다. 예를 들어, 브론즈, 실버, 골드와 같은 계층 구독 모델을 만들 수 있습니다. 골드 구독에서는 모든 신호를 받습니다. id, 심볼, 또는 코멘트로 주문을 필터링할 수 있습니다. 주문이 실행된 차트의 스크린샷이 포함됩니다 보낸 스크린샷에 닫힌 주문을 그려 추가 검증을 합니다 새 주문 메시지를 보내기 전에 포지션을 조정할
Seconds Chart MT5
Boris Sedov
4.56 (16)
Seconds Chart — MetaTrader 5에서 초 단위 차트를 생성하는 독특한 도구입니다. Seconds Chart 를 사용하면 초 단위로 설정된 타임프레임으로 차트를 작성할 수 있어, 표준 분 또는 시간 단위 차트에서는 불가능한 유연성과 정밀한 분석이 가능합니다. 예를 들어, S15 타임프레임은 15초 동안의 캔들로 구성된 차트를 의미합니다. 사용자 정의 심볼을 지원하는 모든 인디케이터와 전문가 어드바이저를 사용할 수 있습니다. 이를 사용하는 것은 표준 차트에서 거래하는 것만큼 편리합니다. 표준 도구와 달리, Seconds Chart 는 초고속 타임프레임에서도 높은 정확도와 지연 없이 작업할 수 있도록 지원합니다. Seconds Chart의 장점 1초부터 900초까지 의 타임프레임 지원. 내장 틱 데이터베이스 덕분에 역사 데이터 즉시 로딩 . 실시간 데이터 업데이트로 지연이나 차이 없음 . 여러 초 단위 차트를 동시에 생성 가능. Seconds Chart가 이상적인 경우
Take a Break MT5
Eric Emmrich
4.83 (23)
The most advanced news filter on MQL market - free demo available Take a Break has transformed from a basic news filter into a comprehensive account protection solution. It seamlessly pauses any other Expert Advisors during news events or based on your custom filters, all while safeguarding your EA settings - restoring them automatically when trading resumes for complete peace of mind. Typical use cases: A single news filter for all your EAs. Stop trading during news/high volatility (+ close all
OrderManager MT5
Lukas Roth
4.82 (22)
OrderManager   소개: MT5용 혁신적인 유틸리티 MetaTrader 5용 새로운 Order Manager 유틸리티를 통해 전문가처럼 거래를 관리하세요. 단순성과 사용 편의성을 염두에 두고 설계된 Order Manager는 각 거래와 관련된 위험을 쉽게 정의하고 시각화할 수 있습니다. 이를 통해 보다 효과적인 결정을 내리고 거래 전략을 최적화할 수 있습니다. OrderManager에 대한 자세한 정보는 매뉴얼을 참조하십시오. [ 매뉴얼 ] [ MT4 버전 ] [ 텔레그램 채널 ] 주요 특징: 위험 관리: 거래의 위험을 빠르고 쉽게 정의하여 더 나은 결정을 내리고 거래 성능을 향상시킵니다. 시각적 표현: 열린 포지션을 명확하고 간결하게 이해하기 위해 거래와 관련된 위험을 그래픽으로 볼 수 있습니다. 주문 수정: 몇 번의 클릭만으로 주문을 쉽게 수정하거나 닫아, 거래 과정을 간소화하고 소중한 시간을 절약합니다. 손끝의 뉴스: 한 번의 터치로 최신 시장 뉴스를 얻어 항상 정보
Advanced trading tool: One click smart orders that execute under your conditions Developed by trader for trading community:  position size calculator (lot size), open position after price action, strategy builder, set and forget trading, mobile notifications... Risk Management -  Risk percentage position size calculator, gain percentage, target risk reward ratio, spread and commissions are included in calculations 7 Advanced order types  - Set and forget trading with price action automation (OC
KT Equity Protector MT5
KEENBASE SOFTWARE SOLUTIONS
4.67 (3)
쉽고 간편하게 거래 자본을 보호하세요 거래 자본을 보호하는 것은 자본을 키우는 것만큼 중요합니다. KT Equity Protector는 귀하의 개인 리스크 매니저로서, 계좌의 순자산(에퀴티)을 지속적으로 모니터링하며, 사전에 설정한 손절 또는 수익 목표에 도달하면 모든 보유 및 예약 주문을 자동으로 종료하여 손실을 방지하거나 수익을 고정합니다. 감정적인 결정이나 추측은 이제 그만—KT Equity Protector가 24시간 내내 믿을 수 있는 자본 보호를 제공합니다. KT Equity Protector는 모든 차트를 자동으로 닫아 다른 전문가용 자동매매 프로그램(EA)의 거래를 중단시킬 수 있습니다. 이를 통해 EA를 수동으로 다시 시작할 때까지 어떠한 추가 거래도 이루어지지 않으며, 사용자는 완전한 통제권과 심리적 안정을 얻게 됩니다. 작동 방식 에퀴티 손절(손실 방지): 예를 들어 계좌 잔고가 $10,000이고 에퀴티 손절을 $1,000로 설정한 경우, 순자산이 $9,000로
DrawDown Limiter
Haidar, Lionel Haj Ali
5 (20)
Drawdown Limiter EA You are in the right place if you were searching for Drawdown control, Drawdown limiter, Balance protection, Equity Protection or Daily Drawdown Limit related to Prop Firm, FTMO, or Funded account trading, or if you want to protect your trading account. Have you suffered from controlling your drawdown when trading funded accounts? This EA is meant for you. Prop firms usually set a rule called “Trader Daily Drawdown”, and if it is not respected, you are disqualified.  I am an
Cerberus Equity Watcher
Samuel Bandi Roccatello
5 (3)
Cerberus the Equity Watcher는 귀하의 계정 자산을 지속적으로 모니터링하고 잘못된 EA 또는 재량 트레이더인 경우 감정적 행동으로 인해 발생하는 주요 손실을 방지하는 위험 관리 도구입니다. 버그가 있을 수 있거나 예상치 못한 시장 상황에서 잘 수행되지 않을 수 있는 EA에 의존하는 체계적 거래자에게 매우 유용합니다. Cerberus를 사용하면 최소 자산 가치와 (선택적으로) 최대 가치를 설정할 수 있습니다. 둘 중 하나에 도달하면 모든 위치가 평평해지고 모든 보류 중인 주문이 닫히고 모든 EA가 "죽습니다". 모든 위치를 평평하게 하면 알림이 사용자 휴대폰으로 전송되고 명확한 메시지가 화면에 표시됩니다. "평평화" 이후에 Cerberus는 주식 가치를 계속 주시하고 다시 초기화될 때까지 추가 거래 시도를 중단합니다. Cerberus가 수행하는 모든 작업은 화면에 명확하게 표시되고 Expert Advisor 탭에 보고되며 사용자에게 알림이 전송됩니다. 사용자의 실수
Everything for chart Technical Analysis indicator MT5 in one tool Draw your supply demand zone with rectangle and support resistance with trendline and get alerts to mobile phone or email alert -  Risk reward indicator mt5 Video tutorials, manuals, DEMO download   here .   Find contacts on my   profile . 1.   Extended rectangles and trendlines Object will be extended to the right edge of the chart when price will draw new candles on chart. This is rectangle extender or trendline extender. 2. Pri
************************************************************************************************************************************** GoldMine Train은 Gold를 위한 트렌드 트레이딩 전략 EA입니다. 운영자는 주요 트렌드 방향을 결정하고 Train에 이동을 지시합니다. Train은 해당 방향으로 지속적으로 매수/매도를 합니다. Lot 볼륨은 계정 잔액과 사전 설정된 레버리지 비율에 따라 달라집니다. 운영자가 트렌드 방향을 변경하면 Train이 멈추고 이익을 잠급니다. 사용자는 차트의 버튼을 사용하여 트렌드 방향을 쉽게 선택할 수 있습니다. ******************************* ***************** ********************** ***************** ********************** *********
Trader Evolution
Siarhei Vashchylka
5 (6)
" Trader Evolution " - A utility designed for traders who use wave and technical analysis in their work. One tab of the utility is capable of money management and opening orders, and the other can help in making Elliott wave and technical analysis. Manual (Be sure to read before purchasing) | Version for MT4 Advantages 1. Trading in a few clicks. Immediate and pending orders are available in the panel 2. Money management. The program automatically selects the appropriate lot size 3. Simplifies
*** Entry In The Zone and SMC Multi Timeframe   은 Smart Money Concept (SMC)을 기반으로 한   실시간 시장 분석 도구 입니다. 이 도구는   반전 신호 와 **다중 시간대 구조 감지(Multi-Timeframe Structure Detection)**를 통합하여 주요 반전 구역(POI)을 자동으로 식별합니다. 이를 통해 트레이더가   더 체계적이고 자신감 있게 거래 계획과 결정을 내릴 수 있도록 지원 합니다. 주요 기능: - 자동 시장 구조 감지 (BOS  CHoCH, mBOS  mCHoCH) - Order Blocks, 공급 & 수요 구역, Fair Value Gaps (FVG) 식별 - 유동성 구역, Premium  Discount 영역, Equal Highs & Lows - 주요 관심 구역 (POI) - 거래 세션 시간 분석 (도쿄, 런던, 뉴욕) - 사용자 맞춤 자동 -계산 및 하이라이팅대시보드 -  신호 재도색 없
제작자의 제품 더 보기
Touch VWAP MT4
Danrlei Hornke
5 (2)
O Touch VWAP é um indicador que permite calcular uma Média Ponderada por Volume (VWAP) apenas apertando a tecla 'w' no seu teclado e após clicando no candle do qual deseja realizar o calculo, clicando abaixo do candle é calculada a VWAP baseado na minima dos preços com o volume, clicando sobre o corpo do candle é calculado uma VWAP sobre o preço medio com o volume e clicando acima do candle é calculado uma VWAP baseado na máxima dos preços com o volume, voce tambem tem a opção de remover a VWAP
FREE
The Stochastic RSI (StochRSI) is a technical indicator that combines the characteristics of the Relative Strength Index (RSI) with the Stochastic Oscillator, resulting in a more sensitive tool that generates a higher number of trading signals. Developed by Tushar Chande and Stanley Kroll, the indicator was designed to overcome a perceived limitation of the traditional RSI: the low frequency of overbought and oversold levels activation (commonly 80 and 20), especially in less volatile assets. Ho
FREE
Touch VWAP MT5
Danrlei Hornke
4.67 (3)
O Touch VWAP é um indicador que permite calcular uma Média Ponderada por Volume (VWAP) apenas apertando a tecla 'w' no seu teclado e após clicando no candle do qual deseja realizar o calculo, clicando abaixo do candle é calculada a VWAP baseado na minima dos preços com o volume, clicando sobre o corpo do candle é calculado uma VWAP sobre o preço medio com o volume e clicando acima do candle é calculado uma VWAP baseado na máxima dos preços com o volume, voce tambem tem a opção de remover a VWAP
FREE
O Afastamento da Média Móvel, é uma poderosa ferramenta de análise técnica projetada para fornecer uma representação visual do afastamento entre o preço atual e uma média móvel específica. Este indicador, desenvolvido para o MetaTrader, oferece aos traders uma perspectiva clara das mudanças na dinâmica de preço em relação à tendência de médio prazo. Versão MT4:  https://www.mql5.com/pt/market/product/111705
FREE
Free indicator, that displays the remaining time until the current candle closes directly on the chart. Designed for traders who demand precision and timing, this lightweight and fully customizable tool enhances your trading experience. It is easy to install, compatible with all assets, markets, and timeframes, and provides real-time updates to support smarter decision-making.
FREE
Indicador que calcula e exibe dois níveis de preço: o preço médio das posições atualmente abertas e o preço de cobertura, definido como o preço necessário para zerar ou manter o lucro acumulado em determinado período. O cálculo do preço médio considera o volume e o preço de entrada das operações abertas, enquanto o preço de cobertura é ajustado dinamicamente conforme o lucro ou prejuízo realizado e não realizado no período analisado. Versão MT5:  https://www.mql5.com/pt/market/product/139405
FREE
Indicador que calcula e exibe dois níveis de preço: o preço médio das posições atualmente abertas e o preço de cobertura, definido como o preço necessário para zerar ou manter o lucro acumulado em determinado período. O cálculo do preço médio considera o volume e o preço de entrada das operações abertas, enquanto o preço de cobertura é ajustado dinamicamente conforme o lucro ou prejuízo realizado e não realizado no período analisado. Versão MT4:  https://www.mql5.com/pt/market/product/139409
FREE
Chart Control MT5
Danrlei Hornke
5 (1)
O Chart Control é um indicador que permite de forma rapida e pratica alterar o timeframe e ativo do grafico, possibilitando que voce possa fazer todas as suas analises em apenas um grafico sem precisar abrir vários, além disso voce pode escolher o entre os temas claro e escuro para o qual melhor se adapta a sua preferencia. MT4:  https://www.mql5.com/pt/market/product/112155  
FREE
The Stochastic RSI (StochRSI) is a technical indicator that combines the characteristics of the Relative Strength Index (RSI) with the Stochastic Oscillator, resulting in a more sensitive tool that generates a higher number of trading signals. Developed by Tushar Chande and Stanley Kroll, the indicator was designed to overcome a perceived limitation of the traditional RSI: the low frequency of overbought and oversold levels activation (commonly 80 and 20), especially in less volatile assets. How
FREE
O Afastamento da Média Móvel, é uma poderosa ferramenta de análise técnica projetada para fornecer uma representação visual do afastamento entre o preço atual e uma média móvel específica. Este indicador, desenvolvido para o MetaTrader, oferece aos traders uma perspectiva clara das mudanças na dinâmica de preço em relação à tendência de médio prazo. Versão MT5:  https://www.mql5.com/pt/market/product/111704
FREE
O indicador é uma ferramenta desenvolvida para o MetaTrader, projetada para auxiliar na análise detalhada do comportamento do preço em relação a uma média móvel específica. Ao ser anexado ao timeframe diário, o ele realiza cálculos e monitora, em timeframes menores, quantas vezes o preço toca determinados níveis de afastamento durante o dias além de calcular a média dos toques. MT4:  https://www.mql5.com/pt/market/product/111706
FREE
O indicador é uma ferramenta desenvolvida para o MetaTrader, projetada para auxiliar na análise detalhada do comportamento do preço em relação a uma média móvel específica. Ao ser anexado ao timeframe diário, o ele realiza cálculos e monitora, em timeframes menores, quantas vezes o preço toca determinados níveis de afastamento durante o dias além de calcular a média dos toques. MT5:  https://www.mql5.com/pt/market/product/111710
FREE
Chart Control MT4
Danrlei Hornke
5 (1)
O Chart Control é um indicador que permite de forma rapida e pratica alterar o timeframe e ativo do grafico, possibilitando que voce possa fazer todas as suas analises em apenas um grafico sem precisar abrir vários, além disso voce pode escolher o entre os temas claro e escuro para o qual melhor se adapta a sua preferencia. MT5:  https://www.mql5.com/pt/market/product/109444
FREE
Stochastic Slow
Danrlei Hornke
Stochastic: It was developed by George Lane in the early 1950s. It is based on the principle that the price closes close to the maximum if the asset is on an uptrend, and close to the minimum if it is on a downtrend. Following the idea of the inercial movement of prices. This indicator can generate possible signals of overbought moments or about asset sales. In a usual way it can used according to some standards; Slow Stochastic: A moving average of 3 periods is calculated on the stochastic in
Larry Williams
Danrlei Hornke
Created by trader and journalist Larry Williams, Setup 9.1 is a simple strategy that is easy to understand and execute, which is why it is so well known and popular in the world of traders and technical analysis. It is a REVERSION setup, where operations are sought when the moving average changes direction. Setup Logic With the open candlestick chart, at any time chart, it is only necessary to add the 9-period Exponential Moving Average (MME9). That done, we look for assets in which the MME9
Keltner Channels (ou   Canais de Keltner ) é mais um indicador de   volatilidade   utilizado pela   análise técnica. Também chamado de   envelope , esse canal foi criado por Chester Keltner para monitorar os seus investimentos no mercado futuro de café na década de 1960. Porém, com o passar do tempo, passou também a ser utilizado para outros ativos e, atualmente, é uma das ferramentas mais utilizadas pelos traders. Nesta versão customizada foram adicionados novas opções de método de média movel
A Média Móvel é um indicador que faz parte da Análise Técnica. Com ela, é possível identificar o equilíbrio dos preços no mercado, observando tendências de alta, neutra ou baixa. Este indicador customizado traz opções extras pera definir o método de cálculo podendo-se esclolher entre SMA,EMA,SSMA,LWMA,JJMA,JurX,ParMA,T3,Vidya,AMA,HULL MA. Também conta com varias opções para escolher o método de cálculo para o preço base a ser usado no cáculo da média.
필터:
Flavio Machado
1792
Flavio Machado 2025.01.24 21:43 
 

사용자가 평가에 대한 코멘트를 남기지 않았습니다

Danrlei Hornke
3685
개발자의 답변 Danrlei Hornke 2025.01.27 11:36
Obrigado, fico feliz que a ferramenta tenha utilidade para voce.
리뷰 답변