• 미리보기
  • 리뷰
  • 코멘트 (2)

AutoChannels

  • "수동 채널 그리기? 더 이상은 아닙니다. 시장 구조가 자동으로 드러나게 하세요."

  • "장기 가격대를 연중무휴 24시간 실시간으로 추적하세요."

❓ 실제 트레이더의 고충

  • 피벗 포인트를 수동으로 식별하려면 시간과 노력이 많이 듭니다.

  • 적응하기 어려움 높은 변동성 및 정확한 신뢰할 수 있는 채널

💡 아이디어 복사

  • "시장은 잠들지 않습니다. 왜 분석을 멈춰야 할까요?"

  • "하루에 수십 개의 자산을 어떻게 관리하고 계신가요?"

🔥 핵심 주장

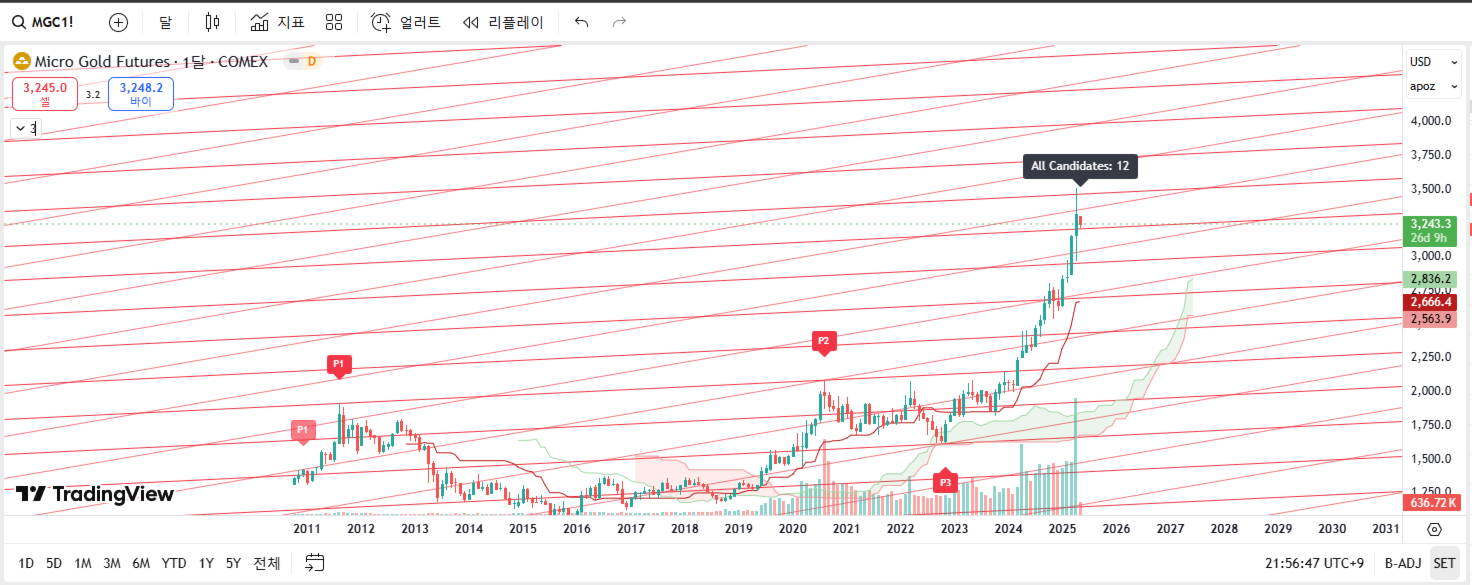
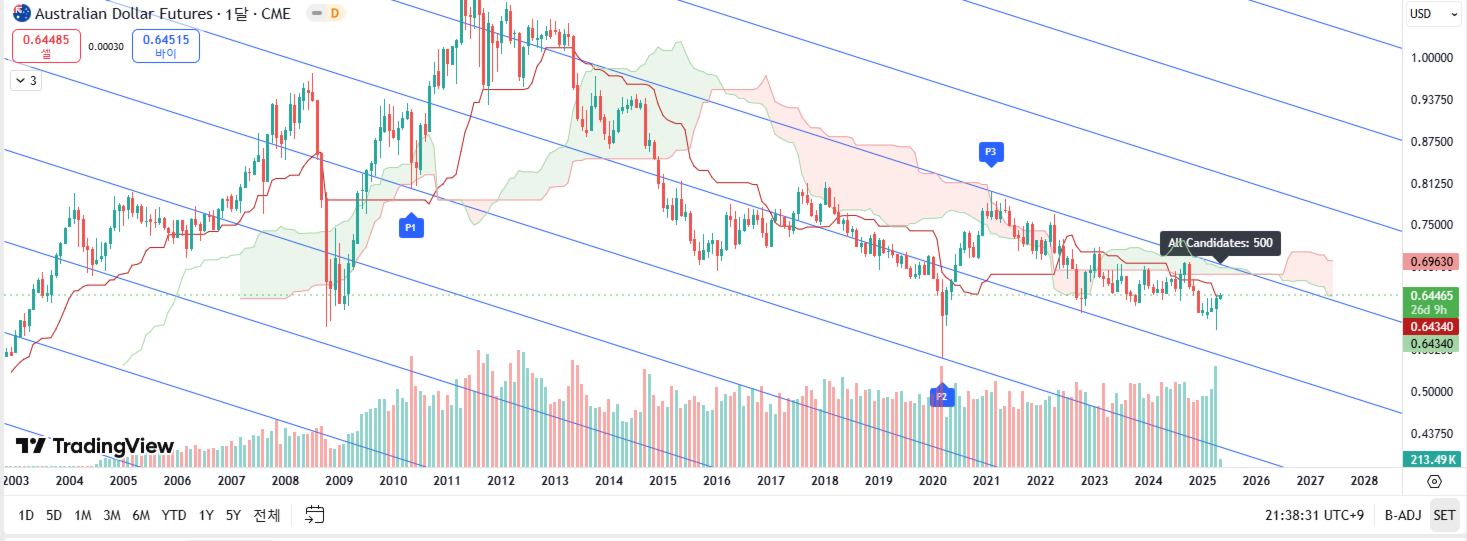
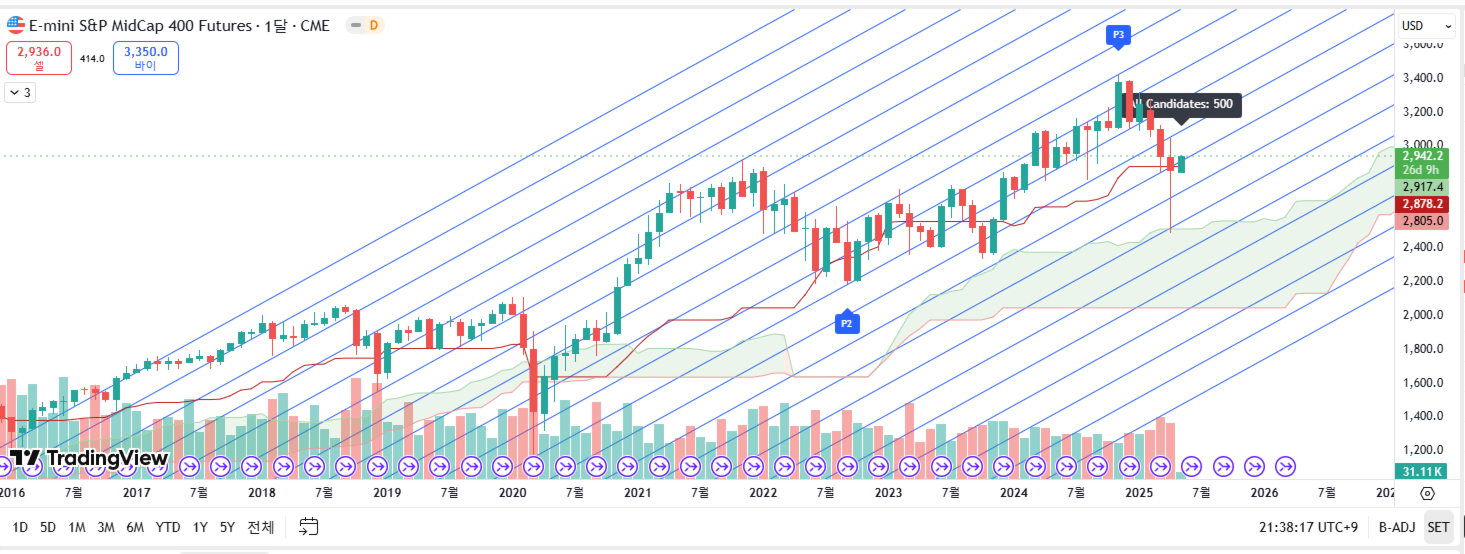
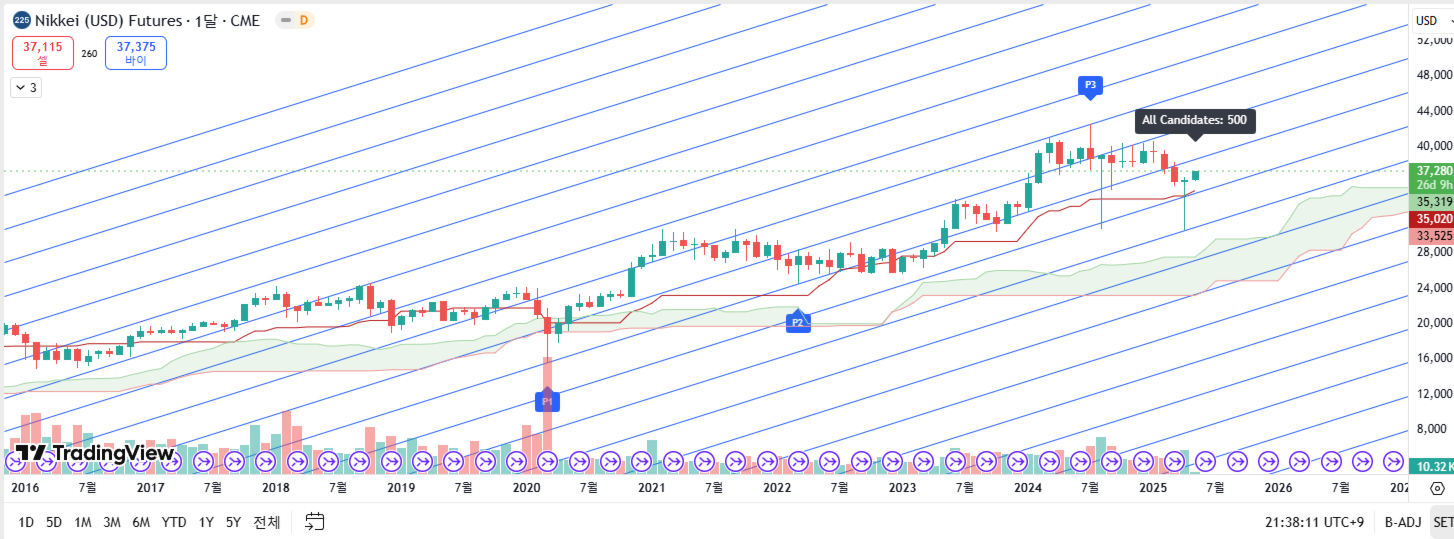
  • 오토채널 시장 구조를 자동으로 읽어 수작업을 줄여줍니다.

  • "기계의 정밀성과 인간의 직관으로 분석"

📊 기술 분석

주요 기능 설명
자동 피벗 감지 지그재그 기반 실시간 분석
멀티 타임프레임 분석 강력한 신호를 위해 더 높은 시간대를 활용
채널 채점 시스템 볼륨, 각도, 길이, 중요도 등을 평가합니다.
유사성 필터링 깔끔한 UI를 위해 중복 채널 제거
동적 지그재그 감도 시장 범위 및 기간에 맞게 조정

💡 시각적 하이라이트

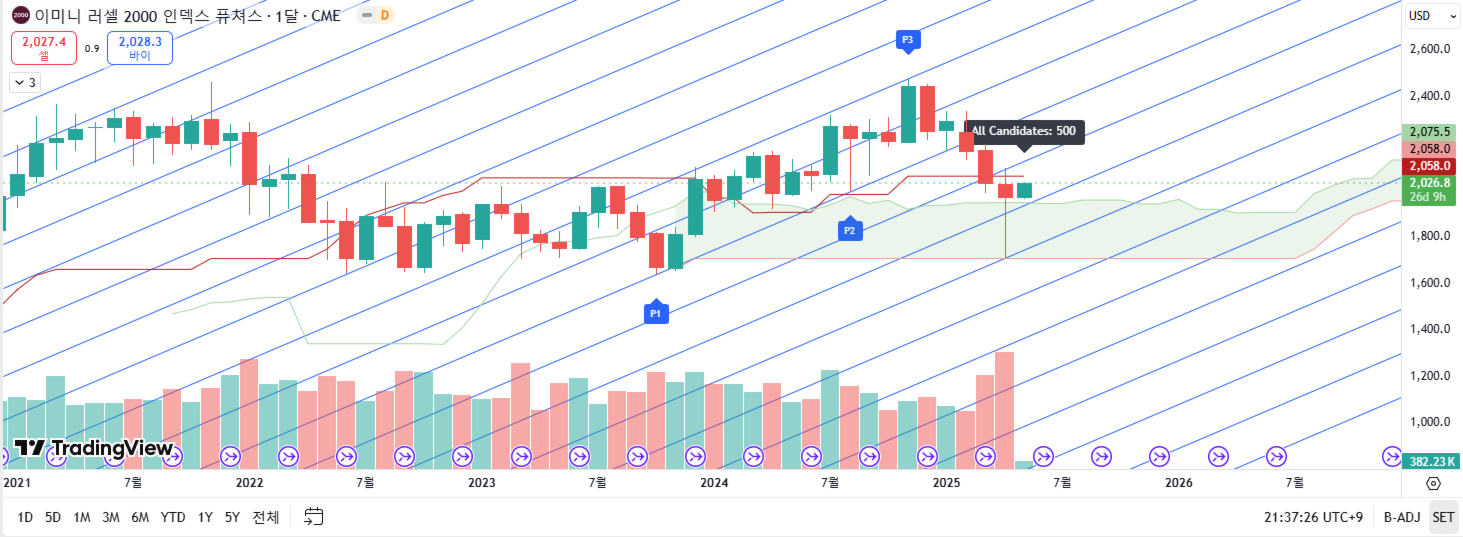
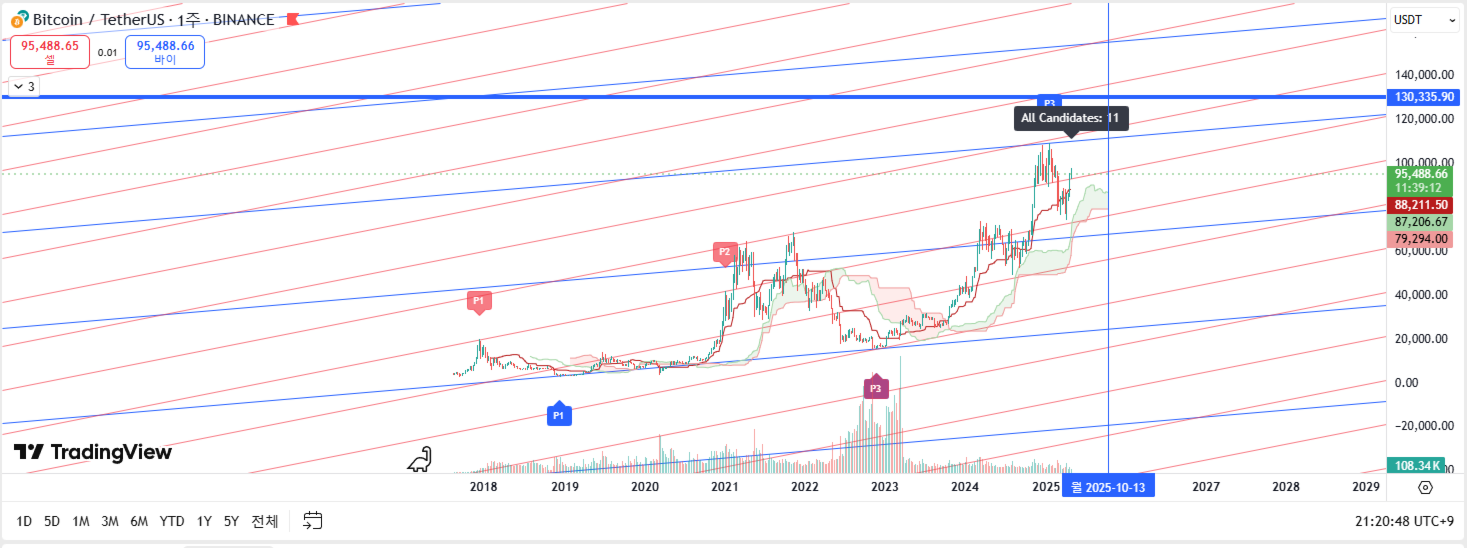
  • 중요도에 따라 등급이 매겨진 채널 투명도

  • 어두운/밝은 배경에 대한 테마 자동 감지

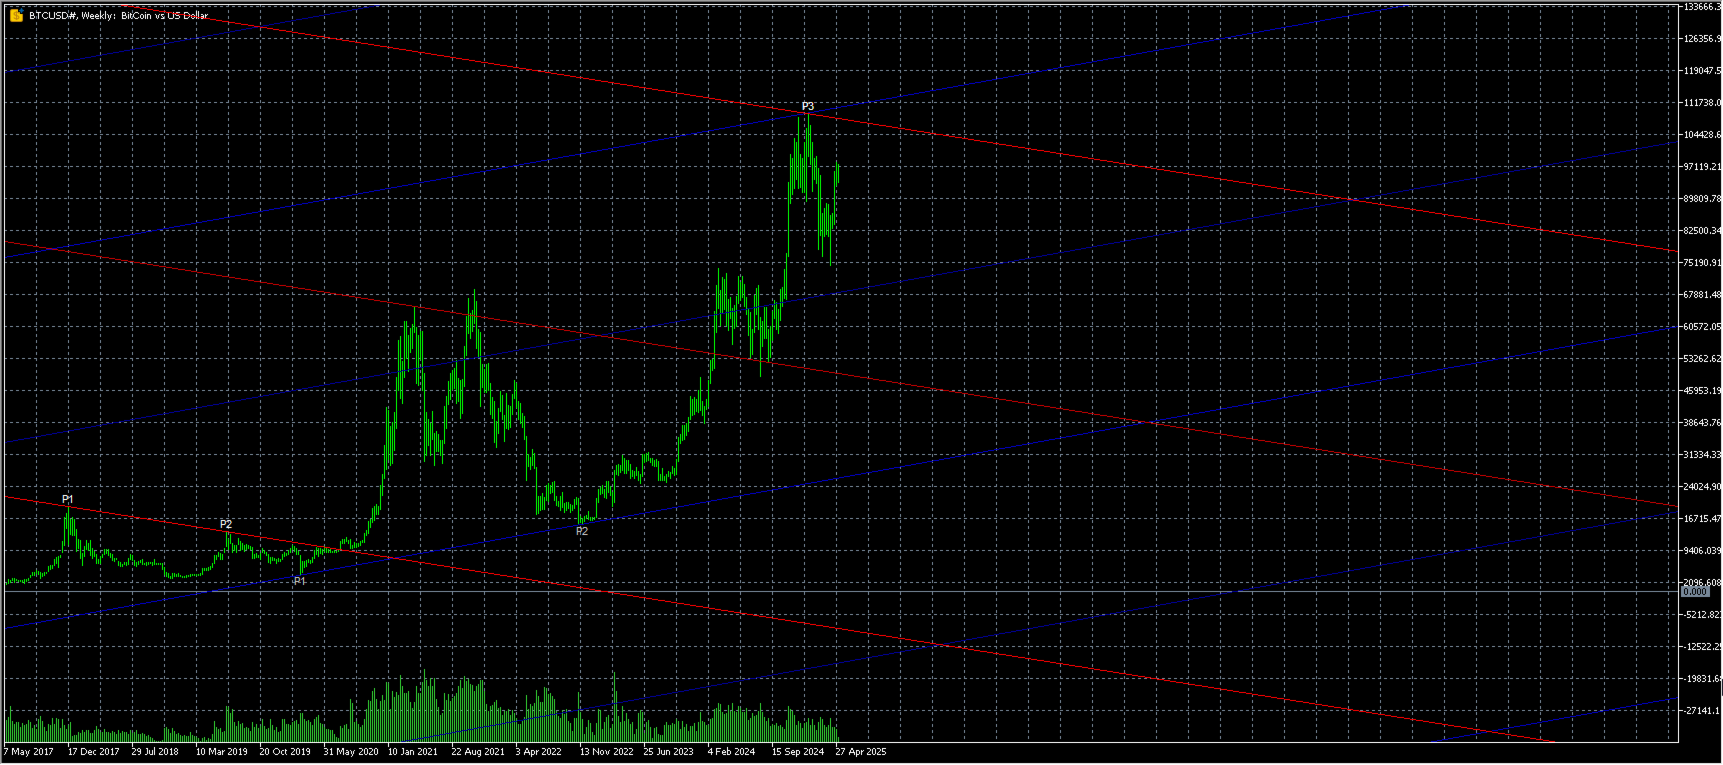
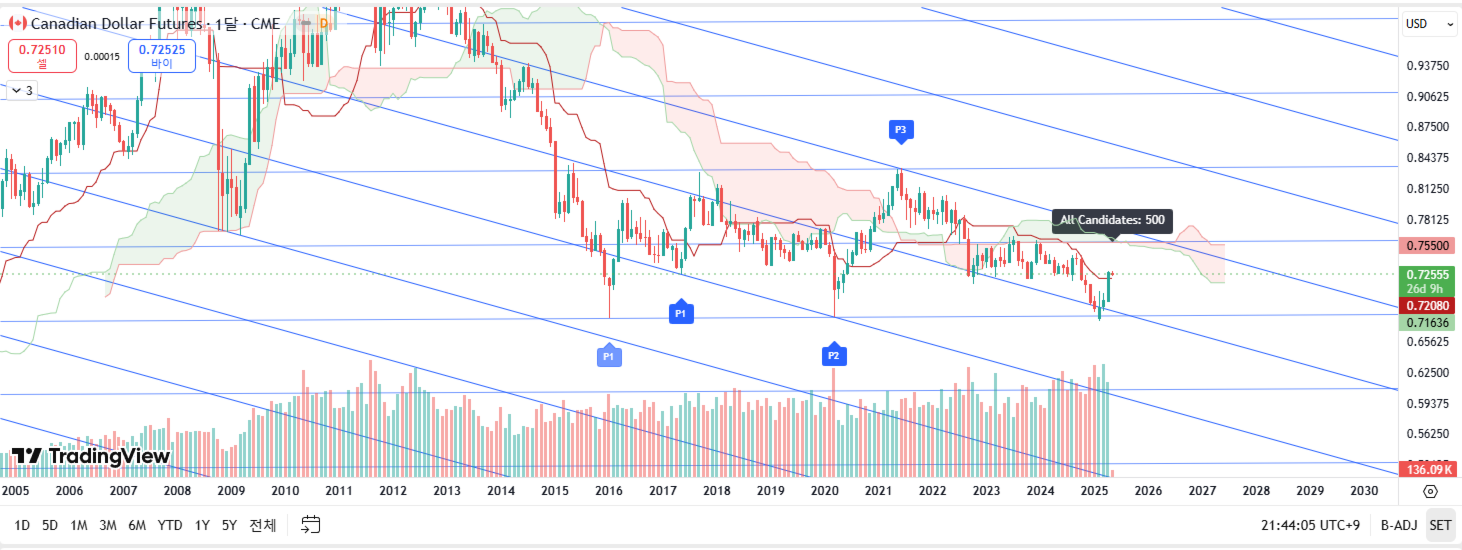
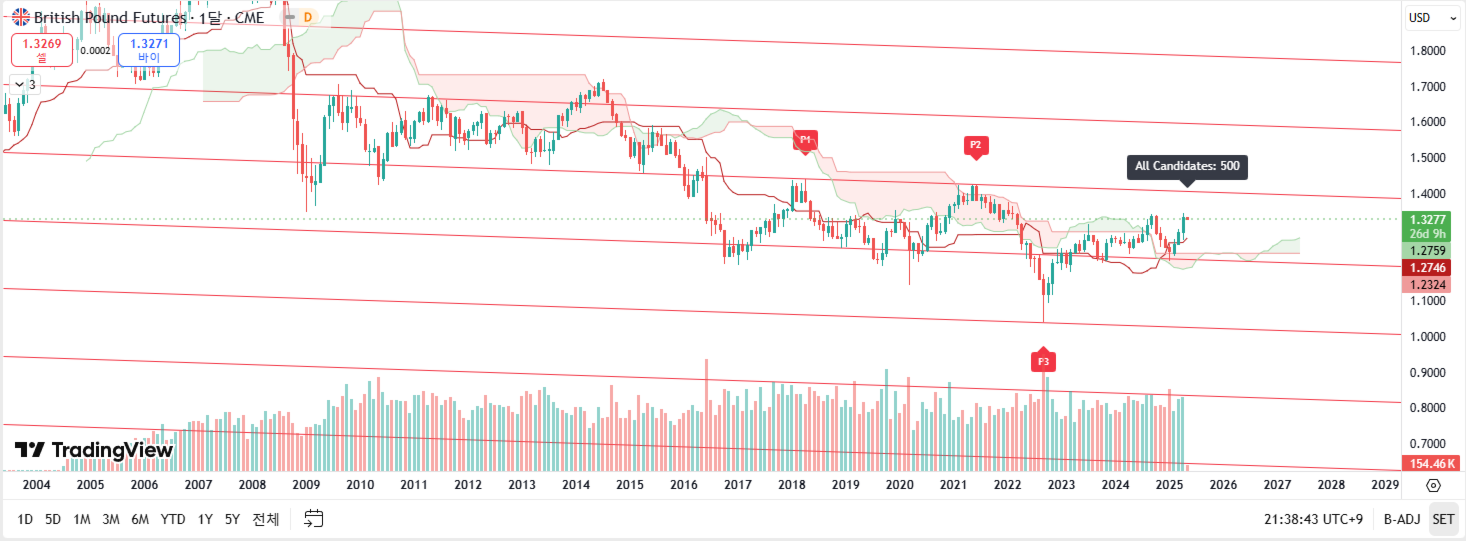
  • 학습 구조를 위한 P1/P2/P3 피벗 포인트 표시

🚀 기대 효과

  • 복수의 자산을 자동으로 분석합니다.

  • 노이즈가 적은 채널만 표시하고신뢰도가 높은 채널을 표시합니다

  • .
  • 시장 구조 이해 최소한의 노력으로 24시간 연중무휴

💡  "손 떼세요. 자동 채널이 알아서 그려줍니다."

💡  "매일 수동으로 피벗 그리기? 자동화할 시간입니다."


📜 기초 및 증거

  • ✅ 파생상품으로 300만 달러 수익을 낸(2024년) 트레이더의 검증된 기법을 기반으로

  • ✅ 검증된 사용 후기(MQL5 별점 평가를 통해 시각화)

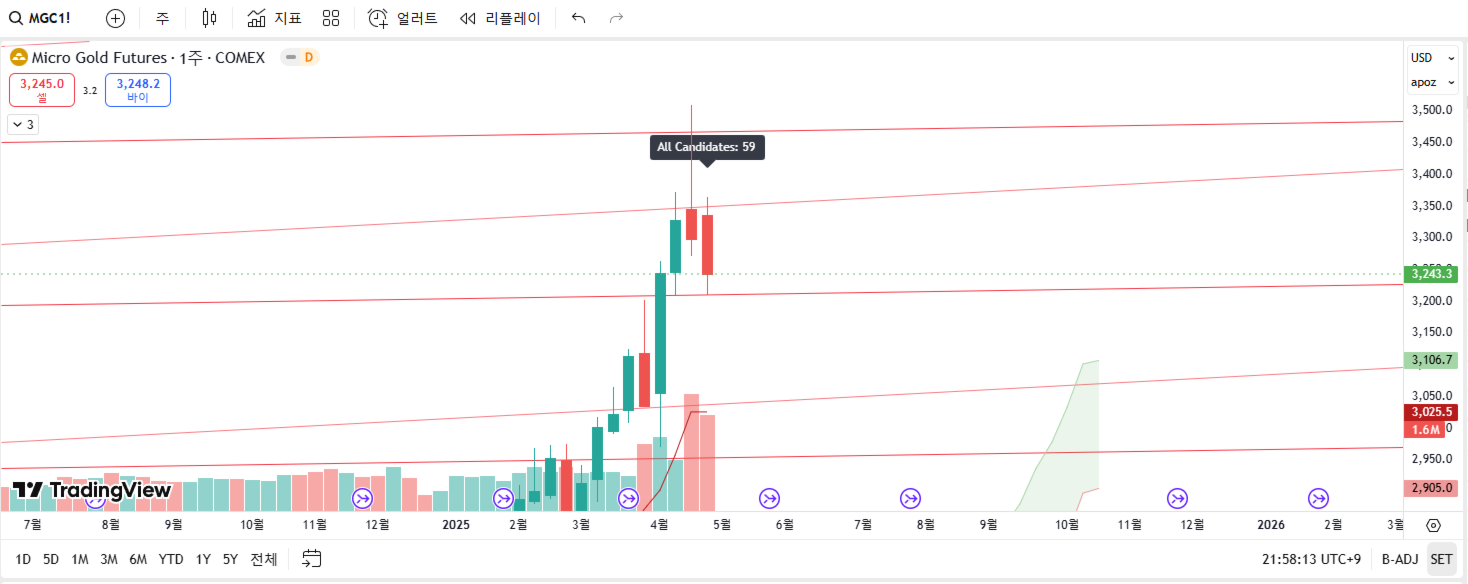
  • ✅ 자동 감지 시나리오 스크린샷(2~3개 예시)

❓ 일부 FAQ 미리보기

질문 답변
몇 개의 막대로 작동하나요? 막대가 많을수록 정확도가 높아집니다
자동 채널을 완전히 신뢰할 수 있나요? 베스트 채널 강조 표시, 여전히 수동 확인 권장
변동성이 큰 시장에서도 신뢰할 수 있나요? 다이나믹 지그재그로 변화하는 환경에 적응

🌟  "차트를 더 스마트하게 만드세요. 지금 바로 자동 채널을 시작하세요."

🌟  "[MQL5에서 방문하기] - 지금 엣지를 시작하세요."

💥 프로모션

  • "기간 한정: 30% 할인! (할인된 가격 적용)"

  • "다음 업데이트 전에 구매 → 멀티 타임프레임 모듈을 무료로 받으세요!"

❗ 이의 제기 처리
오류 카운터 메시지
자동 표시기가 신뢰할 수 있는지 확실하지 않음 → 점수 + P1-P3 레이블 + 3백만 달러 트레이더 기준 구축
너무 복잡해 보입니다 → 동영상 가이드, 사용자 지정 UI 포함
내 차트에 맞는지 확실하지 않음 → MT5 플랫폼을 사용하는 호환 브로커
✅ 최종 요약 CTA

채널 그리기는 시간의 문제가 아니라 전략의 문제입니다.
오늘 바로 자동 채널을 사용해 보세요.
정확성, 시각화, 자동화가 완벽하게 내장되어 있습니다.


추천 제품
Banks Dealing Range
Aurthur Musendame
The Central Bank Dealers Range (CBDR) is a key ICT concept, used to project potential highs and lows for the day based on market conditions during a specific time window. The CBDR is utilized to forecast price movements in both bullish and bearish market conditions. By identifying this range, traders can better anticipate the price levels that may form as the day progresses. CBDR and Standard Deviation A key feature of the CBDR is its application of standard deviation , a statistical measure u
FREE
Pivots Lines
Abakou Nazaire Ayelenou
5 (1)
모든 시간대에 Traditionnal, Fibonacci, Woodie, Classic, Demark, Camarilla의 피벗 포인트 그리기 모든 유형의 피벗 Traditionnal, Fibonacci, Woodie, Classic, Demark, Camarilla 지원 모든 기간 지원(M1...H1...D1...MN1...매년) 서버 일광 절약 시간제 지원 시드니에서 미국으로 열리는 외환 일일 섹션 지원 닫기 암호화 거래 지원 피벗과 추세 사이의 간격을 채우면 매우 유용합니다. 피벗 포인트는 추세의 방향을 보여주고 수요와 공급을 모니터링하기 위한 결정적인 영역을 제공합니다. 추세 지표로서 피벗 포인트는 주로 감상적 분석에 도움이 됩니다. PP보다 높은 가격은 강세를 나타내고, PP보다 낮은 가격은 시장에서 약세를 나타냅니다.
FREE
Draw Pivot Point
Rainer Schnoege
The utility draws pivot levels for the selected timefram in classic method. Pivot = (high + close + low) / 3 R1 = ( 2 * Pivot) - low S1 = ( 2 * Pivot) - high R2 = Pivot + ( high - low ) R3 = high + ( 2 * (Pivot - low)) S2 = Pivot - (high - low) S3 = low - ( 2 * (high - Pivot)) you can change the timeframe, colors and fontsize. also you can change the text for the levels. Have fun and give feedback...
FREE
Buy and Sell Power
Marco Engstermann
4 (2)
Simple Indicator that shows the Buy and Sell volume in percent. Settings: Font size for percentage labels Horizontal offset from right edge (pixels) Vertical offset for Signal label from bottom (pixels) Vertical offset for Buy label from bottom (pixels) Vertical offset for Sell label from bottom (pixels) Color for Buy label Color for Sell label Color for Strong Buy signal Color for Buy signal Color for Strong Sell signal Color for Sell signal Color for Neutral signal Default to every tick
FREE
React Fibonacci Chart
Kim Yonghwa
4.91 (11)
기능 피보나치 리트레이스먼트 트레이딩을 위한 지표 1H, 4H, 1D 및 1W 중에서 선택한 이전 바를 기반으로 피보나치 차트가 그려집니다. 시장 가격이 피보나치 레벨에 닿으면 색상이 변경되고 닿은 시간이 표시됩니다. -23.6, 0, 23.6, 38.2, 50, 61.8, 76.4, 100 및 123.6 레벨에 피보나치 그래프가 그려지며, 바가 업데이트될 때마다 차트가 새로 고침됩니다. 변수 타임프레임: 1H, 4H, 1D 및 1W 중에서 선택한 타임프레임으로 피보나치 차트가 그려집니다. FiboWidth: 레벨의 두께를 결정합니다. FiboStyle: 피봇 레벨의 스타일을 설정합니다. TouchedColor: 닿았을 때 변경되는 색상입니다. 오류가 있거나 개선 사항이 있다면 의견을 남겨주세요. 평가는 개발자에게 큰 도움이 됩니다. 만족하셨다면 5성을 부여해 주시기 바랍니다.
FREE
NakaTrend
Ricardo De Andrade Nakano
2 (1)
"NakaTrend를 소개합니다: MetaTrader 5용 궁극적인 트렌드 감지기! 거래 경험을 혁신하시기 준비 되셨나요? NakaTrend를 만나보세요. 정확하고 쉽게 트렌드 변화를 식별하는 데에 최적의 인디케이터입니다. NakaTrend를 사용하면 시장 변동을 놓치지 않습니다. 상승 트렌드가 발생하면 NakaTrend가 초록색 달러 표시로 신호를 보내 구매 주문을 넣으라고 안내합니다. 그리고 하락 트렌드로 변할 때는 빨간색 달러 표시가 나타나 매도 주문을 넣을 때 최적의 시점임을 알려줍니다. 하지만 이것만이 아닙니다 - NakaTrend는 수동 주문 입력을 허용하여 귀하가 거래를 제어할 수 있도록 돕습니다. 당신의 직감과 NakaTrend의 통찰력이 수익성 있는 결과로 이끌어줍니다. 추측하거나 시대에 뒤떨어진 인디케이터에 의존하는 시대는 지났습니다. NakaTrend는 신뢰할 수 있는 명확하고 실행 가능한 신호를 제공하기 위해 고급 알고리즘을 활용합니다. 그리고 Nak
FREE
VWAP Cloud
Flavio Javier Jarabeck
4.1 (10)
Do you love VWAP? So you will love the VWAP Cloud . What is it? Is your very well known VWAP indicator plus 3-levels of Standard Deviation plotted on your chart and totally configurable by you. This way you can have real Price Support and Resistance levels. To read more about this just search the web for "VWAP Bands" "VWAP and Standard Deviation". SETTINGS VWAP Timeframe: Hourly, Daily, Weekly or Monthly. VWAP calculation Type. The classical calculation is Typical: (H+L+C)/3 Averaging Period to
FREE
Detailed Description: The   Pivot Point Classic Indicator   is designed for traders who rely on classic pivot points and midpoints levels for their trading strategies. By automatically calculating and plotting these levels, the indicator provides a clear, visual representation of critical price areas where the market may reverse or break out. Key Features: Automatic Pivot Point Calculations : Automatically calculates pivot points, three support (S1, S2, S3) and resistance (R1, R2, R3) levels bas
FREE
Pivot Classic, Woodie, Camarilla, Fibonacci and Demark Floor/Classic Pivot points, or simply pivots, are useful for identifying potential support/resistance levels, trading ranges, trend reversals, and market sentiment by examining an asset's high, low, and closing values. The Floor/Classic Pivot Points can be calculated as follows. Pivot Point (P) = (High + Low + Close)/3 S1 = P * 2 - High S2 = P - (High - Low) S3 = Low – 2*(High - P) R1 = P * 2 - Low R2 = P + (High - Low) R3 = High + 2*(P - Lo
FREE
Pivot Points Buy Zones
Nils R M Peleman
4.75 (4)
Detailed Description: The   Pivot Points Indicator   is designed for traders who rely on pivot points, midpoints and support/resistance levels for their trading strategies. By automatically calculating and plotting these levels (based on   the   previous period's high, low, and close prices) , the indicator provides a clear, visual representation of critical price areas where the market may reverse or break out.The tool is particularly useful for day traders and swing traders looking to base th
FREE
Ultimate Pivot Levels indicator for MetaTrader 5 Ultimate_Pivot_Levels is versatile tool designed to enhance your trading experience by accurately plotting pivot levels on your charts. It allows entering your desired values manually or using well known pivot calculation methods to create pivot levels. It draws the levels in the background and allows you to customize levels, size and colors of areas, and it keeps your adjustments while extending the levels to every new bar. Whether you are a novi
FREE
Vertical Volume
Kim Yonghwa
4.83 (6)
기능 가격에 대한 거래량 확인 지표입니다. 주로 EURUSD에 적용되며, 다른 통화 쌍은 작동하지 않거나 계산에 오랜 시간이 걸릴 수 있습니다. 원활한 사용을 위해 "차트 경계를 오른쪽 경계에서 이동" 옵션을 활성화합니다(스크린샷에 표시됨). 새로운 막대가 나타날 때 데이터가 재설정됩니다. 변수 COlOR: 지표 색상 설정 WIDTH: 지표 너비 설정 PERIOD: 데이터 계산을 위한 기간 설정 ‐----‐-------------------------------------------------------------------------------------------------------------------------------------------------
FREE
SMC Structure Markup
Seyed Mohammad Hosseini Hejazi
5 (6)
Overview The Smart Money Structure Markup Indicator for MetaTrader 5 is a powerful tool designed to help traders identify key market structures based on popular Smart Money Concepts (SMC) strategies. This indicator detects micro-market structures, providing insights into price movements and potential trend changes. It highlights important elements such as valid Break of Structure (BOS), Change of Character (CHoCH), and Inducement (IDM), helping traders to make informed decisions. Key Features Ma
FREE
RSI Chart Levels
Nikolay Mitrofanov
5 (5)
The indicator draws levels based on the overbought and oversold values ​​of the RSI indicator. The maximum values ​​are taken into account, which are equal to or exceeded certain limits. That is, for example, when the price has gone into the overbought zone, the highest price is selected from all prices in this zone for this period of time, and as soon as the indicator value returns to a value below the overbought value, the level is fixed and the calculation of new values ​​begins. The same
FREE
Investment Castle Support and Resistance
Ahmed Alaaeldin Abdulrahman Ahmed Elherzawi
5 (5)
Investment Castle Support and Resistance Indicator has the following features: 1.  Dictates the direction of Buy or Sell trades based on Support and Resistance Levels automatically . 2.  Candles stick colors will change to Red for Sell and Blue for Buy (Default settings, user can change from the inputs). 3. This indicator is built-in the Support & Resistance based Investment Castle EA which works with Psychological Key Levels "Support & Resistance".
FREE
Period Breakout Indicator MT5
Komang Putra Riswanjaya
Overview The Period Breakout Indicator is a versatile tool designed for traders seeking to identify breakout opportunities based on customizable time periods. This indicator automatically determines the highest and lowest prices within a user-defined period, allowing you to tailor it precisely to your trading strategy. Key Features Customizable Time Periods:   Define the start and end times based on your preferred trading hours or any specific period. The indicator will then calculate the highes
FREE
Guppy
Cem Ummak
This is a custom Guppy-style Moving Average indicator built for MetaTrader 5 (MT5), designed to replicate the appearance and logic of the popular TradingView version. Unlike the built-in tools in MT5, this indicator offers a simplified yet powerful approach by using only 6 Exponential Moving Averages (EMAs). It provides clean visualization and accurate market layering to help traders make better decisions. Features TradingView-Style Guppy Logic – Displays 6 EMAs for combined short- and medium-
FREE
Fair Value Gap FVG Sessions ICT Indicator for MT5 The Fair Value Gap (FVG) Sessions Indicator for MetaTrader 5 streamlines the detection of price gaps that arise during trading sessions. This tool is designed to highlight market inefficiencies, marking bullish FVGs in green and bearish FVGs in orange . These zones often act as crucial support and resistance levels , assisting traders in spotting potential trade entry and exit points. «Indicator Installation & User Guide» MT5 Indicator Installati
FREE
Fair Value Gap Scanner
Usiola Oluwadamilol Olagundoye
The Fair Value Gap Detector is a MetaTrader 5 indicator designed to identify and draw rectangles on the chart wherever fair value gaps (FVGs) are detected. Fair value gaps occur when there is a significant disparity between the current price and the fair value of an asset. These gaps can provide valuable insights into potential trading opportunities, as they often indicate overbought or oversold conditions in the market. Key Features: FVG Detection: The indicator utilizes a proprietary algorith
FREE
IAMFX offers the ultimate solution to make trading easier and more flexible on IAMFX Web  using IAMFX Agent . With our exclusive IAMFX-Agent and IAMFX-Center, you can effortlessly manage your trading anytime, anywhere through web and mobile interfaces. Fully compatible with both web and mobile environments,   IAMFX allows real-time multi-account management and monitoring with a simple installation. IAMFX Benefits Manage multiple MT5 accounts Easy orders with market, stop and limited Manage orde
FREE
Iceberg Divergen MT5
Komang Putra Riswanjaya
3 (1)
Iceberg Divergen Indicator Uncover the hidden opportunities beneath the surface. Overview Divergences in the Awesome Oscillator (AO) often signal powerful market reversals, yet spotting them manually can be challenging and time-consuming. Missing out on these opportunities can cost traders valuable entry points. That’s why we created the   Iceberg Divergence Indicator   — a powerful tool that precisely detects both regular and hidden divergences in AO. With Iceberg Divergence, you won’t just id
FREE
Golden Days 1.0 - 메타트레이더5 반자동 트레이딩 시스템   주요 기능 상세설명 사용자 지정 조건(지표/가격/시간)에 따른 반자동 주문 실행 시스템 다중 시간대 분석 지원 (M15/H1/D1 동시 모니터링) 스마트 손절매/익절매 기능 (고정값 또는 동적 조정 가능) 실시간 거래 시그널 및 경고 알림 (모바일 푸시 지원) 리스크 관리 도구 (계정 자산 대비 1~5% 자동 조정)   시스템 장점 수동 거래의 정밀성 + 자동화의 편의성 결합 초보자도 쉽게 설정 가능한 직관적인 인터페이스 MT5의 모든 거래 상품 호환 (외환, 지수, 선물 등) CPU 자원 최적화 (최대 2% 사용량) ※ 필수 확인 사항 완전 자동화 EA가 아닌 반자동 보조 도구 초기 1회 설정 필요 (영상 매뉴얼 제공) 시장 갭/유동성 리스크는 존재 지원 환경 • OS: Windows 10/11 (64bit) • MT5: Build 2000 이상 • 권장 사양: 4GB RAM, 듀얼코
Kit Trader Golden Days V2       유틸리티     Samuel Cavalcanti Costa   버전:   2.0   활성화:   5 Golden Days 2.0 - 메타트레이더5 반자동 트레이딩 시스템   주요 기능 상세설명 사용자 지정 조건(지표/가격/시간)에 따른 반자동 주문 실행 시스템 다중 시간대 분석 지원 (M15/H1/D1 동시 모니터링) 스마트 손절매/익절매 기능 (고정값 또는 동적 조정 가능) 실시간 거래 시그널 및 경고 알림 (모바일 푸시 지원) 리스크 관리 도구 (계정 자산 대비 1~5% 자동 조정)   시스템 장점 수동 거래의 정밀성 + 자동화의 편의성 결합 초보자도 쉽게 설정 가능한 직관적인 인터페이스 MT5의 모든 거래 상품 호환 (외환, 지수, 선물 등) CPU 자원 최적화 (최대 2% 사용량) ※ 필수 확인 사항 완전 자동화 EA가 아닌 반자동 보조 도구 초기 1회 설정 필요 (영상 매뉴얼 제공) 시장 갭/유
One of the simplest Pivot Point indicator, easy to operate, and most complete for a single chart in determining    Resistance   and   Support  level lines. In single chart,  it will show R&S Level Line with 5 popular types of Pivot Point, Highest&Lowest of closing price Include the Trend and up to 3 Time Frames. Five   types   (Floor, Woodie, Camarilla, DeMark, & Fibonacci)   of popular   Pivot Points   in determining   Resistance   and   Support   levels. With just using simple button on the
FREE
FaU fibo
Aleksandr Dementev
The indicator draws actual Fibonacci levels for your trading activity. The levels are redrawn every time after the price touches the low (0%) or the 100% fibonacci level. In the parameters, select the trading activity: Long term investor Medium term investor Medium-term investor active Short term investor Short-term investor active Speculator Speculator active Scalper Scalper active Try this indicator in action, and you will no longer have to look for coordinates for drawing fibonacci levels.
FREE
Simple indicator to calculate fibonacci retracement levels on time. Add to chart and move trend line to set the fibonacci retracement levels. Inputs Levels  - levels for which to calculate values, separated by space, default are fibonacci levels Show time  - if true, time will be shown on levels Show date  - if true, date will be shown on levels Show fibonacci level  - if true, value of levels will be shown Fibonacci lines color  - color of levels Trend line color  - color of trend line which de
FREE
Color Trend
Bruno Goncalves Mascarenhas
Combining the best of Price Action , Directional Movement , and Divergence / Convergence analysis, the Candle Color Trend is the easy and reliable way to identify the direction of the trend. The indicator automatically paints the candles according to the premise that the upward trend is defined by prices that form a series of ascending tops and bottoms. On the other hand, the downward trend is defined by prices that form a series of descending tops and bottoms. Color Trend is certainly one of
FREE
Colored Adaptive Moving Average AMA
Flavio Javier Jarabeck
4.86 (7)
If you like to use traditional Moving Averages (like SMAs and EMAs) to provide your trades for dynamic levels of Support and Resistance, you will love the Adaptive Moving Average (AMA). Created in 1995 by Perry Kaufman and presented to the world in his book " Smarter   Trading :  Improving   Performance   in   Changing   Markets ", the Adaptive Moving Average (also known as KAMA - Kaufman Adaptive Moving Average) has the goal to be the perfect companion for following a trend without noise, but s
FREE
Previous Day Close
Vincent Kipleting Burugo
The indicator is a line right at yesterday's closing price. With the indicator, there is no need for adding or deleting previous day close lines each new day. T he line gives you an instant visual reference point for support, resistance, and market sentiment.   Whether you are day trading or swing trading, this line helps you quickly gauge where the market closed last session and how current price action relates to that level. It works seamlessly across all timeframes - from 1-minute charts to d
FREE
Necessary for traders: tools and indicators Waves automatically calculate indicators, channel trend trading Perfect trend-wave automatic calculation channel calculation , MT4 Perfect trend-wave automatic calculation channel calculation , MT5 Local Trading copying Easy And Fast Copy , MT4 Easy And Fast Copy , MT5 Local Trading copying For DEMO Easy And Fast Copy , MT4 DEMO Easy And Fast Copy , MT5 DEMO MACD is called Convergence and Divergence Moving Average, which is developed from the double e
FREE
이 제품의 구매자들이 또한 구매함
Enigmera MT5
Ivan Stefanov
5 (1)
ENIGMERA: 시장의 핵심 소개 이 지표 및 트레이딩 시스템은 금융 시장에 대한 놀라운 접근 방식을 제공합니다. ENIGMERA는 프랙탈 사이클을 사용하여 지지선과 저항선을 정확하게 계산합니다. 진정한 누적 구간을 표시하고 방향과 목표를 제시합니다. 추세든 조정장이든 상관없이 작동하는 시스템입니다. 작동 원리 지표의 대부분 기능은 차트 왼쪽에 있는 버튼으로 제어되며, 다양한 시장 상황에 빠르게 대응할 수 있습니다. 버튼 설명 ON/OFF – 지표 전체를 표시하거나 숨깁니다. Support – 추세의 주요 지지선입니다. Ch – 지지 채널을 활성화하여 허용 오차 범위를 나타냅니다. Dev1 (첫 번째 편차) – 지지선 편차 내에서 가격 움직임을 표시하여 시장 불확실기나 세력 누적을 나타냅니다. Dev2 (두 번째 편차) – 편차 사이에서의 가격 움직임을 표시하여 추세 형성과 방향을 시사합니다. Dev3 (세 번째 편차) – 강한 추세 가속과 높은 변동성을 나타냅니다. 45deg
Cycle Maestro MT5
Stefano Frisetti
5 (1)
NOTE: CYCLEMAESTRO is distributed only on this website, there are no other distributors. Demo version is for reference only and is not supported. Full versione is perfectly functional and it is supported. CYCLEMAESTRO , the first and only indicator of Cyclic Analysis, useful for giving signals of TRADING, BUY, SELL, STOP LOSS, ADDING. Created on the logic of   Serghei Istrati   and programmed by   Stefano Frisetti ;   CYCLEMAESTRO   is not an indicator like the others, the challenge was to inter
TrendMaestro5
Stefano Frisetti
note: this indicator is for METATRADER4, if you want the version for METATRADER5 this is the link:  https://www.mql5.com/it/market/product/108106 TRENDMAESTRO ver 2.4 TRENDMAESTRO recognizes a new TREND in the bud, he never makes mistakes. The certainty of identifying a new TREND is priceless. DESCRIPTION TRENDMAESTRO identifies a new TREND in the bud, this indicator examines the volatility, volumes and momentum to identify the moment in which there is an explosion of one or more of these data a
CBT Quantum Maverick
Arpit Sharma
1 (1)
CBT Quantum Maverick 고효율 바이너리 옵션 거래 시스템 CBT Quantum Maverick는 정밀하고 간단하며 체계적인 거래를 원하는 트레이더를 위해 설계된 고성능 바이너리 옵션 거래 시스템입니다. 사용자 지정이 필요 없으며, 처음부터 최적화된 결과를 제공합니다. 약간의 연습만으로 신호를 쉽게 마스터할 수 있습니다. 주요 특징: 정확한 신호 제공: 현재 봉 데이터를 기반으로 다음 캔들에 대한 신호를 생성하며, 빈번한 재도색이 없습니다. 다양한 시장에 대한 적응성: 바이너리 옵션 거래에 특화되었으며, 여러 브로커 및 자산 클래스와 호환됩니다. 호환 가능: Deriv Synthetic Charts: 모든 시간 프레임에서 사용 가능. OTC 차트: Quotex, PocketOption, Binomo, Stockity, IQOption, Exnova, OlympTrade, Deriv, Binolla, Homebroker 등의 브로커와 호환(MT5로의 무료 데이터 임
트렌드를 포착하세요. 패턴을 읽으세요. 진입 시점을 타이밍하세요. 30초 이내의 3단계! 분석 없이도 쉽게 거래하세요 — 당신의 스마트 어시스턴트가 워크플로우를 단순화해 드립니다. 더 이상 차트 과부하 없음. 스마트 바이어스 감지로 자신감 있게 거래하세요. 모든 통화, 암호화폐, 주식, 금속, 지수 및 모든 시간대와 호환됩니다. 그냥 클릭하고 실행하세요 — 정말 간단합니다. 속도와 명확성을 원하는 바쁜 트레이더에게 이상적입니다. TPTSyncX는 추세, 패턴, 그리고 캔들스틱 트리거 분석을 하나로 통합하여 깨끗하고 지능적인 시각 시스템으로 동기화하는 강력한 올인원 MetaTrader 5 인디케이터입니다. 명확성, 정밀성, 속도를 원하는 트레이더를 위해 설계되었으며, 가격 행동, 구조적 패턴 및 시장 타이밍 도구의 조합을 통해 높은 확률의 트레이드 기회를 식별하는 데 도움을 줍니다. 주요 기능: 스마트 시각 디스플레이: 자동으로 가격 구조 패턴을 그리고, 차트에 Higher Hig
This indicator is based on the mathematics of the great trader W.D. Ganna. With its help, you can easily find strong levels by analyzing swings to find the optimal entry point. The indicator works on all instruments and all timeframes. The indicator is fully manual and has control buttons. All you need to do is press the NEW button, a segment will appear, which you can place on any movement, swing or even 1 candle that you want to analyze. By placing the segment, press the OK button. A grid (th
Gann Zone Pro MT5
Kirill Borovskii
This indicator identifies and displays zones, as it were areas of strength, where the price will unfold. The indicator can work on any chart, any instrument, at any timeframe. The indicator has two modes. The indicator is equipped with a control panel with buttons for convenience and split into two modes. Manual mode: To work with manual mode, you need to press the NEW button, a segment will appear. This segment is stretched over the movement and the LVL button is pressed. The level is displayed
The   Time_Price_SQ9_Degree   indicator is based on the 9 Gann square. Using this indicator, you can identify strong time and price zones. The indicator displays the levels as a degree value. The degrees can be set in the settings. After launching, the MENU button appears. If it is highlighted, it can be moved to any point on the graph, and after double-clicking on it, it stops being highlighted and menu buttons appear. To hide the menu, just double-click on the button, it will become highlight
IVISTscalp5
Vadym Zhukovskyi
5 (6)
당신에게 소개하는 iVISTscalp5 지표는 독특하면서도 거래 작업에서 효과적입니다. 이 지표는 시간 데이터를 기반으로 하며 금융 시장의 많은 경험과 깊은 분석의 결과입니다. iVISTscalp5 지표는 수동 거래에 뛰어난 도구입니다. 편리성, 간단함 및 시각화 - 모든 복잡성은 숨겨져 있습니다. 우리는 iVISTscalp5 지표의 설정과 사용을 최대한 단순화했습니다. 이 지표는 MT5 터미널에서 가지고 있는 모든 금융 상품에 적합합니다. 시간 기준으로 작동하는 시간은 4am에서 8pm (UTC+3)입니다. iVISTscalp5 지표 메뉴 (스크린샷 1 참조): History - 표시할 주간 수 계산 dT_min - 시간 설정 간격 선택 (분) TFline - 수평 볼륨 생성 (타임프레임) BARSline - 수평 볼륨 생성 (바 수) TFtrend1 - 매일 채널 생성 (타임프레임) BARStrend1 - 매일 채널 생성 (바 수) TFtrend2 - 주간 채널 생성 (타임프레임
Hello I Want to introduce The Forex Buy Sell Arrow Premium MT5 i recently release this premium indicator! its 1000% Non Repaint Indicator, It Work Perfectly Well,, i tested it day by day, Just mind blowing Result,  Including Powerful trend Algorithm! How It Work? well, it work market trend formula, when trend Bullish Or when trend Bearish,  Recommend Timeframe M30, H1 it work all timeframe, and all currency pair, 100% non repaint, How to take signal From Forex Buy Sell Arrow Premium Ind
Naveen Dynamic Square MT5
Satya Prakash Mishra
The Naveen Dynamic Square  MT5  is one of the best known  technical analysis tools  inspired  by WD Gann along with the Gann Fan and Gann Box. It is considered a cornerstone of his trading technique that is based on time and price symmetry. The Naveen Dynamic Square MT5   is a powerful tool in finance for determining support and resistance levels based on a stock's extreme price points. It works by extrapolating probable price levels from a central value, typically an all-time or cyclical high o
Reversal ALGO
Muhammad Abdullah Bhatti
Reversal Algo – 시장 반전 분석을 위한 기술 지표 Reversal Algo는 시장 트렌드의 전환점을 식별하는 데 도움을 주기 위해 정교하게 설계된 기술 지표입니다. 과거 가격 데이터를 면밀히 분석하여 중요한 고점과 저점을 감지하고, 이를 통해 시장 모멘텀의 변화를 예측할 수 있습니다. 이 지표는 차트에 명확한 시각적 신호를 제공하여 트렌드가 반전될 가능성이 있는 주요 지점을 쉽게 식별할 수 있도록 돕습니다. 주요 기능 중요한 가격 수준 감지 Reversal Algo는 과거 가격 데이터를 분석하여 일시적인 변동성을 제거하고, 통계적으로 유의미한 고점과 저점만을 식별합니다. 고급 노이즈 필터링 변동성 필터를 적용하여 사소한 가격 변동의 영향을 최소화하고, 의미 있는 가격 움직임만을 기반으로 신호를 생성하여 잘못된 신호 발생을 줄입니다. 사용자 맞춤 설정 가능 트레이더는 민감도 및 임계값을 조정하여 자신의 거래 스타일과 시장 조건에 맞게 지표를 최적화할 수 있습니다. 포
TMA Channel is a price channel obtained through a special calculation method based on traditional TMA . The channel has upper, middle, and lower tracks . When the price approaches or exceeds the upper track, it is already in an overbought state, and attention should be paid to the situation of reversal and decline; When the price approaches or falls below the lower track, it is already in an oversold state, and attention should be paid to the situation of reversal and rise . The indicator will
God line
Hong Tao Ren
这个指标采用一种特殊的思路来指示市场方向,指标加载在一小时和15分钟图表效果最好。 当指标显示红色时,表明市场趋势为多头,绿色表明市场趋势为空头,黄色为不明确,此时应避免开单。 我们需要达成共识的一点是:市场行情是随机发展的,无法完全准确预测,我们能做的只有跟随,不和市场趋势对着干,才能做到顺势而为。 本指标就是在这个思路下研发的,紧紧跟随市场行情发展,确认行情展开了才会显示对应的颜色。跟随本指标,只需要按照指示操作即可。 长期跟随的情况下,交易绩效是很不错的。 另外一点:本指标更适合趋势性较强的品种,比如镑日,美日,黄金等。 依据本指标交易镑日的话,可以用在5分钟或15分钟周期,获利30个点离场是比较可行的。
VTrende Pro
Andrii Diachenko
5 (1)
VTrende Pro - MTF indicator for trend trading with a display panel for MT5 *** Videos can be translated into any language using subtitles (video language - Russian) Although the signals of the VTrende Pro indicator can be used as signals of a full-fledged trading system, it is recommended to use them in conjunction with the Bill Williams TS. VTrende Pro is an extended version of the VTrende indicator. Difference between Pro version and VTrende: - Time zones - Signal V - signal 1-2 waves -    S
WanaScalper
Isaac Wanasolo
1 (1)
A scalping indicator based on mathematical patterns, which on average gives signals with relatively small SL, and also occasionally helps to catch big moves in the markets (more information in the video) This indicator has three main types of notifications: The first type warns of a possible/upcoming signal on the next bar The second type indicates the presence of a ready signal to enter the market/open a position The third type is for SL and TP levels - you will be notified every time price re
Smooth price for Monarch
Konstantin Gruzdev
5 (1)
The Smooth Price technical indicator is used for plotting a smoothed line as close to the price of the financial instrument as possible, and serves to eliminate its noise components. The indicator is part of the Monarch trading system, but here it is presented as an independent technical analysis tool. The indicator is based on the cluster digital filter , which, unlike the ClusterSMA , is applied directly to the price time series. Smooth Price does not redraw (except the very last, zero bar) an
Pan PrizMA CD Phase
Aleksey Panfilov
The Expert Advisor and the video are attached in the Discussion tab . The robot applies only one order and strictly follows the signals to evaluate the indicator efficiency. Pan PrizMA CD Phase is an option based on the Pan PrizMA indicator. Details (in Russian). Averaging by a quadric-quartic polynomial increases the smoothness of lines, adds momentum and rhythm. Extrapolation by the sinusoid function near a constant allows adjusting the delay or lead of signals. The value of the phase - wave s
Классификатор силы тренда. Показания на истории не меняет. Изменяется классификация только незакрытого бара. По идее подобен полной системе ASCTrend, сигнальный модуль которой, точнее его аппроксимация в несколько "урезанном" виде, есть в свободном доступе, а также в терминале как сигнальный индикатор SilverTrend . Точной копией системы ASCTrend не является. Работает на всех инструментах и всех временных диапазонах. Индикатор использует несколько некоррелируемых между собой алгоритмов для класси
Premium level Pro
Dmitriy Kashevich
Premium level is a unique indicator with more than 80% accuracy of correct predictions! This indicator has been tested for more than two months by the best Trading Specialists! The author's indicator you will not find anywhere else! From the screenshots you can see for yourself the accuracy of this tool! 1 is great for trading binary options with an expiration time of 1 candle. 2 works on all currency pairs, stocks, commodities, cryptocurrencies Instructions: As soon as the red arrow app
Pendiente de Precio
Cesar Juan Flores Navarro
Indicador en base a la pendiente de la linea de precio, dibuja una línea de color cuando sube a base de los precios que previamente has sido procesados o linealizados, y cuando baja la pendiente la linea linealizada toma otro color. En este caso se a considerado 6 lineas de diferentes procesos desde pendientes largas hacia las cortas, observándose que cuando coincidan las pendientes se produce un máximo o mínimo, lo que a simple vista nos permitirá hacer una COMPRA O VENTA.
Индикатор Coefficient Of Determination (COD) представляет собой значение коэффициента детерминации или квадрат коэффициента корреляции между зависимой переменной — ценой и объясняющей переменной — тиковым объемом. Что это дает нам на практике? COD отлично распознает кульминацию трендовых движений, что позволяет подбирать оптимальные точки и ловить развороты рынка. Как использовать индикатор: Наиболее популярная торговая стратегия строится совместно с трендовым индикатором Moving Average (MA), пе
Fibonacci Multiple 12
Cesar Juan Flores Navarro
Fibonacci Múltiple 12, utiliza la serie fibonacci plasmado en el indicador fibonacci, aumentadolo 12 veces según su secuencia. El indicador fibonacci normalmente muestra una vez, el presente indicador se mostrara 12 veces empezando el numero que le indique siguiendo la secuencia. Se puede utilizar para ver la tendencia en periodos cortos y largos, de minutos a meses, solo aumentado el numero MULTIPLICA.
Recommended TimeFrame >= H1. 100% Non Repainted at any moment.  Use it carefully, only with Trend Direction. Trading Usage: 2 Variants: as Range System or as BreakOut System (Both Only With Trend Direction)::: (Always use StopLoss for minimise Risk); [1] as Range System: (Recommended) in UP TREND:  - BUY in Blue Line , then if price goes down by 50 points (on H1) open Second BUY.   Close in any Profit you wish: TrailingStop(45 points) or Close when Price touches upper Gold Line. in DOWN TREND
Linea Horizontal Inteligente
Cesar Juan Flores Navarro
En base a cálculos matemáticos de determino una linea Horizontal que cruza a todas las señales de trading, mostrando los máximos y mínimos. La linea horizontal parte en dos las subidas y bajadas de las señales de trading, de tan manera que es fácil identificar los máximos y mínimos, y es inteligente por que es sensible a las subidas y bajadas, afín de no quedarse en un solo lado por siempre, trabaja excelentemente con otros indicadores suavizadores ya que les garantiza que en un intervalo de tie
Spike Detector
Tete Adate Adjete
this indicator is a Spike detector indicator, it is specially designed to trade Boom 1000, Boom 500, Crash 1000 and Crash 500 We recommend using it on Deriv Boom and Crash indices only Its setting is intuitive, familiar, easy to use it has notification functions; audible notifications and push notifications. this tool is simple to use, easy to handle This update is based on different strategies for spikes
AutoSignals Trend Panel
Danilo Maia Siqueira
The indicator tracks the trend in 5 different chart times for the same asset, based on 6 signals for each chart time. The main objective of the indicator is to show us the majority trend of the financial asset in which it was placed. The system transmits the information of the trends in several graphical times, in this way the user is able to have a wide view of the movement of the asset, this type of tool makes the user have a higher hit rate by helping the operator to execute orders in favo
Limitless MT5
Dmitriy Kashevich
Limitless MT5 is a universal indicator suitable for every beginner and experienced trader. works on all currency pairs, cryptocurrencies, raw stocks Limitless MT5 - already configured and does not require additional configuration And now the main thing Why Limitless MT5? 1 complete lack of redrawing 2 two years of testing by the best specialists in trading 3 the accuracy of correct signals exceeds 80% 4 performed well in trading during news releases Trading rules 1 buy signal - the ap
Panel Visao axetrend
Danilo Maia Siqueira
trend view panel; AutoSignals Trend The indicator tracks the trend in 5 different chart times for the same asset, based on 6 signals for each chart time. The main objective of the indicator is to show us the majority trend of the financial asset in which it was placed. The system transmits the information of the trends in different graphic times, in this way the user is able to have a wide view of the movement of the asset, this type of tool makes the user have a higher hit rate by helping
Escalera Inteligente
Cesar Juan Flores Navarro
Indicador en MQL5, recibe la información del precio SUAVIZADO, lo procesa anulando los picos inteligentemente, y el resultado lo envía al desarrollo de la escalera que iniciara y subirá o bajara según el peldaño o INTERVALO ingresado Ingreso PERIODO = 50 (variar segun uso) Ingreso MULTIPLICA AL PERIODO = 1 (variar segun uso) Segun la configuración la escalera puede pegarse o separarse de los precios,, Se aplica toda la linea de tiempo, y a todas las divisas, etc.  
필터:
리뷰 없음
리뷰 답변