OsMA Divergence Strategy
- 지표
- Issam Kassas
- 버전: 1.0
- 활성화: 5
Description:
For a comprehensive understanding of our indicators, we invite you to explore the entire Q&A section within this MQL5 blog post here.
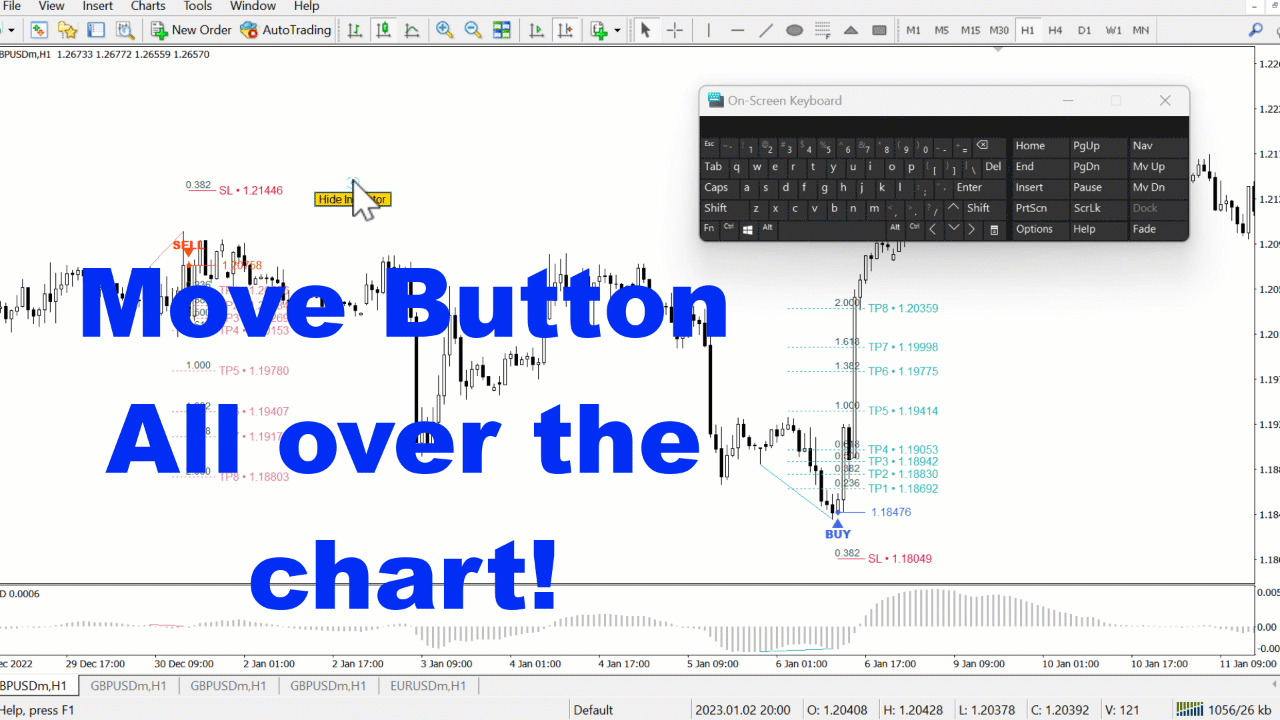
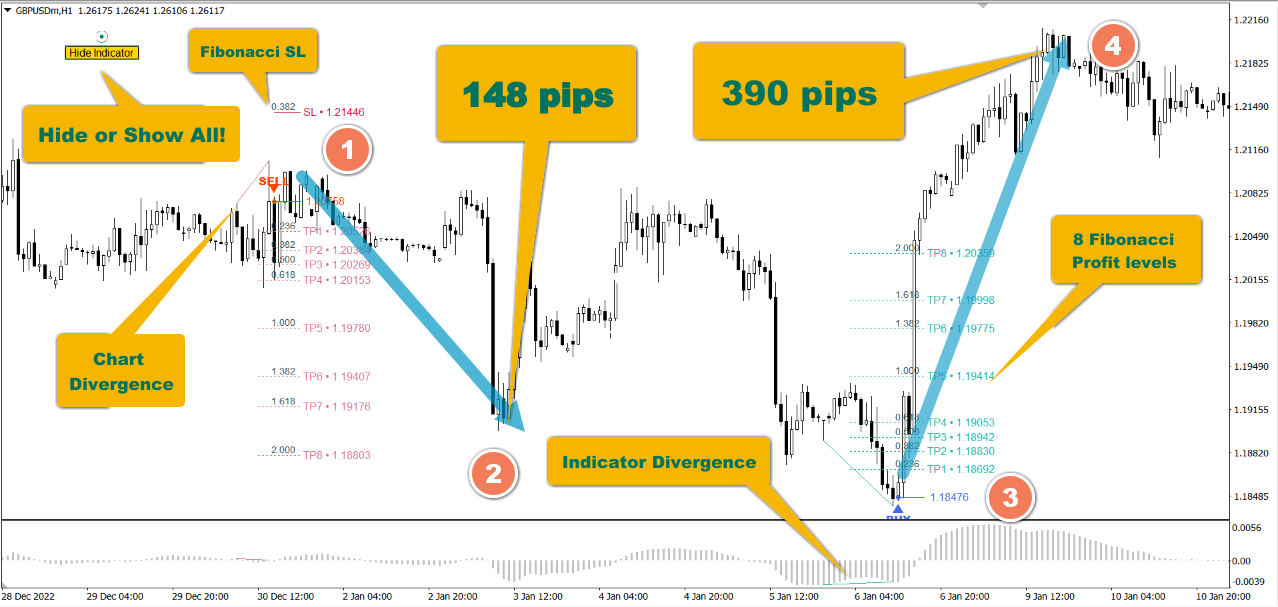
The "Divergence Strategy Indicator" is an advanced technical analysis tool designed to identify potential trend reversals and trend continuation opportunities in the market. It leverages the concept of divergence, a powerful phenomenon that occurs when price action diverges from an oscillator, indicating underlying shifts in market sentiment.
Spot Hidden Opportunities: Uncover hidden trading opportunities by detecting divergences between price and popular oscillators like MACD, RSI, or Stochastic. Divergences can signal potential trend reversals or trend continuation, helping you make timely and informed trading decisions.