Classic Crab Harmonic Pattern Indicator MT5
- Indicadores
- Eda Kaya
- Versão: 2.1
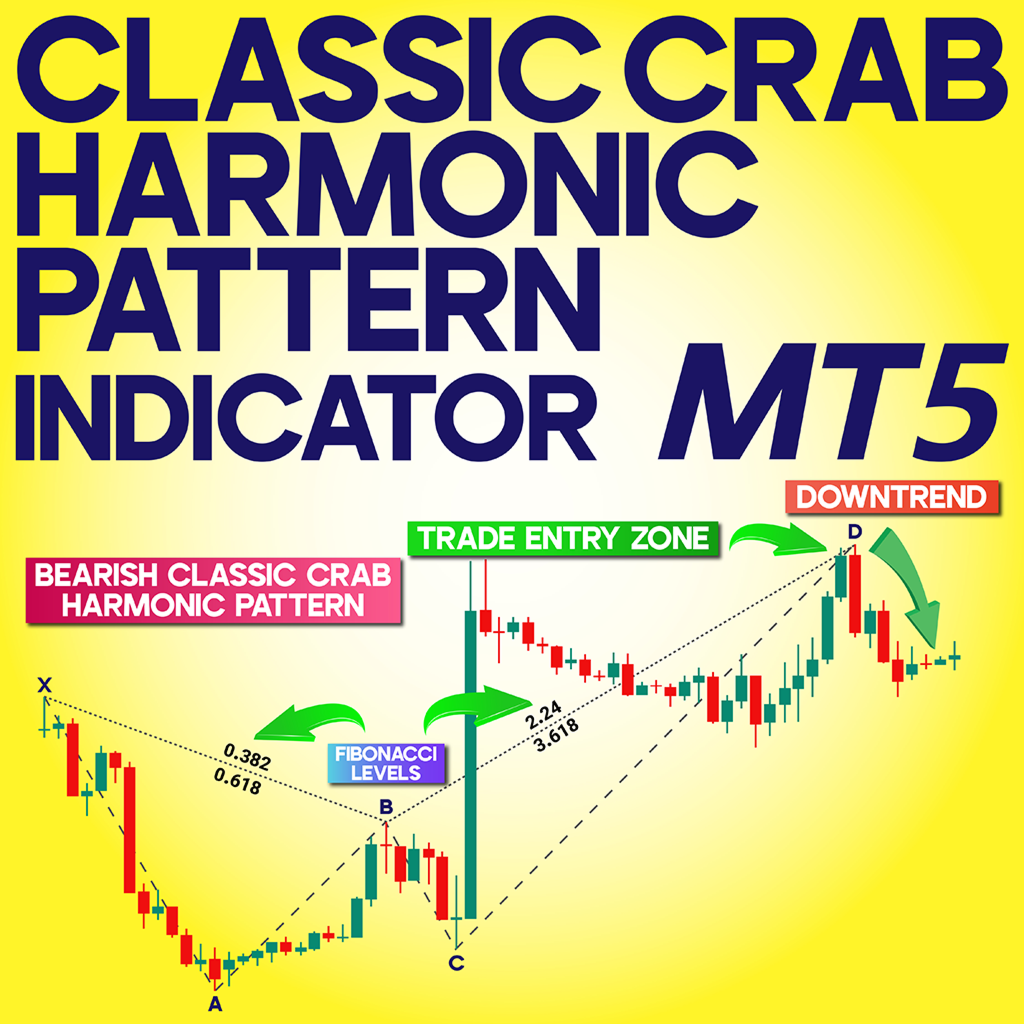
Classic Crab Harmonic Pattern Indicator for MetaTrader 5
The Classic Crab Harmonic Pattern, introduced by Scott Carney in 2000, is one of the most recognized harmonic patterns in technical analysis. Known for its precise Fibonacci measurements and favorable risk-to-reward ratio, it helps traders identify potential price reversal zones with accuracy.
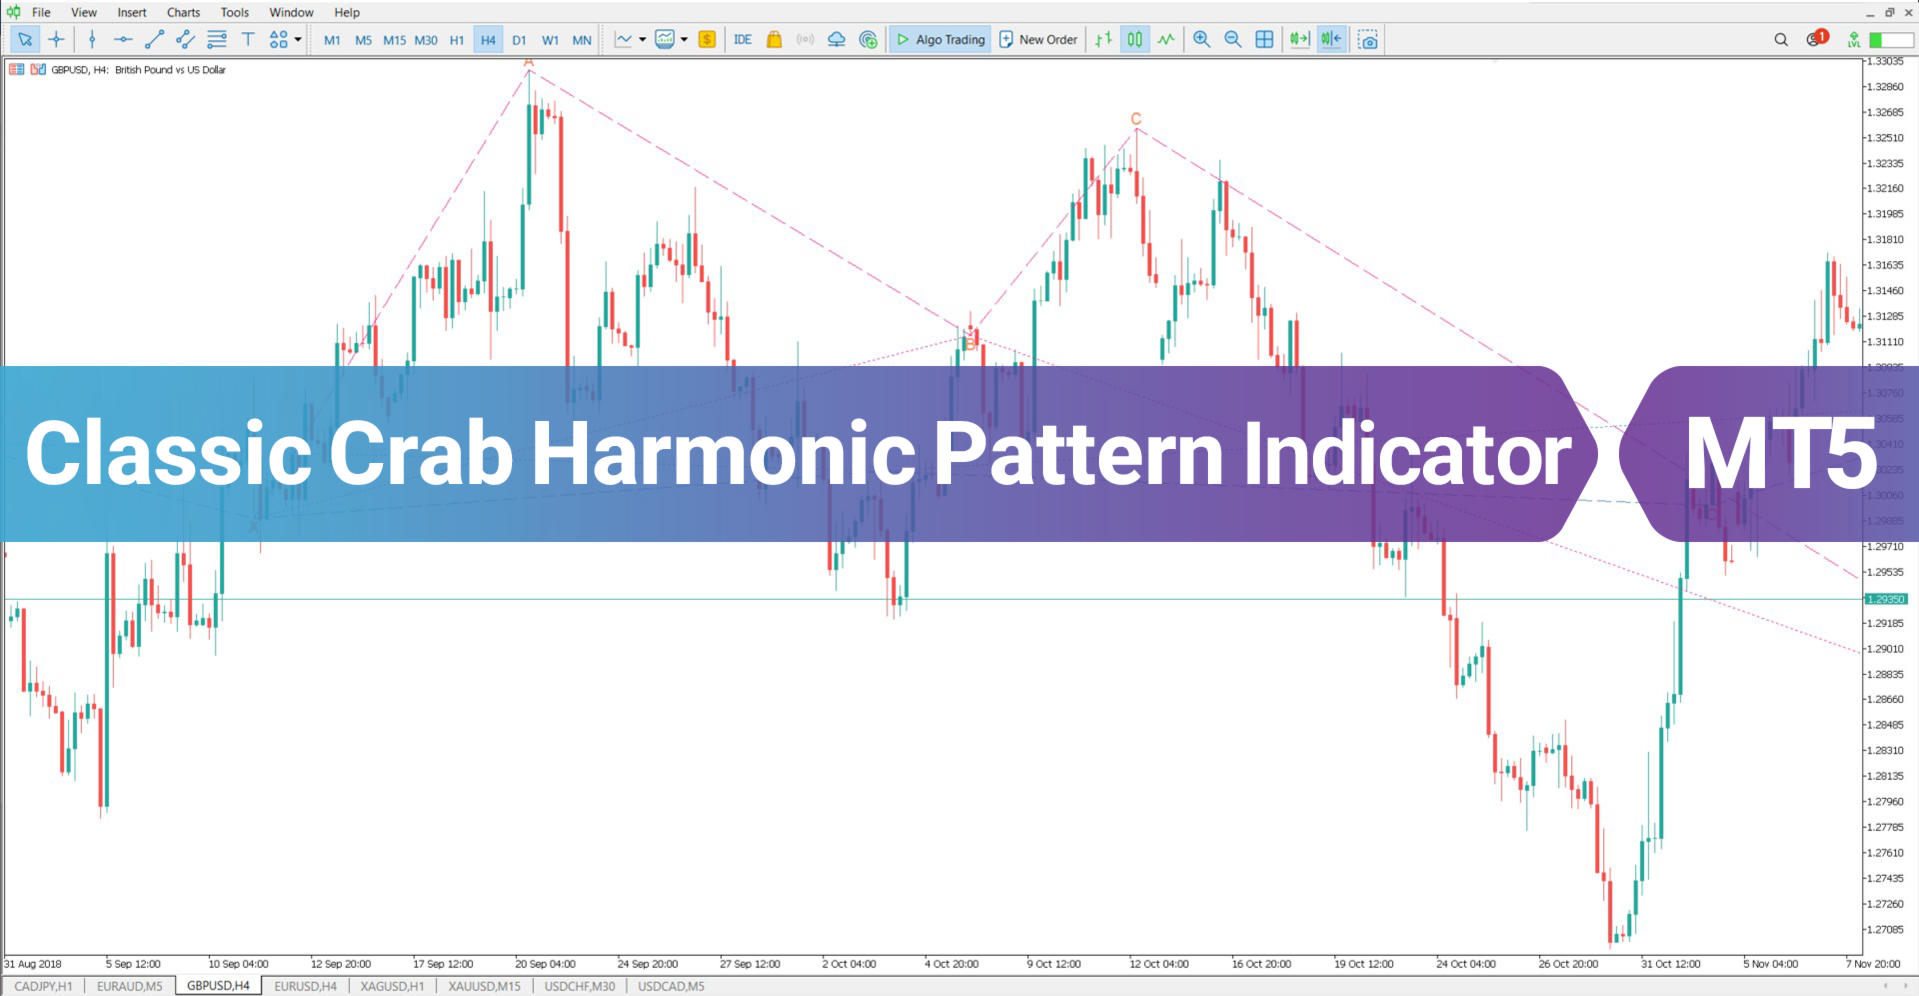
The Classic Crab Harmonic Pattern Indicator for MetaTrader 5 automatically detects this pattern on price charts, marking the key points X, A, B, C, and D. Bullish patterns appear in pink, while bearish ones are shown in blue.
«Indicator Installation & User Guide»
MT5 Indicator Installation | Classic Crab Harmonic Pattern Indicator MT4 | ALL Products By TradingFinderLab | Best MT5 Indicator: Refined Order Block Indicator for MT5 | Best MT5 Utility: Trade Assistant Expert TF MT5 | TP & SL Tool: Risk Reward Ratio Calculator RRR MT5 | Money Management: Easy Trade Manager MT5 | Trade Copier: Free Fast Local Trade Copier MT5 | Money management + prop protector: Trade Assist Prop Protector MT5
Classic Crab Harmonic Pattern Indicator Table
The following table summarizes the features of the Classic Crab Harmonic Pattern Indicator:
| Category | Harmonic Pattern – Support and Resistance – Classic and Chart Patterns |
| Platform | MetaTrader 5 |
| Skill Level | Intermediate |
| Indicator Type | Continuation – Reversal |
| Timeframe | Multi-Timeframe |
| Trading Style | Day Trading |
| Market | All Markets |
Indicator at a Glance
This MT5 Harmonic Pattern Indicator uses Fibonacci ratios to identify Price Reversal Zones (PRZ) based on the structure of the Crab pattern:
-
AB leg: Retraces between 38.2% and 61.8% of the XA leg
-
BC leg: Retraces either 38.2% or 88.6% of the AB leg
-
CD leg: If BC retraces 38.2%, the CD leg typically extends to 224% of BC
-
CD relative to XA: The CD leg should reach 161.8% of the XA leg, marking point D as the potential PRZ
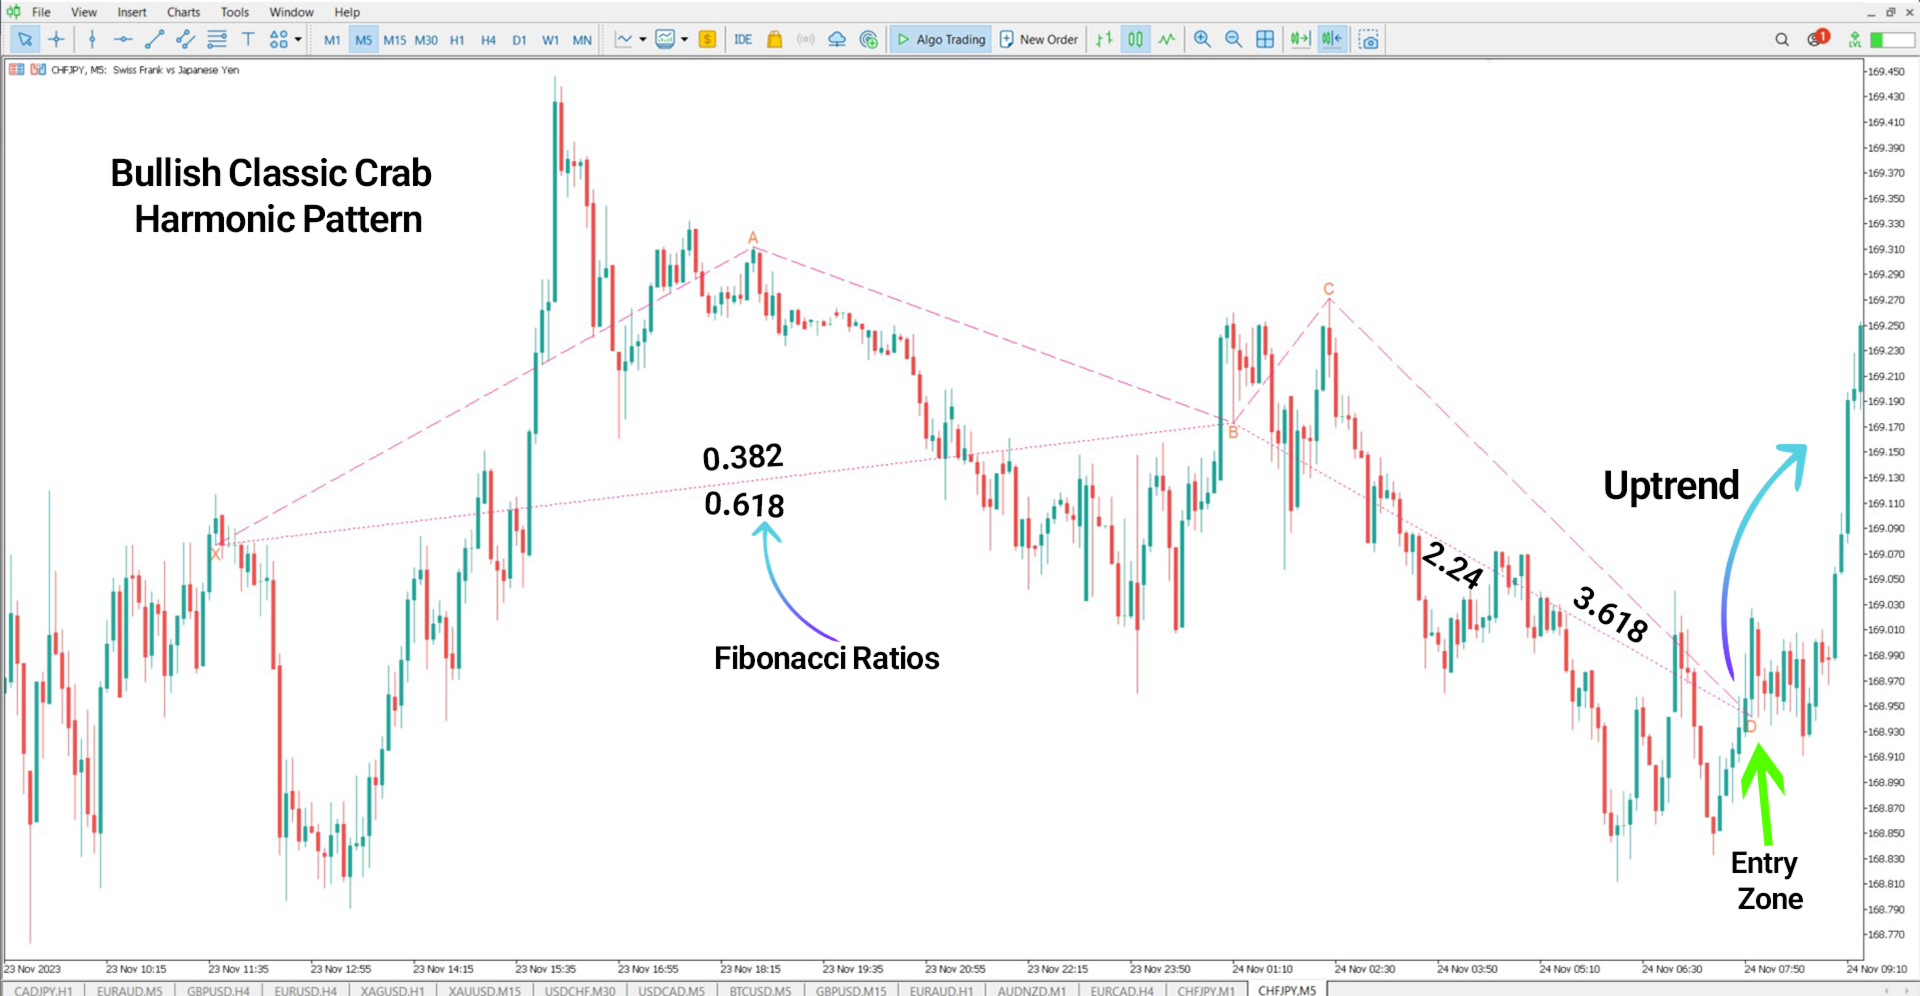
Indicator in an Uptrend
On the CHF/JPY chart, the indicator automatically highlights the PRZ. At point D, the price reverses to the upside, confirming a bullish reversal from that level.
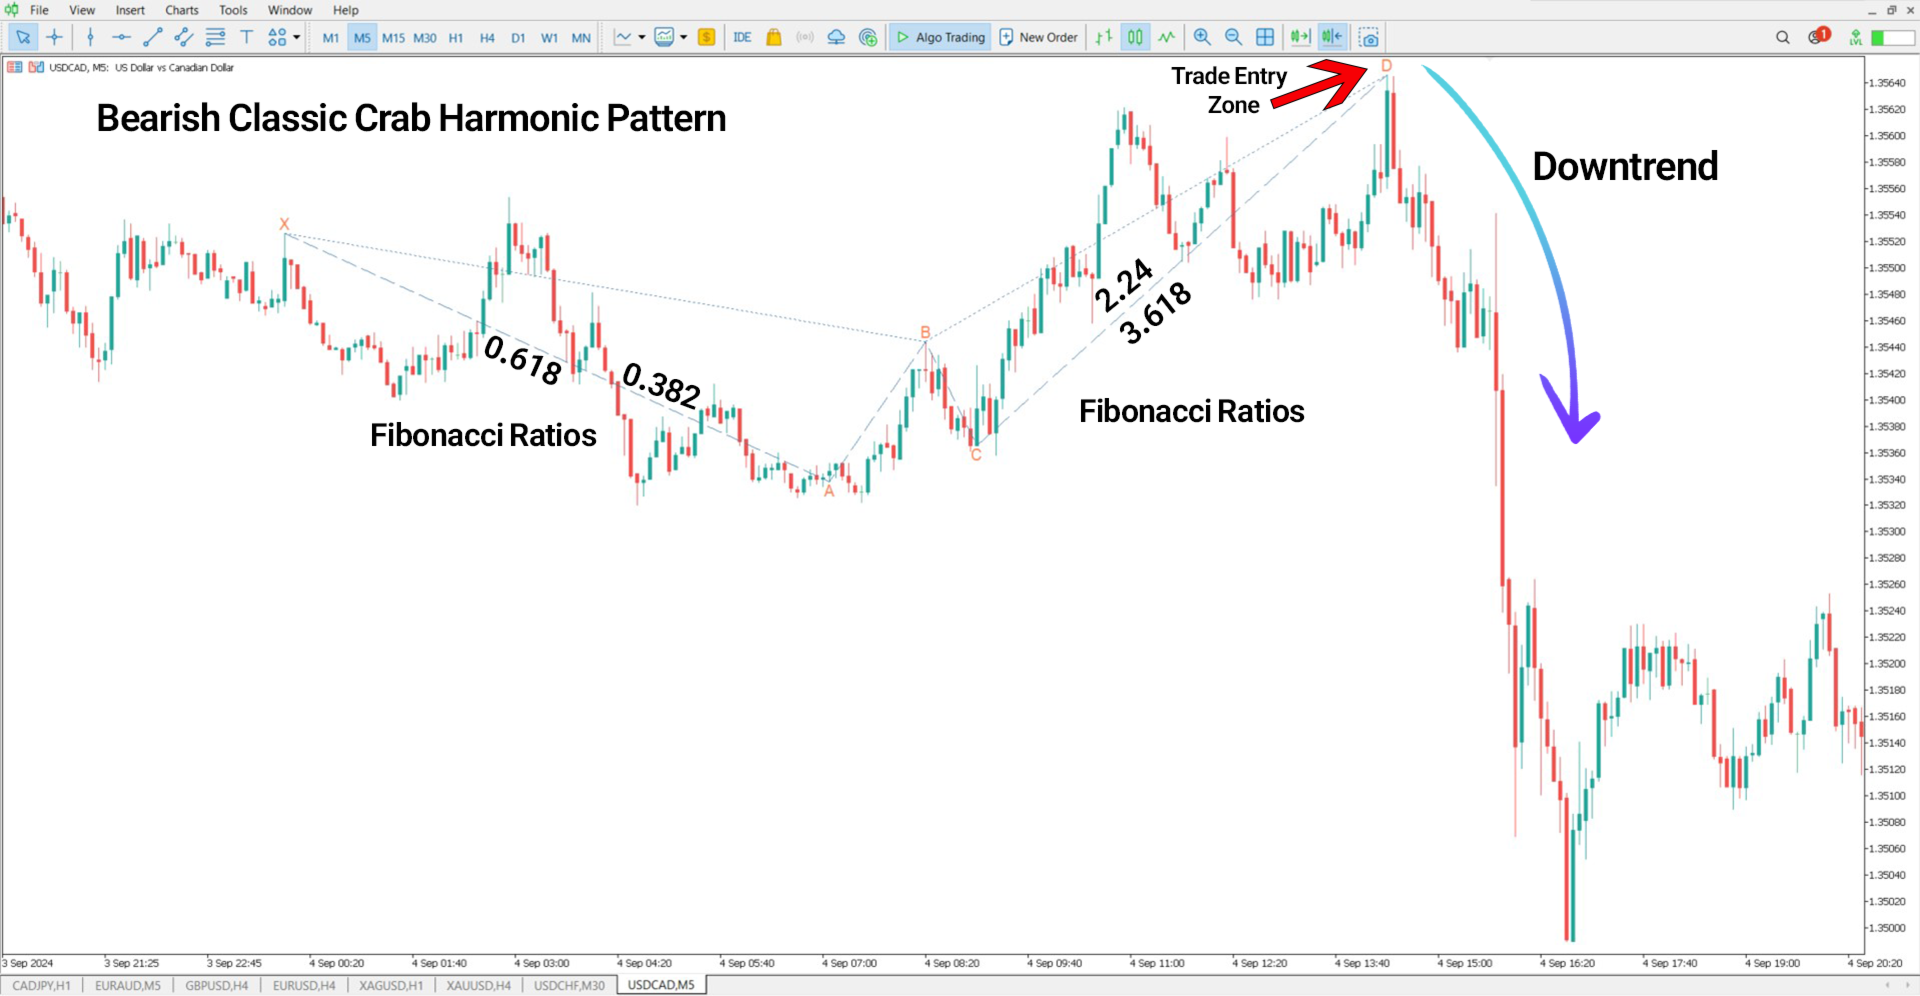
Indicator in a Downtrend
In the USD/CAD 5-minute chart, the indicator plots a bearish Crab pattern. After a confirmation signal at point D, traders can consider entering a sell position with a stop-loss placed just before the PRZ.
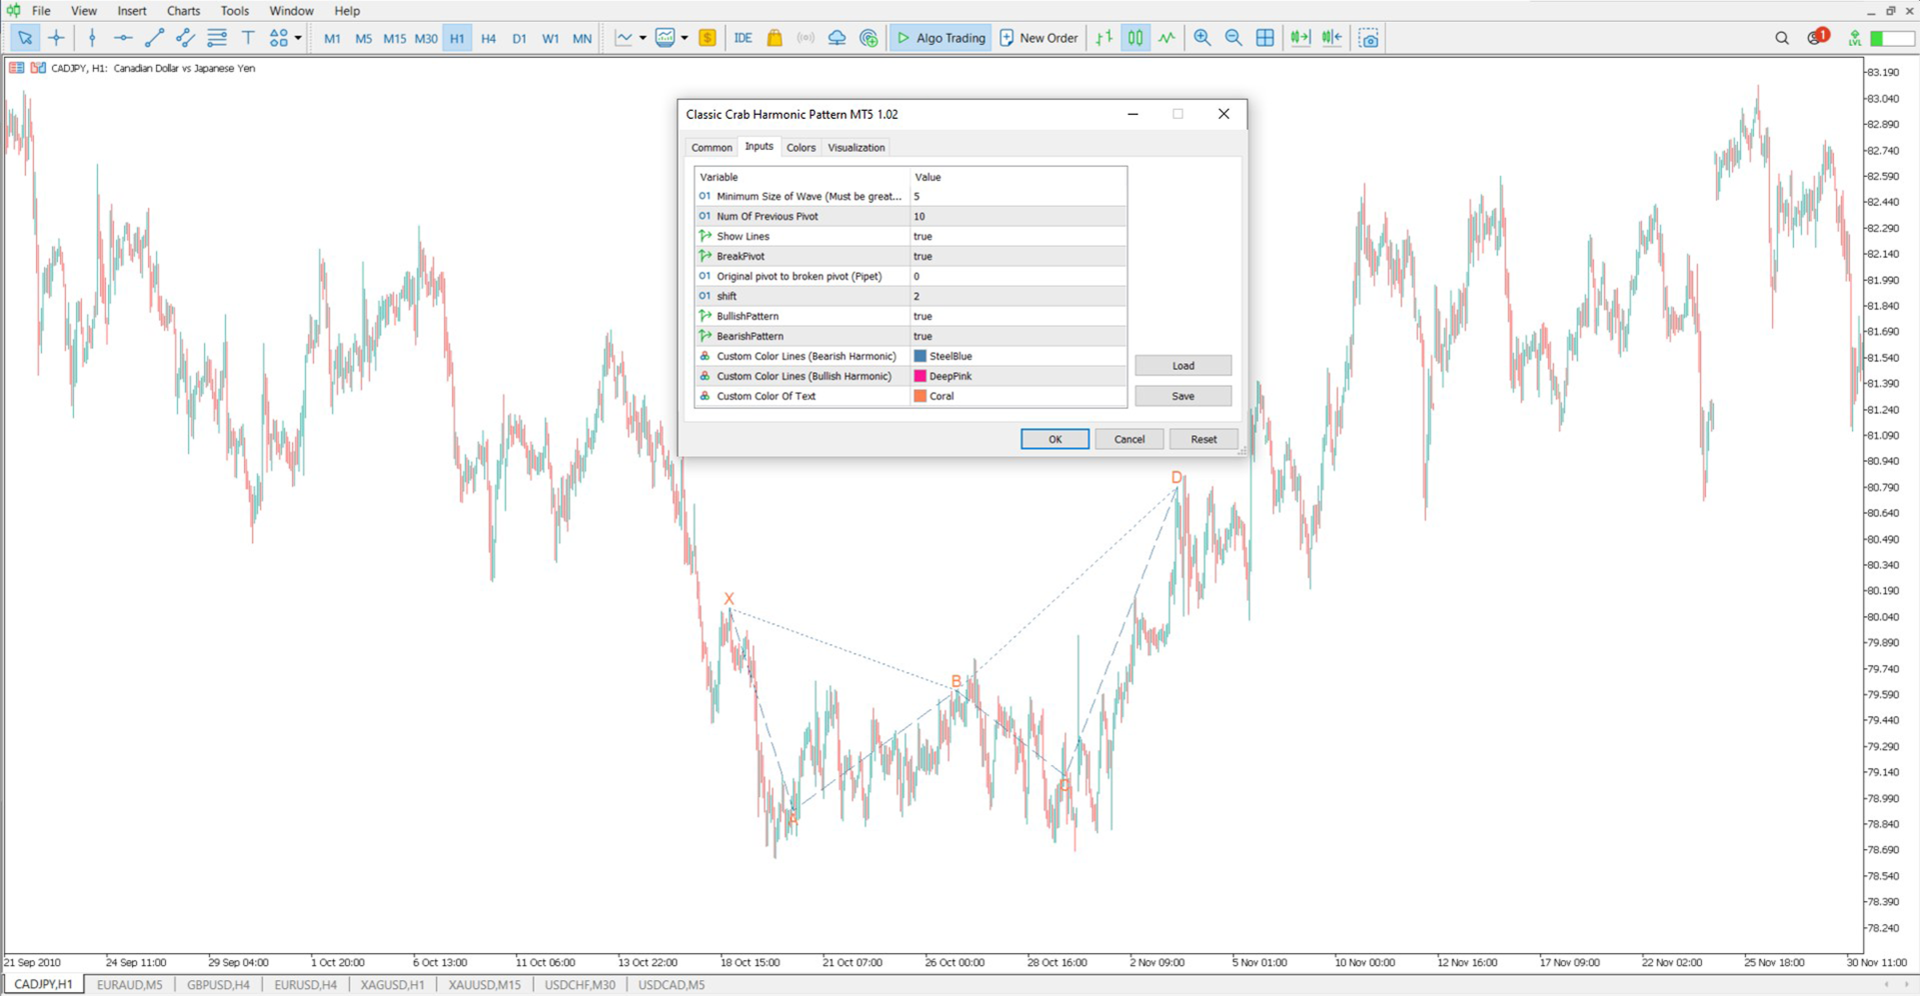
Classic Crab Harmonic Pattern Indicator Settings
-
Minimum Length of Wave (candle): Defines the minimum wave length in candle count
-
Num Of Previous Candle: Sets the number of candles used for detecting patterns
-
Show Lines: Toggle visibility of pattern lines
-
BreakPivot: Option to confirm pivot breakouts
-
Original Pivot to Broken Pivot (Pipet): Distance in pipettes between pivots
-
Shift: Controls how much data is offset on the chart
-
BullishPattern: Enable detection of bullish Crab formations
-
BearishPattern: Enable detection of bearish Crab formations
-
Style Of Line: Select the line style for visual display
-
Width Of Line: Adjust the line thickness
-
Custom Color Lines (Bearish Harmonic): Set the line color for bearish patterns
-
Custom Color Lines (Bullish Harmonic): Set the line color for bullish patterns
-
Custom Color Of Text: Customize the text color shown on the chart
Conclusion
The Classic Crab Harmonic Pattern Indicator enables traders to automatically identify both bullish and bearish Crab patterns on price charts. In bullish setups, price tends to rise after reaching point D, while in bearish formations, a downward movement is expected.
This tool helps traders spot precise reversal zones using a reliable and time-tested harmonic structure.