ACD Indicator MT4
- Indicadores
- Eda Kaya
- Versão: 2.1
ACD Indicator for MetaTrader 4
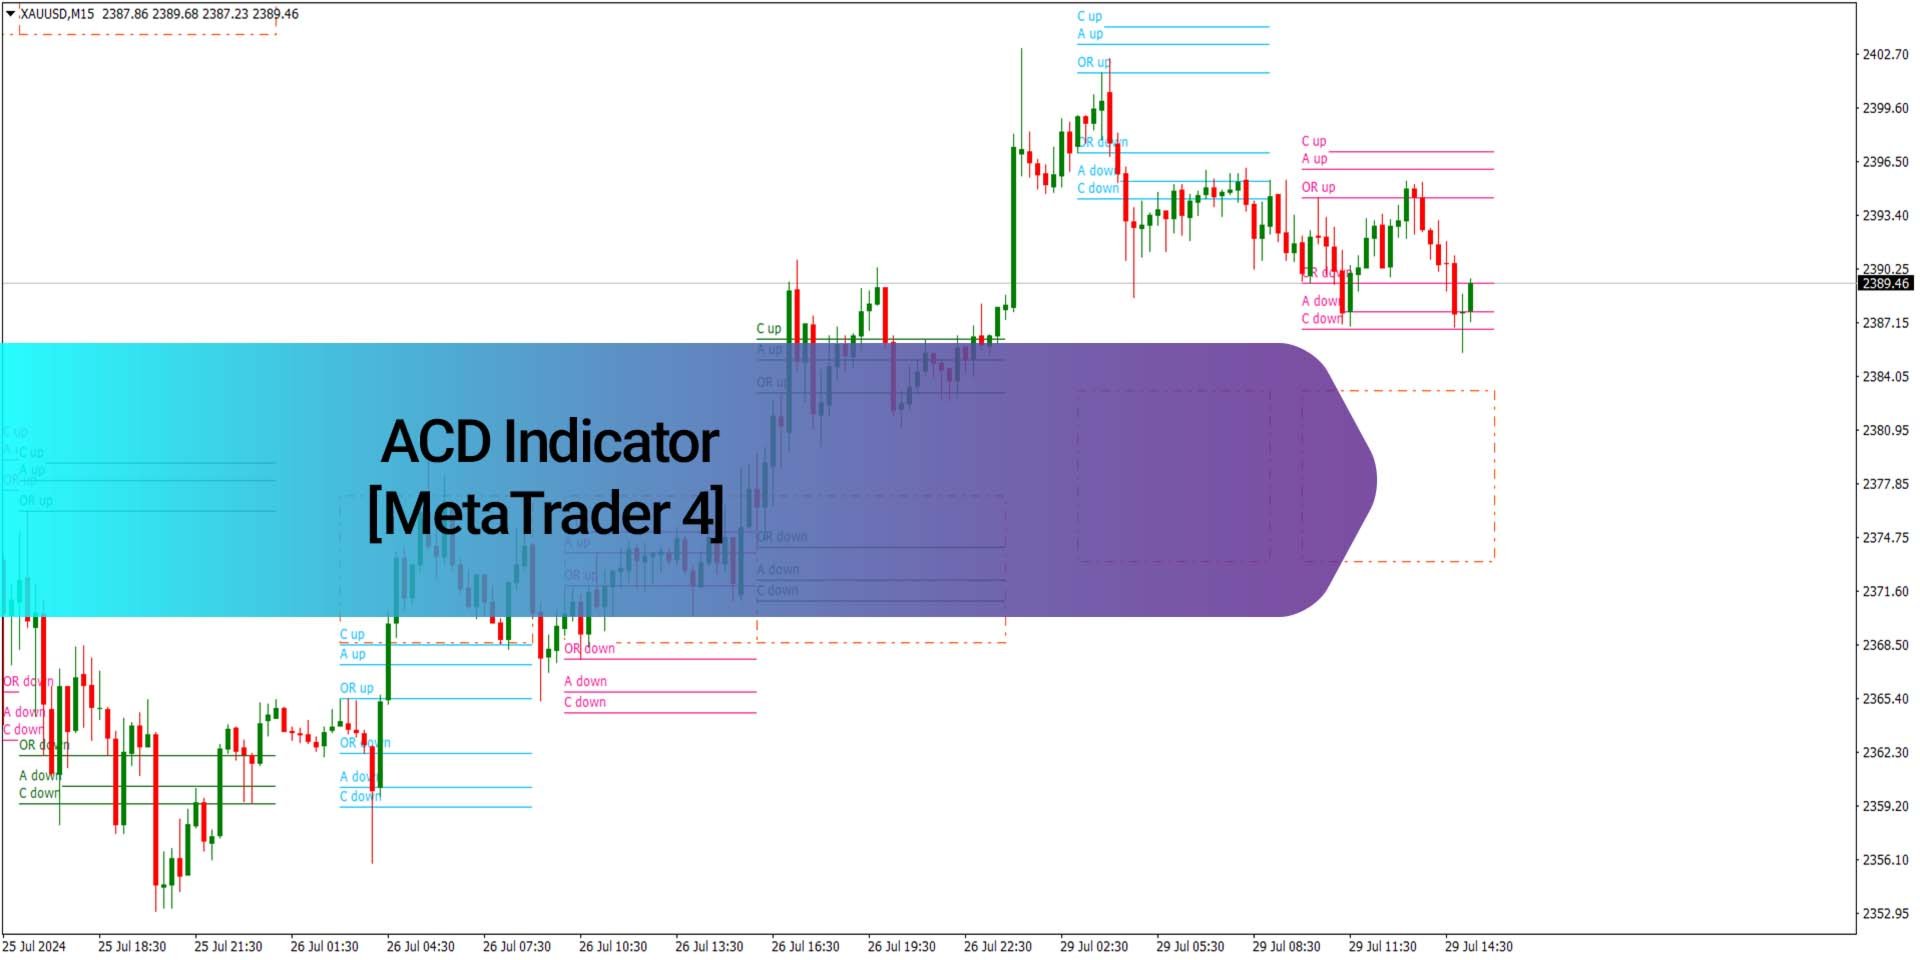
The ACD indicator, developed by Mark Fisher, is a technical analysis tool in MetaTrader 4 used to detect potential market trends and assess trend strength. The ACD system is built around identifying the market’s Opening Range (OR) and using it to establish key trading levels.
This range typically includes the first 30 minutes to one hour of market activity. After defining the OR, traders identify levels A and C, derived from it, to guide trading decisions. These levels are set above and below the OR and act as thresholds the market must reach to confirm a breakout trend.
«Indicator Installation & User Guide»
MT4 Indicator Installation | ACD Indicator Download MT5 | ALL Products By TradingFinderLab | Best MT4 Indicator: Refined Order Block Indicator for MT4 | Best MT4 Utility: Trade Assistant Expert TF MT4 | TP & SL Tool: Risk Reward Ratio Calculator RRR MT4 | Prop Firm Protector: Trade Assist Prop Firm Plus TF Expert MT4 | Money Management + DrawDown Protector: Trade Panel Prop Firm Drawdawn Limiter Pro MT4
Indicator Table
| Category | Price Action - Levels - Supply and Demand |
| Platform | MetaTrader 4 |
| Skill Level | Intermediate |
| Indicator Type | Range - Breakout |
| Timeframes | 5 minutes - 15 minutes - 30 minutes |
| Trading Style | Scalping - Day Trading |
| Markets | Forex – Stocks - Commodities |
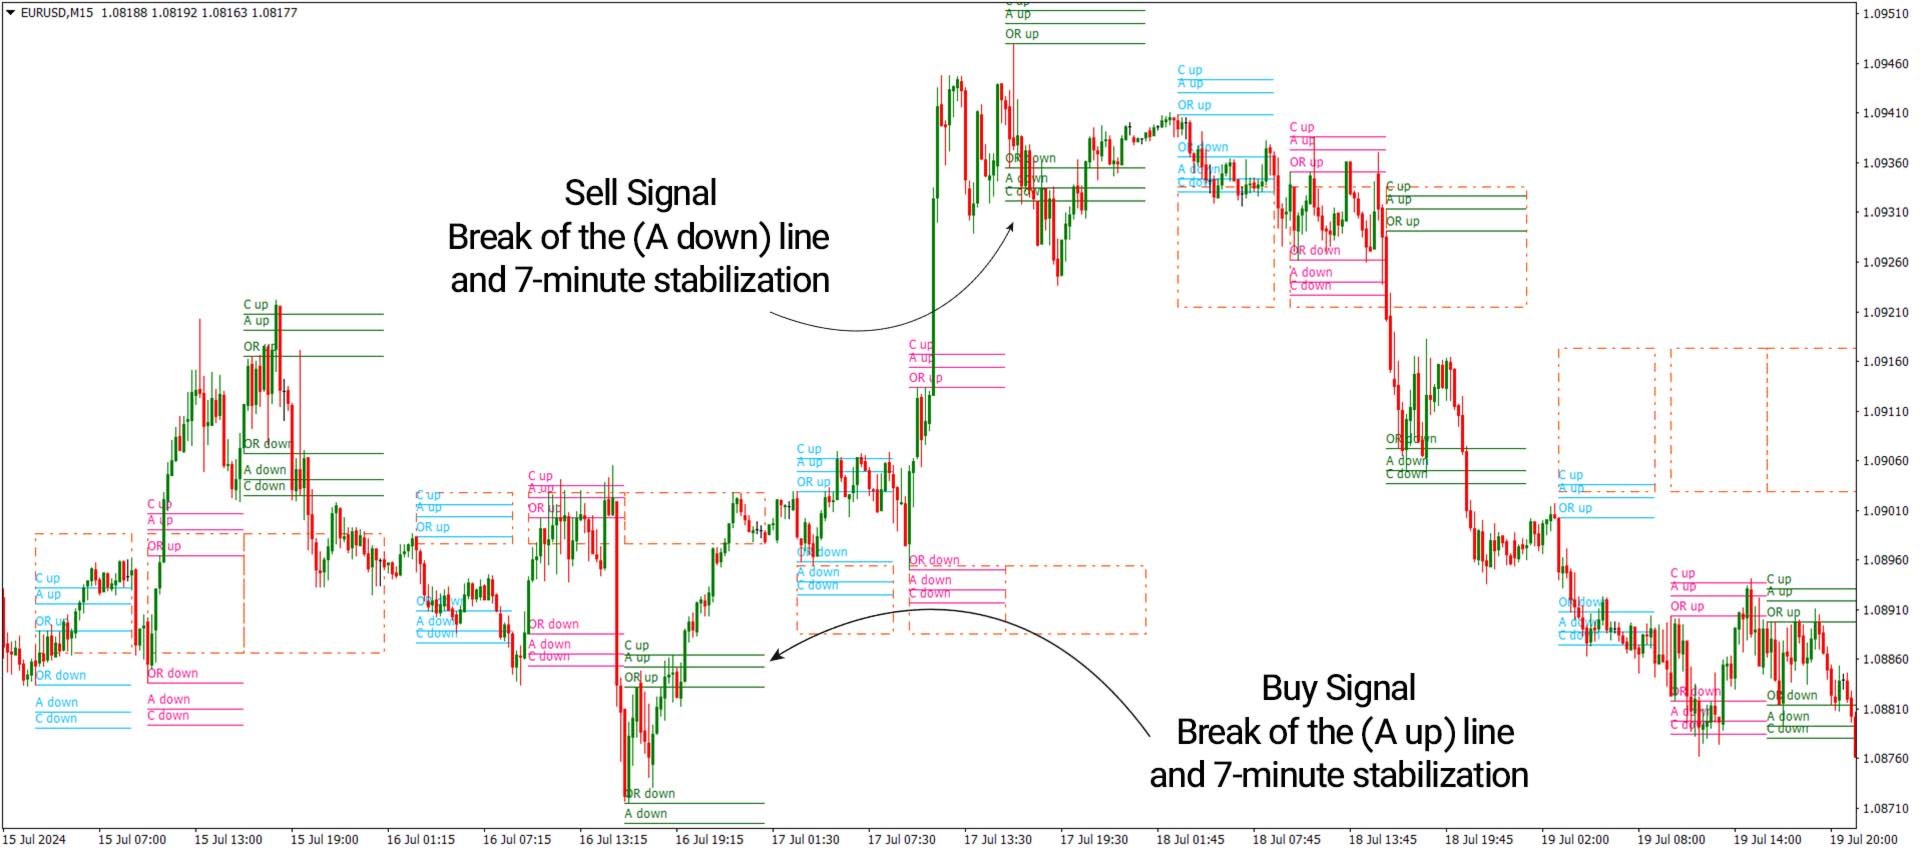
In the image below, the 15-minute chart of EUR/USD is shown. A buy signal is generated when the price moves above the A up level and holds above it for 7 minutes—signaling an uptrend and a potential buy opportunity. Conversely, a sell signal is issued when the price breaks below the A down level and remains there for 7 minutes—indicating a downtrend and potential sell opportunity.
Overview
The ACD trading strategy is a breakout method that performs best in volatile or strongly trending markets such as crude oil (Brent) or individual stocks. When the price is above the Pivot level, the trend is considered bullish; when it is below, the trend is bearish. This system also functions as a tool to measure the balance between supply and demand in the market.
By analyzing price and volume behavior, it helps traders determine trend strength and identify ideal entry and exit points.
Bullish Signal Conditions (Bullish Setup)
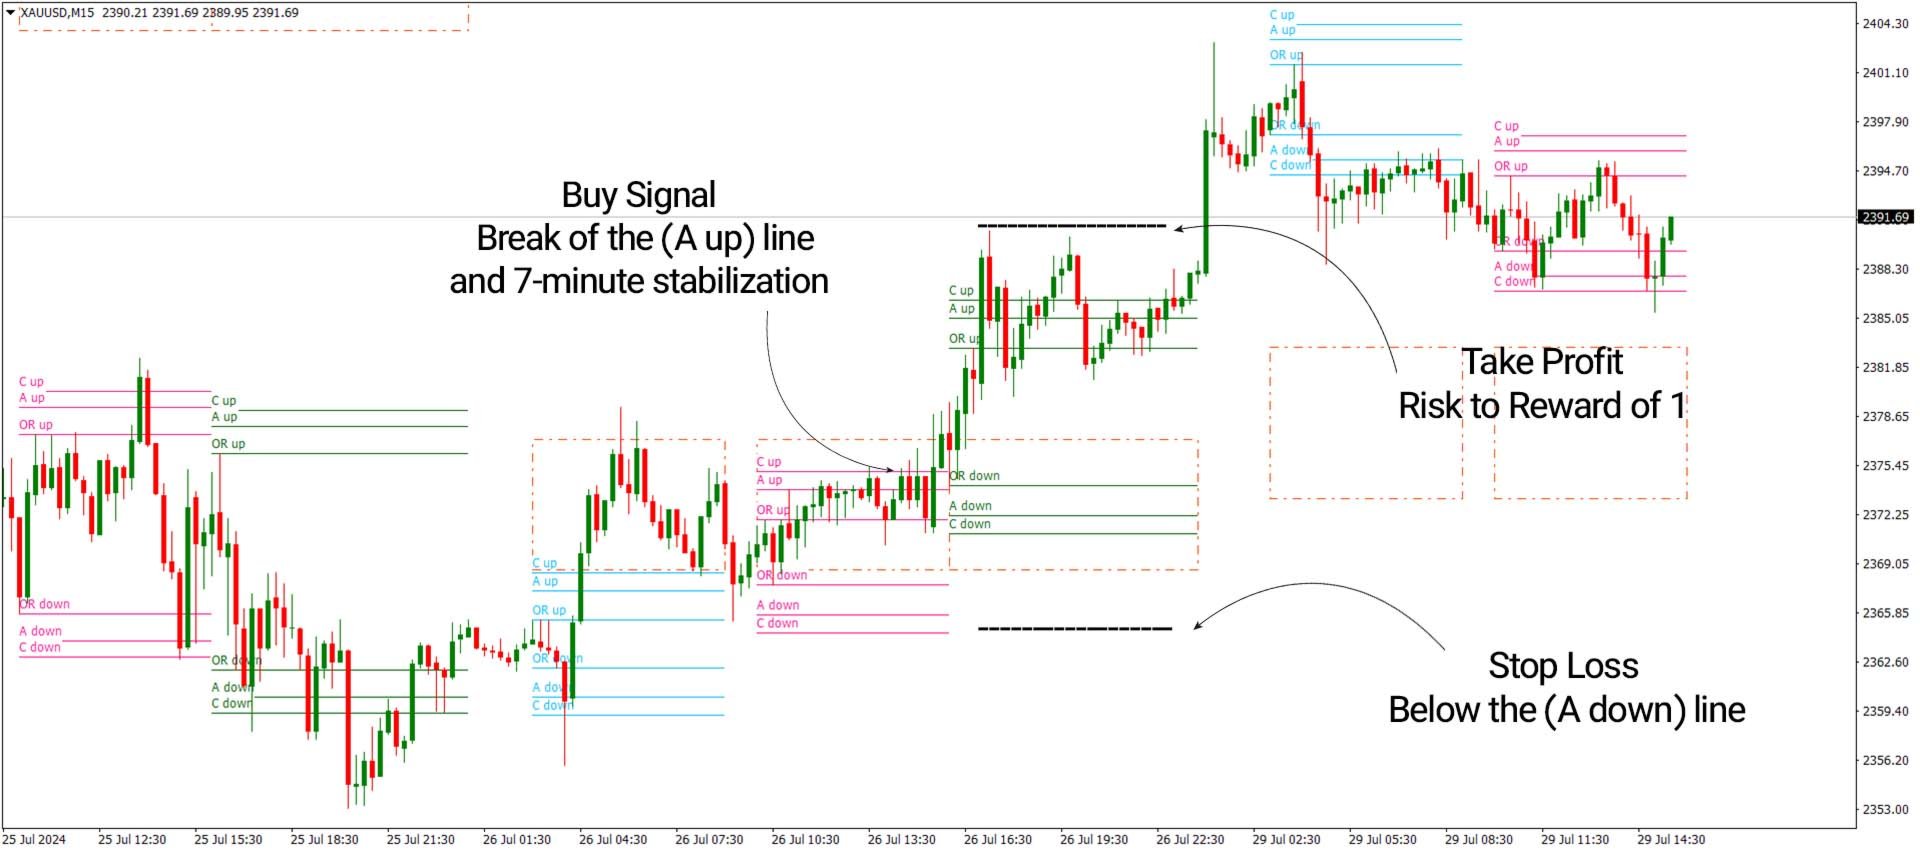
In the image below, the 15-hour chart of Gold (XAU/USD) is shown. Once the price breaks above the A up level, it is recommended to wait for price stabilization to avoid a false breakout. If the price holds above this level for 7 minutes, a buy position can be considered.
Take Profit and Stop Loss for Buy Trades
After entering a buy position, a good stop loss level would be just below the A down line. The recommended reward-to-risk ratio for this strategy is 1:1, which can be used to set the take profit level.
Bearish Signal Conditions (Bearish Setup)
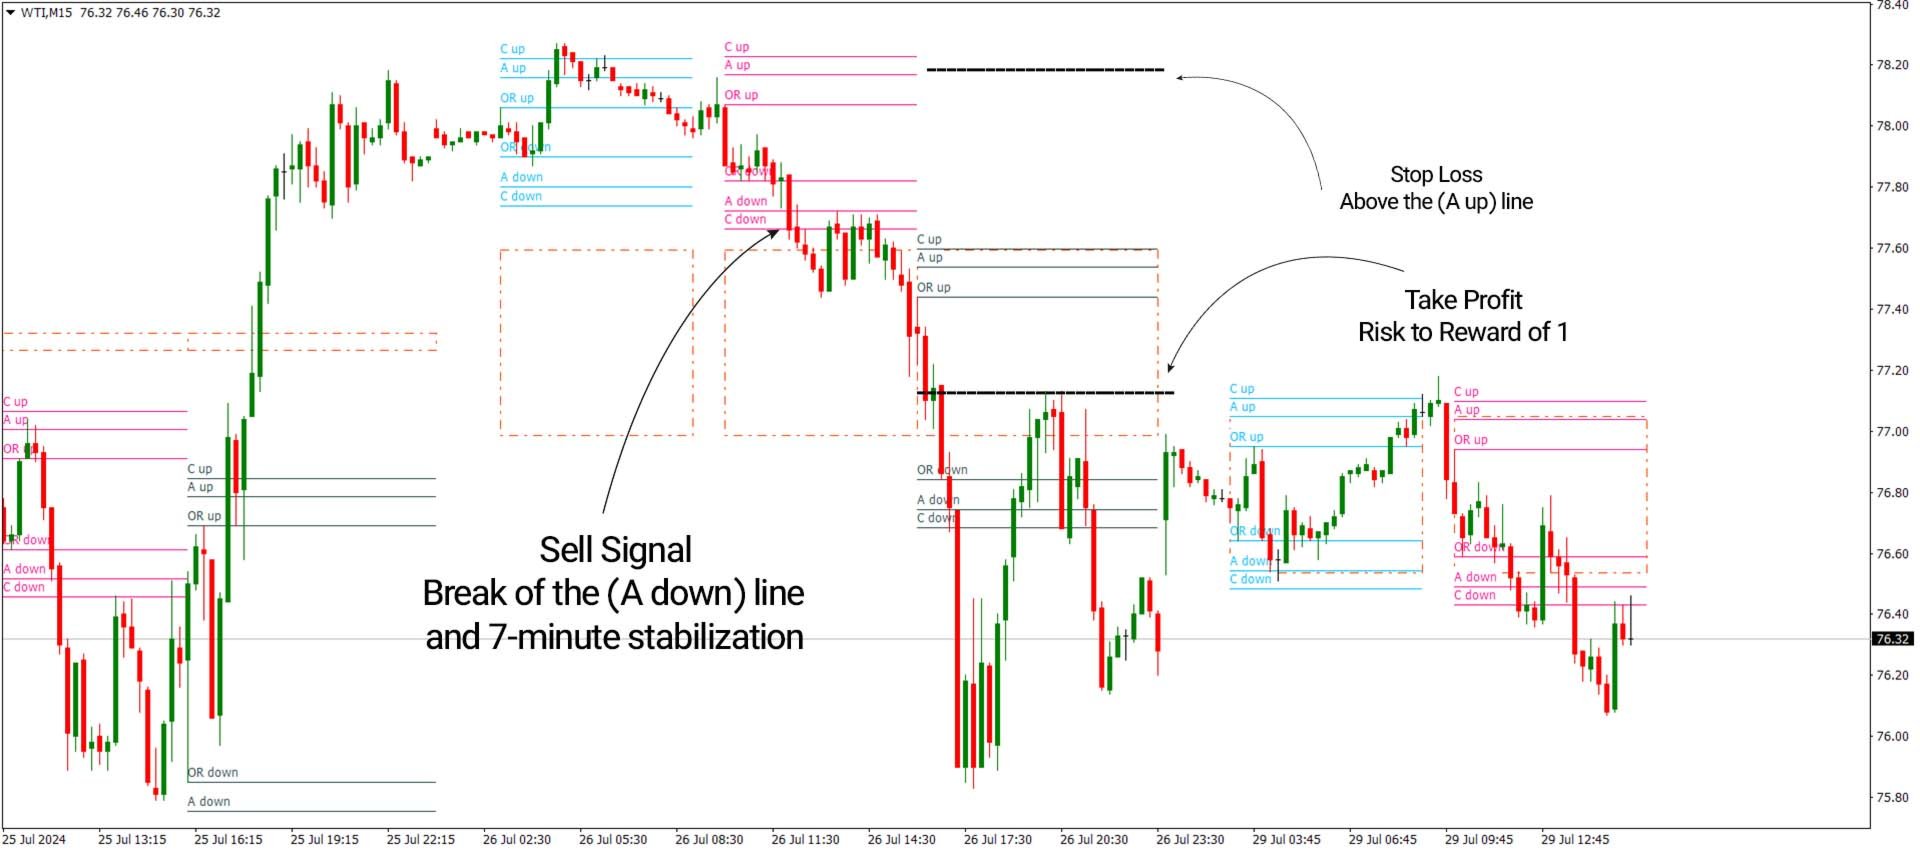
In the image below, the 30-minute chart of Texas Oil (WTI) is shown. When the price breaks below the A down level, traders should wait to confirm it's not a false breakout. If the price stabilizes below this level for 7 minutes, a sell position can be entered.
Take Profit and Stop Loss for Sell Trades
After entering a sell position, the stop loss should be placed above the A up line. The ideal reward-to-risk ratio is 1:1, which helps determine the appropriate take profit level.
ACD Indicator Settings
- ATR Period (Daily): Default is 3 for daily calculations
- UTC Time (true) / Local Time (false): Set to TRUE to use UTC time
- Number of Candles for Lines: Uses 1000 previous candles
- ShowBox: TRUE
- Previous Candle for Box (Daily): Uses previous daily candle
- ColorBox: OrangeRed
- FillBox: FALSE (hollow box)
- BoxStyle: Dashdot
- TokyoACD: TRUE
- Tokyo Opening Range Time: First 45 minutes of Tokyo session
- Start Tokyo Time (HH): 00:00
- End Tokyo Time (HH): 06:00
- A Level Multiplier (%): 5
- C Level Multiplier (%): 8
- Color of Tokyo Lines: Blue (or as preferred)
- LondonACD: TRUE
- London Opening Range Time: First 45 minutes of London session
- Start London Time (HH): 07:00
- End London Time (HH): 13:00
- A Level Multiplier (%): 5
- C Level Multiplier (%): 8
- Color of London Lines: Pink (or as preferred)
- NewYorkACD: TRUE
- New York Opening Range Time: First 45 minutes of New York session
- Start New York Time (HH): 13:00
- End New York Time (HH): 22:10
- A Level Multiplier (%): 5
- C Level Multiplier (%): 8
- Color of New York Lines: Yellow (or as preferred)
Conclusion
The ACD indicator is a powerful strategy tool that identifies high-potential trading levels. It adapts to various timeframes and trading styles and helps determine market direction by referencing the Opening Range (OR). Additionally, it provides clearly defined entry and exit points, making it valuable for informed and strategic trading decisions.