• Visão global
  • Comentários
  • Discussão

Managed Trades

This utility is specifically designed for No Nonsense Forex traders.

What it does:-

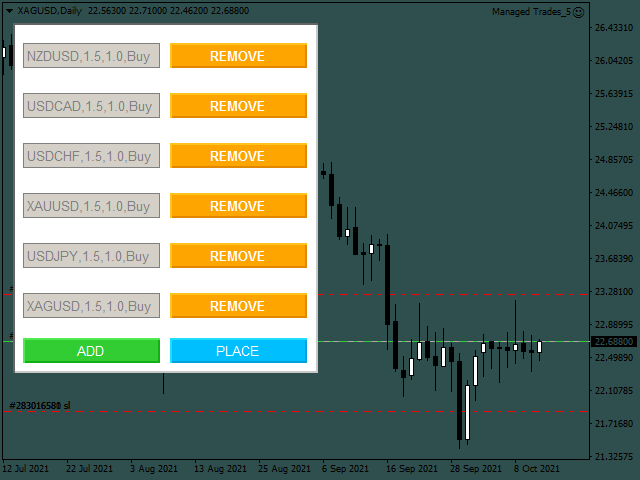
  • Let traders add or remove symbols to trade
  • Editable boxes in panel for updating inputs
  • Automatically applies money management to the trades
  • Places all orders with a single click 

How it calculates:-

  • Two trades are opened per symbol
  • By default max risk per trade is 1%
  • By default total risk is 6% which can changed in inputs tab(recommended to keep it 6 or below) 
  • On addition of symbols the total risk will be divided equally among all assets. For example if total added symbols are 6 then risk will be 1% per symbol and 0.5% per trade
  • Risk can be by account balance or equity which can be selected in inputs tab also
  • Volatility metric for lot calculation is ATR(Average True Range)
  • Editable inputs are in format(Symbol,Stop loss multiplier,Take profit multiplier,Order type). The first input is a constant and doesn't need to be changed

What it doesn't do:-

The utility doesn't check if sessions are opened for all added symbols so the user needs be aware of the session status of the symbol added. Roll over times need to taken into consideration also.

Produtos recomendados
O indicador SMC Venom Model BPR é uma ferramenta profissional para os traders que trabalham com o conceito Smart Money (SMC). Identifica automaticamente dois padrões principais no gráfico de preços: FVG   (Fair Value Gap) é uma combinação de três velas, em que existe um gap entre a primeira e a terceira velas. Forma uma zona entre níveis onde não há suporte de volume, o que geralmente leva a uma correção de preço. BPR   (Balanced Price Range) é uma combinação de dois padrões FVG que formam uma “
Set TP & SL by Price – Auto Order Modifier for MT4 Define automaticamente níveis exactos de TP e SL em qualquer ordem ️ Funciona com todos os pares e EAs, com filtro por símbolo ou magic number Este Expert Advisor permite-te definir níveis exactos de Take Profit (TP) e Stop Loss (SL) usando valores de preço directos (ex: 1.12345 no EURUSD). Sem pips ou pontos — apenas gestão precisa de ordens com opção de aplicar a todas ou filtrar por gráfico ou número mágico. Funcionalidades principai
Golden Flash Scalper
Felipe Jose Costa Pereira
Principais Características: O Golden Scalper XAU/USD foi criado para se adaptar às nuances do mercado de ouro, proporcionando sinais de alta qualidade Análise Avançada de Padrões: Usando técnicas de análise de padrões de preços, o indicador identifica as melhores oportunidades de entrada, evitando os falsos sinais e aumentando as chances de sucesso a cada operação. Alta Taxa de Assertividade: Baseado em algoritmos inteligentes, o indicador tem uma taxa de assertividade superior, proporcionando a
Program Overview: This program is a trading tool designed to monitor and analyze the 7 major currency pairs. It is a variant of a similar program used for tracking stock indices, but this version focuses on the seven major currency pairs. The program helps in identifying and calculating significant price movements (gaps) between the high and low prices of these currency pairs over a specified time frame. It then provides insights through comments and alerts based on the calculated gaps. Major Cu
The indicator allows you to trade binary options. The recommended time frame is М1 and the expiration time is 1,2,3 minutes. The indicator suitable for auto and manual trading. A possible signal is specified as a arrows above/under a candle. You should wait until the candle closes! Arrows are not re-painted Trade sessions: TOKYO section (Half-end) Currency pairs: USD/JPY Working time frame: M1 Expiration time: 1,2,3 minutes. The indicator also shows good results when using the martingale strateg
FREE
Super Reversal Pattern
Parfait Mujinga Ndalika
Super Reversal Pattern Indicator Unlock the power of advanced pattern recognition with our Super Reversal Pattern Indicator. Designed for traders seeking precision and reliability, this indicator identifies one of the most effective reversal patterns in technical analysis, offering a significant edge in your trading strategy. Key Features: Non-Repainting Accuracy: Enjoy the confidence of non-repainting technology. Once a Super Reversal Pattern is detected, it remains static, providing consiste
Antabod Gamechanger
Rev Anthony Olusegun Aboderin
*Antabod GameChanger Indicator – Transform Your Trading!*   Are you tired of chasing trends too late or second-guessing your trades? The *Antabod GameChanger Indicator* is here to *revolutionize your trading strategy* and give you the edge you need in the markets!   Why Choose GameChanger? *Accurate Trend Detection* – GameChanger identifies trend reversals with *pinpoint accuracy*, ensuring you enter and exit trades at the optimal time.   *Clear Buy & Sell Signals* – No more guesswork! T
VR Cub
Vladimir Pastushak
VR Cub é um indicador para obter pontos de entrada de alta qualidade. O indicador foi desenvolvido para facilitar cálculos matemáticos e simplificar a busca por pontos de entrada em uma posição. A estratégia de negociação para a qual o indicador foi escrito tem provado a sua eficácia há muitos anos. A simplicidade da estratégia de negociação é a sua grande vantagem, o que permite que até mesmo os comerciantes novatos negociem com sucesso com ela. VR Cub calcula os pontos de abertura de posição e
Master Scalping M1 é um indicador inovador que usa um algoritmo para determinar a tendência de forma rápida e precisa. O indicador calcula o tempo de abertura e fechamento de posições, os algoritmos do indicador permitem encontrar os momentos ideais para entrar em uma negociação (comprar ou vender um ativo), o que aumenta o sucesso das transações para a maioria dos traders. Benefícios do indicador: Fácil de usar, não sobrecarrega o gráfico com informações desnecessárias. Pode ser usado como filt
Daily Candle Predictor é um indicador que prevê o preço de fechamento de uma vela. O indicador destina-se principalmente ao uso em gráficos D1. Este indicador é adequado tanto para negociação forex tradicional quanto para negociação de opções binárias. O indicador pode ser usado como um sistema de negociação autônomo ou pode atuar como um complemento ao seu sistema de negociação existente. Este indicador analisa a vela atual, calculando certos fatores de força dentro do próprio corpo da vela, be
Horizontal tick volumes (HTV) Horizontal tick volumes - an easy and convenient indicator of a horizontal market profile in a user-selected time. Produces a visual image of strong trading levels by maximum peaks past volumes and trading direction by color (sell or buy), and also allows you to detect smaller trading levels by differentiating past volumes. In the "Optimal" mode, when displayed on chart periods up to and including "M30", the data of one-minute bars are used, on H1 and H4 - five-minu
Noize Absorption Index MT4
Ekaterina Saltykova
5 (1)
Noize Absorption Index - is the manual trading system that measures the difference of pressure between bears forces and bulls forces. Green line - is a noize free index that showing curent situation. Zero value of index shows totally choppy/flat market.Values above zero level shows how powerfull bullish wave is and values below zero measures bearish forces.Up arrow appears on bearish market when it's ready to reverse, dn arrow appears on weak bullish market, as a result of reverse expectation. S
Ugenesys AI MT4
Odaine Ramon Mcmillan
5 (1)
uGenesys AI - 90% Accurate Daytrading Indicator Introducing the ultimate forex trading indicator system, uGenesys AI, powered by cutting-edge AI technology and advanced analytical techniques, including Time-Series Analysis and Genetic Algorithms. Our AI-powered trading system leverages the power of time-series analysis to identify trends and patterns in historical price data, allowing traders to make informed predictions about future market movements. By analyzing vast amounts of data, our syst
Blahtech Market Profile
Blahtech Limited
4.53 (15)
Was: $249  Now: $149   Market Profile defines a number of day types that can help the trader to determine market behaviour. A key feature is the Value Area, representing the range of price action where 70% of trading took place. Understanding the Value Area can give traders valuable insight into market direction and establish the higher odds trade. It is an excellent addition to any system you may be using. Blahtech Limited presents their Market Profile indicator for the MetaTrader community. In
Uma das sequências numéricas é chamada de "Forest Fire Sequence". Foi reconhecida como uma das mais belas novas sequências. Sua principal característica é que essa sequência evita tendências lineares, mesmo as mais curtas. É esta propriedade que formou a base deste indicador. Ao analisar uma série temporal financeira, este indicador tenta rejeitar todas as opções de tendência possíveis. E somente se ele falhar, ele reconhece a presença de uma tendência e dá o sinal apropriado. Esta abordagem pe
Description: Please tick "Show object descriptions" in chart properties to enable hrays views That utility converts a trendline into a horizontal ray known as tool for drawing supply and demand zones. Simply create a trendline on a chart and once selected, it will get converted. Ray remains horizontal while dragging.  Quick ray plot: press "R" key to create horizontal ray. It will be snapped to the nearest OHLC value Further versions will be improved. For feature request please post new comm
Indicador único que implementa uma abordagem profissional e quantitativa para significar negociação de reversão. Ele capitaliza o fato de que o preço desvia e retorna à média de maneira previsível e mensurável, o que permite regras claras de entrada e saída que superam amplamente as estratégias de negociação não quantitativas. [ Installation Guide | Update Guide | Troubleshooting | FAQ | All Products ] Sinais de negociação claros Incrivelmente fácil de negociar Cores e tamanhos personalizáveis
For sure, this indicator has become very popular amongst traders. Through coding this indicator will give you the most accurate levels possible for your trading analysis. We have also added in the ability for you to receive alerts when the price breaks above or below a Support or Resistance lines! HOW TO USE The red rectangles represent your resistance/supply zone. The green rectangles represent your support/demand zone.  BONUS FEATURES We coded this indicator with the ability to switch between
Profile Map
Dmitriy Sapegin
5 (11)
Market Profile helps the trader to identify the behavior if major market players and define zones of their interest. The key feature is the clear graphical display of the range of price action, in which 70% of the trades were performed. Understanding of the location of volume accumulation areas can help traders increase the probability of success. The tool can be used as an independent system as well as in combination with other indicators and trading systems. this indicator is designed to suit
The Best One Scalping Trade Panel functional manual trade panel with risk reward, auto SL by candle ( original solution), lot size calculation, one-click trading, scale in and out of trades (partial close),  Works with all symbols not just currency pairs, perfect works on DAX, NASDAQ, GOLD, ...... I earn every day during live stream on ZakopiecFX - join Me Risk by lot Risk by percent SL by points SL by Candle, Renko, RangeBar ( original solution) TP by point TP by Risk/Reward Auto Trailing by P
EARLY REMINDER: The Starting price is 65 price will rise soon up to 365$ and then 750$ after first 10 copies of sales. Grab this offer now! Introduction Hello, traders! Welcome to the demonstration of the Forex Beast Indicator , a comprehensive tool designed to assist aspiring traders in navigating the complexities of the forex market. This indicator incorporates seven essential components to provide a well-rounded trading experience: Moving Averages Colored Zones Support and Resistance Levels
ICT Kill zone and Macros Indicator mark and display the following zone times on the chart: Kill zones   Kill zone Forex Asian London Open New York Open London Close Central Bank Dealing range Kill zone Indices Asian London Open New York AM New York Lunch New York PM Power Hour Macros London 1 London 2 New York Am 1 New York AM 2 New York Lunch New York PM 1 New York PM 2 Silver bullet London Open New York AM New York PM Sessions Asian London New York Chart The display of  Kill zone , Macro ,
O indicador Crypto_Forex "Auto FIBO Pro" é uma ótima ferramenta auxiliar na negociação! - O indicador calcula e coloca automaticamente no gráfico os níveis de Fibonacci e as linhas de tendência locais (cor vermelha). - Os níveis de Fibonacci indicam áreas-chave onde o preço pode reverter. - Os níveis mais importantes são 23,6%, 38,2%, 50% e 61,8%. - Pode utilizá-lo para scalping de reversão ou para negociação de grelha de zona. - Existem muitas oportunidades para melhorar o seu sistema atual u
We present you the indicator "Candle closing counter", which will become your indispensable assistant in the world of trading. That’s why knowing when the candle will close can help: If you like to trade using candle patterns, you will know when the candle will be closed. This indicator will allow you to check if a known pattern has formed and if there is a possibility of trading. The indicator will help you to prepare for market opening and market closure. You can set a timer to create a pre
The Penta-O is a 6-point retracement harmonacci pattern which usually precedes big market movements. Penta-O patterns can expand and repaint quite a bit. To make things easier this indicator implements a twist: it waits for a donchian breakout in the right direction before signaling the trade. The end result is an otherwise repainting indicator with a very reliable trading signal. The donchian breakout period is entered as an input. [ Installation Guide | Update Guide | Troubleshooting | FAQ | A
TWO PAIRS SQUARE HEDGE METER INDICATOR Try this brilliant 2 pairs square indicator It draws a square wave of the relation between your two inputs symbols when square wave indicates -1 then it is very great opportunity to SELL pair1 and BUY Pair2 when square wave indicates +1 then it is very great opportunity to BUY pair1 and SELL Pair2 the inputs are : 2 pairs of symbols         then index value : i use 20 for M30 charts ( you can try other values : 40/50 for M15 , : 30 for M30 , : 10 for H1 ,
Trade with Gann on your side!! MASTER CIRCLE 360 CIRCLE CHART, originally created by Gann admitted that this is “The Mother of all charts”. It is one of the last studies that this great trader left for us. The numeric tab le is apparently quite simple like all the tables and is based on square numbers, the SQUARE OF 12 and is by evolution, one of the most important square numbers. Here we can find CYCLE, PRICE AND TIME thanks to angles and grades, to show past and future support and resistance.
Cosmic Diviner X Planet
Olena Kondratenko
4 (2)
This unique multi-currency strategy simultaneously determines the strength of trends and market entry points, visualizing this using histograms on the chart. The indicator is optimally adapted for trading on the timeframes М5, М15, М30, Н1. For the convenience of users, the indicator renders the entry point (in the form of an arrow), recommended take profit levels (TP1, TP2 with text labels) and the recommended Stop Loss level. The take profit levels (TP1, TP2) are automatically calculated for
Real-time spread tracking and monitoring software Displays spread values in form of histograms on current timeframe of chart Convenient for analyzing spread changes, as well as for comparing trading conditions of different brokers By placing on desired chart, the spread changes at different trading times are displayed Additionally Fully customizable Works on any instrument Works with any broker
Market Viewer
Matimu Romeo Ngoveni
Market Viewer This utility seeks to assist the trader in identifying potential areas of interest on the price chart. Different components integral to decision making have been automated, allowing the user to engage with perfectly calculated levels. Some components include the weeks initial balance, session Min and Max areas and a round number indicator altogether forming templates providing confidence to the trader. Have a look at the screenshots for a sneak peak into the components. The utility
Os compradores deste produto também adquirem
Trade Assistant MT4
Evgeniy Kravchenko
4.43 (184)
Ajuda a calcular o risco por comércio, a fácil instalação de uma nova encomenda, gestão de encomendas com funções de fecho parcial, trailing stop de 7 tipos e outras funções úteis. Materiais e instruções adicionais Instruções de instalação - Instruções para a aplicação - Versão de teste da aplicação para uma conta de demonstração Função de linha Mostra no gráfico a linha de Abertura, Stop Loss, Take Profit. Com esta função é fácil definir uma nova ordem e ver as suas características adicionais
Bem-vindo ao Trade Manager EA—uma ferramenta de gestão de risco criada para tornar o trading mais intuitivo, preciso e eficiente. Não é apenas uma ferramenta para executar ordens, mas uma solução abrangente para planejamento de operações, gerenciamento de posições e controle de risco. Seja você um iniciante, trader avançado ou scalper que precisa de execução rápida, o Trade Manager EA adapta-se às suas necessidades, oferecendo flexibilidade em todos os mercados, desde forex e índices até commodi
Local Trade Copier EA MT4
Juvenille Emperor Limited
5 (93)
Experimente uma cópia de negociação excepcionalmente rápida com o Local Trade Copier EA MT4 . Com sua fácil configuração de 1 minuto, este copiador de negociações permite que você copie negociações entre vários terminais MetaTrader no mesmo computador Windows ou em um Windows VPS com velocidades de cópia ultra rápidas de menos de 0.5 segundos. Seja você um trader iniciante ou profissional, o Local Trade Copier EA MT4 oferece uma ampla gama de opções para personalizá-lo de acordo com suas necess
TRADEX ai Imagine poder evitar o custo de slippage em cada NEGOCIAÇÃO! É um custo inevitável que é aplicado a quase todas as negociações executadas a preços de mercado. O termo “slippage” descreve a diferença entre o preço da ordem e o preço de execução de uma negociação. Em média, é de 1 pip ou 10 pontos-base, mas às vezes é maior. O TRADEX AI faz exatamente isso: evita o deslizamento em cada ordem que você abre, economizando o custo do deslizamento imediatamente, que às vezes é de 20 pontos-
TradePanel MT4
Alfiya Fazylova
4.89 (87)
O Trade Panel é um assistente comercial multifuncional. A aplicação contém mais de 50 funções de negociação para negociação manual e permite automatizar a maioria das operações de negociação. Atenção, a aplicação não funciona no testador de estratégia. Antes de comprar, pode testar a versão de demonstração numa conta de demonstração. Versão de demonstração aqui . Instruções completas aqui . Comércio. Permite realizar operações de negociação com um clique: Abra as ordens e posições pendentes com
Exp COPYLOT CLIENT for MT4
Vladislav Andruschenko
4.69 (65)
Copiadora comercial para MetaTrader 4. Ele copia negociações, posições e pedidos em forex de qualquer conta. É uma das melhores copiadoras comerciais  MT4 - MT4, MT5 - MT4 para a versão COPYLOT MT4  (ou MT4 - MT5 MT5 - MT5 para a versão COPYLOT MT5 ). Versão MT5 Descrição completa +DEMO +PDF Como comprar Como instalar    Como obter arquivos de log    Como testar e otimizar    Todos os produtos da Expforex Versão da copiadora para o terminal MetaTrader 5 ( МТ5 - МТ5, МТ4 - МТ5 ) -  Copylot Cli
O MT4 para Telegram Signal Provider é uma ferramenta fácil de usar e totalmente personalizável que permite o envio de sinais para o Telegram, transformando sua conta em um provedor de sinais. O formato das mensagens é totalmente personalizável! No entanto, para uso simples, você também pode optar por um modelo predefinido e habilitar ou desabilitar partes específicas da mensagem. [ Demonstração ]   [ Manual ] [ Versão MT5 ] [ Versão Discord ] [ Canal do Telegram ] Configuração Um guia do usuári
EasyInsight MT4
Alain Verleyen
5 (1)
EASY Insight – Seu Assistente de Trading Mais Inteligente E se você pudesse analisar todo o mercado Forex em segundos – e nunca mais perder uma oportunidade de alta probabilidade? EASY Insight oferece aos traders clareza, precisão e dados acionáveis, extraídos diretamente dos seus indicadores existentes como FX Power, FX Volume, FX Dynamic e FX Levels. Seja você um profissional experiente ou um scalper orientado por dados, esta ferramenta entrega a visão completa do mercado em um único arquivo
Exp SafetyLock PRO
Vladislav Andruschenko
4.57 (28)
O SAFETYLOCK é a ferramenta essencial para traders que desejam proteger suas operações contra bruscas reversões de mercado. Ele automaticamente define uma ordem oposta para cada posição já aberta, criando uma camada adicional de segurança para sua estratégia. Quando um trader ou um Expert Advisor (EA) abre uma posição, o SAFETYLOCK gera uma ordem pendente oposta (hedge). Caso a posição entre em território negativo, essa ordem pendente é ativada, criando um bloqueio eficaz e minimizando possíve
EASY Insight AIO – Scanner de Mercado Tudo-em-Um com Dados Completos dos Indicadores E se você pudesse analisar todo o mercado Forex em segundos – sem precisar exibir nada no gráfico? O EASY Insight AIO integra todos os dados analíticos do FX Power, FX Volume, FX Dynamic e FX Levels em um único arquivo CSV estruturado. Sem ferramentas extras. Sem sobreposição no gráfico. Sem distrações. ⸻ Por que usar o EASY Insight AIO? Todos os indicadores incluídos: Não é necessário adquirir licenças adic
Trade Dashboard MT4
Fatemeh Ameri
4.96 (50)
Tired of complex order placement and manual calculations? Trade Dashboard is your solution. With its user-friendly interface, placing orders becomes effortless, by a single click, you can open trades, set stop loss and take profit levels, manage trade lot size, and calculate risk to reward ratios, allowing you to only focus on your strategy. Say goodbye to manual calculations and streamline your trading experience with Trade Dashboard. Download  Demo Version  right now. You can find  Details of
Telegram to MT4 Coppy
Sergey Batudayev
5 (4)
Telegram para MT4:   A solução definitiva para cópia de sinais Otimize suas negociações com   o Telegram para MT4   , o utilitário de última geração desenvolvido para copiar sinais de negociação diretamente de canais e chats do Telegram para sua plataforma MetaTrader 4 — sem a necessidade de DLLs. Esta solução robusta garante a execução perfeita de sinais com precisão incomparável e opções de personalização, economizando seu tempo e aumentando sua eficiência. [Instruções   ] [   DEMO   ] Princip
Comprehensive on chart trade panel with the unique ability to be controllable from mobile as well. Plus has a library of downloadable configuration, e.g. exit rules, extra panel buttons, pending order setup and more. Please see our product video. Works with all symbols not just currency pairs. Features On chart panel plus controllable from free app for Windows, iPhone and Android Built-in script engine with library of downloadable configuration, e.g. add 'Close All Trades in Profit' button, exit
The product will copy all telegram signal to MT4   ( which you are member  ) , also it can work as remote copier.  Easy to set up, copy order instant, can work with almost signal formats, image signal, s upport to translate other language to English Work with all type of channel or group, even channel have "Restrict Saving Content", work with  multi channel, multi MT5 Work as remote copier: with signal have ticket number, it will copy exactly via ticket number. Support to backtest signal. How to
Trade Manager MT4 DaneTrades
Levi Dane Benjamin
4.4 (10)
Trade Manager para ajudá-lo a entrar e sair rapidamente de negociações enquanto calcula automaticamente seu risco. Incluindo recursos para ajudar a evitar negociações excessivas, negociações de vingança e negociações emocionais. As negociações podem ser gerenciadas automaticamente e as métricas de desempenho da conta podem ser visualizadas em um gráfico. Esses recursos tornam este painel ideal para todos os traders manuais e ajudam a aprimorar a plataforma MetaTrader 4. Suporte multilíngue. Vers
EasyTrade MT4
Alain Verleyen
5 (1)
Easy Trade – Gestão de Operações Inteligente, Simples e Poderosa Easy Trade é a solução completa de gestão de operações para usuários do MetaTrader que desejam manter o risco sob controle e uma execução ultra suave. Desenvolvido do zero com base no feedback de traders reais, o Easy Trade facilita a execução, o monitoramento e a gestão de operações em vários símbolos – sem complicar o seu fluxo de trabalho. Seja você um scalper manual ou esteja gerenciando uma pequena carteira de setups, o Easy
Trend Line Optimizer
Evgenii Aksenov
4.06 (18)
Este é um otimizador automático de parâmetros para o indicador Trend Line PRO Com facilidade e rapidez, você selecionará os parâmetros ideais para o seu indicador favorito Trend Line PRO.  A otimização leva apenas alguns segundos. O otimizador permite que você encontre os melhores parâmetros para cada par e período: Amplitude, TP1-TP3, StopLoss, bem como os valores Para Time Filter e HTF Filter na seção selecionada do histórico (Days)  Para otimizar diferentes períodos de tempo, você precisa d
Ultimate Trailing Stop EA
BLAKE STEVEN RODGER
4.33 (15)
This EA Utility allows you to manage (with advanced filtering) unlimited open orders (manual or EA) with 16 trailing stop methods: fixed, percent, ATR Exit, Chandelier Exit, Moving Average, Candle High Low Exit, Bollinger Bands, Parabolic, Envelope, Fractal, Ichimoku Kijun-Sen, Alligator, Exit After X Minutes or Bars, RSI and Stochastic. The trailing stop can be either real or virtual, and you can exit fully or with a partial close percent on touch or bar close.  Moreover, you can add (overrid
Seconds Chart — uma ferramenta exclusiva para criar gráficos de segundos no MetaTrader 4 . Com o Seconds Chart , você pode criar gráficos com períodos definidos em segundos, proporcionando flexibilidade e precisão ideais para análise, indisponíveis em gráficos padrão de minutos ou horas. Por exemplo, o período S15 indica um gráfico com velas de 15 segundos. Você pode usar quaisquer indicadores, Expert Advisors e scripts com a mesma facilidade dos gráficos padrão. Diferente das ferramentas padrão
Grid Manual MT4
Alfiya Fazylova
4.71 (17)
"Grid Manual" é um painel comercial para trabalhar com uma grade de ordens. O utilitário é universal, possui configurações flexíveis e uma interface intuitiva. Ele trabalha com uma grade de pedidos não apenas na direção da média das perdas, mas também na direção do aumento dos lucros. O trader não precisa criar e manter uma grade de pedidos, tudo será feito pelo ""Grid Manual". Basta abrir um pedido e o "Grid manual" criará automaticamente uma grade de pedidos para ele e trabalhará com ele até q
VirtualTradePad mt4 Extra
Vladislav Andruschenko
4.86 (58)
Painel de negociação para negociação em 1 clique.  Trabalhando com posições e pedidos!  Negociar a partir do gráfico ou do teclado. Usando nosso painel de negociação, você pode negociar com um clique no gráfico e realizar operações de negociação 30 vezes mais rápido do que o controle MetaTrader padrão. Cálculos automáticos de parâmetros e funções que tornam a vida mais fácil para um trader e ajudam-no a conduzir suas atividades de trading com muito mais rapidez e conveniência. Dicas gráficas e i
Custom Alerts: Monitore vários mercados e nunca perca uma oportunidade importante Visão Geral Custom Alerts é uma solução dinâmica para traders que desejam uma forma consolidada de acompanhar possíveis setups em vários instrumentos. Ao integrar dados de nossas ferramentas principais — como FX Power, FX Volume e IX Power — Custom Alerts notifica automaticamente sobre mudanças cruciais do mercado, sem precisar gerenciar diversos gráficos ou correr o risco de perder oportunidades valiosas. Se voc
The top-selling EAs on the market cost a lot and one day they are suddenly gone. This is because one strategy will not work in the forex market all the time. Our product is unique from all others in the MQL Marketplace because our EA comes with 34+ built-in indicators that allow adding more strategies every time.  You build your strategy and keep updating it. If one strategy does not work, simply build another all using only one EA. This is All-In-One EA in this market place. You can use as trad
News Filter EA: Advanced Algo Trading Assistant News Filter EA is an advanced algo trading assistant designed to enhance your trading experience. By using the   News Filter EA , you can integrate a Forex economic news filter into your existing expert advisor, even if you do not have access to its source code. In addition to the news filter, you can also specify   trading days   and   hours   for your expert. The News Filter EA also includes   risk management   and   equity protection   features
Trade copier MT4
Alfiya Fazylova
4.53 (30)
Trade Copier é um utilitário profissional projetado para copiar e sincronizar negociações entre contas de negociação. A cópia ocorre da conta / terminal do fornecedor para a conta / terminal do destinatário, instalada no mesmo computador ou vps. Antes de comprar, você pode testar a versão demo em uma conta demo. Versão de demonstração aqui . Instruções completas aqui . Principais funcionalidades e benefícios: Suporta a cópia de MT4> MT4, MT4> MT5, MT5> MT4, incluindo contas "MT5 netting". Os mod
O MT4 to Discord Signal Provider é uma ferramenta fácil de usar e totalmente personalizável, projetada para enviar sinais de negociação diretamente para o Discord. Esta ferramenta transforma sua conta de negociação em um provedor de sinais eficiente. Personalize os formatos de mensagens para se adequar ao seu estilo! Para facilitar o uso, selecione entre modelos pré-desenhados e escolha quais elementos da mensagem incluir ou excluir. [ Demo ] [ Manual ] [ Versão MT5 ] [ Versão Telegram ] Config
Layer Master Toolbox
Peter Andrew Thomas
5 (5)
Layer Master: Professional Grid Trading Tool for MT4 Transform your grid trading with Layer Master - the most intuitive and powerful order management toolkit designed specifically for professional traders. MT5   Version:  https://www.mql5.com/en/market/product/129705 FREE - 7 Day Trial Version available. Please   contact  me to get your Free trial! Master Grid Trading with Precision Layer Master revolutionizes how you place and manage grid trades. With our visual interface, you can: Deploy hun
The Dynamic Fibonacci Grid Dashboard ( DFG-360 ) is a multi functional trading app designed for work primarily in the Forex market. The app combines several modules and tools into one complete trading system. The unique interface of the app is optimized for active day trading, scalping, news trading, short term trend following as well as counter trend and grid trading. Main features Advanced Multi Time Frame and Multi Market analysis. Quick and efficient position management. Semi-Automated trad
SDX Dashboard
Tsvetan Tsvetanov
SDX is our latest and most advanced dashboard for manual trading. The app is based on our proven grid platform and offers unique trading opportunities for both experienced and new traders. This unique combination of innovative tools is designed to simplify the trading process and to give you real advantage. The system is ideal for short term trend following, counter-trend trading and scalping on the Forex market. Main Features Ability to work simultaneously with 10 pairs from one screen. Abilit
My Trade History PRO
Bernhard Schweigert
5 (3)
ACTUALMENTE 20% DE DESCONTO!! A melhor solução para qualquer novato ou comerciante especializado! Rever os seus negócios é o primeiro passo para um comerciante de sucesso. Os comerciantes bem sucedidos têm o hábito de rever regularmente o seu desempenho comercial. Esta ferramenta vai ajudá-lo a fazer exactamente isso. O processo de revisão será mais eficaz com esta ferramenta para acompanhar as suas transacções. Analise as suas transacções manuais ou as transacções da sua EA. Utilize as 3
Mais do autor
Renko bars builder
Navdeep Singh
4.2 (5)
The indicator builds a Renko chart in the sub window for the current symbol. The bars are formed from live data and the desired bar size can be set in the inputs tab. Most importantly, because the Renko chart only uses price to construct bars and ignores time, the indicator can be applied to any time frame and same results can be achieved. Recommended usage As Renko charts are famous for eliminating noise so traders can use this tool to see clear picture of the trend to help their analysis, entr
FREE
ZigZag New
Navdeep Singh
4.33 (3)
Informative & optimized Zigzag, Accumulated volume, Price change   A rewrite of the traditional zigzag tool with new additions. Features:- Optimized code Displays accumulated volume between peaks Displays price change between peaks Usage:- Identify trend swings Identify high volume swings Compare price changes between swings Drawing Fibonacci tool on strong price change or high volume swings
FREE
ADR Bands
Navdeep Singh
4.5 (2)
Average daily range, Projection levels, Multi time-frame ADR bands shows levels based on the selected time-frame. Levels can be used as projections for potential targets, breakouts or reversals depending on the context in which the tool is used. Features:- Multi time-frame(default = daily) Two coloring modes(trend based or zone based) Color transparency  
FREE
The indicator is designed to detect range market or consolidation areas on the chart. It does this by using the market volatility and price momentum. The indicator signals the start and stop of the range with icons on the chart and various  type of alerts options provided in the input settings. Usage: The indicator can be used to check the state of the market i.e. trending or ranging to make appropriate decision and use strategies designed for specific market state. Please see the attached video
The indicator helps the trader in identifying potential liquidity levels. The algorithm used in this indicator checks the behavior of the asset taking into account the price levels, momentum and volume analysis. Features:- Parameters for signal optimization and alerts. Usage:- The levels formed by the indicator can be helpful to traders in identifying potential entries, breakouts or reversals. it can assist traders of technical trading background or even pure price action trading. Examples of
IBB Candles is a tool that is based on the concept of Inverse Bollinger Bands. It compares price relative to state of the bands and plots candles with different colors defining the current state of the market i.e range | trend | strong trend. As the name suggests IBB(Inverse Bollinger Bands) is a technique which is completely different from the traditional Bollinger Bands and proves to be much more effective in analyzing market. This personal implementation makes this tool a more reliable option
CMA dashboard is designed to help traders in identifying trend on multiple timeframes and symbols. It displays a clear state of the overall trend at one place without the need to navigate between different charts and timeframes. This saves time and makes decision making process fast so that potential opportunities are not missed. It is based on Corrected moving averages available here Features Parameters for signal optimization Inputs for multiple timeframes and symbols  Usage Higher timeframe
RSI Scanner, Multiple Symbols and Timeframes, Graphical User Interface An indicator that scans multiple symbols added from the market watch and timeframes and displays result in a graphical panel. Features: Multi symbol Multi timeframe Alerts and Notifications Live Monitoring Sorting modes One click to change symbol and timeframe Inputs for RSI and scanner settings
FREE
Algorithmic Signals indicator   is not an indicator but a strategy that generates entry/exit signals. The entry arrows are formed after multiple conditions are met. The indicator is using an   Adaptive Algorithm   which automatically adjust to the symbol and time frame (see the screenshots below) . Signals can be used for scalping or even trend trading. Main features:- Non repainting signals Entry signals Exit signals Alert for price reaching 1 x ATR(14) (could be utilized for initial take prof
Stochastic force is an advanced version of the stochastic oscillator. Instead of using the regular price a more efficient price data is provided as an input for the oscillator which takes into account the price efficiency, volume and market noise. Also price is pre-filtered with the selected average type and then post-filtered by a hull moving average which provides a smooth transition of the oscillator. It eliminates maximum false signals and has the potential to become an integral part of any
This is the new version of the Algorithmic signals featuring a new algorithm. It is a blend of technical and candlestick analysis. Candlestick analysis are often ignored while creating technical strategies but this version has a feature to include that and make confirmations more strong.  Usage:- Traders can use the signals for buying and selling assets or even blend their own favorite indicators with it.
TDI Signals generates buy and sell arrows based on a TDI(Traders Dynamic Index) algorithm. It looks for price breakouts, continuations and reversals. By default it runs in the trend mode but user is provided with the option to change that to reversal mode. Trader can use the mode which compliments his/her trading style.  Usage:-   TDI Signals can be used as a stand alone indicator with context or even be added to strategies to make confirmations more strong. Volatility based stop loss, take pro
RSI Levels generates buy and sell arrows based on RSI analysis. Signals are based on extreme levels breakouts and can be further filtered by a volatility metric. Trader can use the mode which compliments his/her trading style.  Features:- Parameters for signal optimization and alerts. Usage:-   RSI Levels can be used as a stand alone indicator with context or even be added to strategies to make confirmations more strong. Volatility based stop loss, take profit & position sizing can be very helpf
Step force index is a modified version of the famous force index indicator. As the name suggests it incorporates a step feature to filter the force index values thus eliminating small fluctuations in the indicator. It also utilizes the smooth algorithm library thereby providing multiple smoothing options for the index values. This personal implementation makes it a more easy to use and a reliable tool. Main features A wide range of parameters for signals optimization Alerts, emails and push noti
Market structures, Market balance, Range breakouts This tools helps to identify areas of market ranges, structures and plots colored boxes on breakout of those areas. User is given the option to receive alerts and notifications on the formation of the blocks. The tool has the ability to become an essential part of a technical trading system or even pure price action trading. Usage:- An essential tool for price action or technical traders.  More information in the blog
Horizontal volume bars, Cluster analysis, Volume profile Volume in Range gets information about the accumulated volume in a specified vertical range and period in bars. The received data is then plotted on the chart as rectangular boxes with the volume quantity inside. Usage:- The tool acts as a support resistance levels but most importantly it should be used to check in which direction the price breaks out of the significant levels formed by this indicator and then actions to be taken on correc
Price breakouts, Levels, Multi-time frame Inside bars checks for price failure to break from the previous high/low and on breakout draws a breakout box on the chart. The choice of breakout price is given to the user i.e. close or high/low of bar. Alerts can be received on breakouts. Features:- Multi-time frame Alerts, notifications & emails Usage:- Breakout signals Check how price action is evolving with the help of boxes Get multi-time frame bias
Market Fractal Analysis, Fractal Swing, Market Flow Fractal Cycles looks for Similar Patterns in the Market that repeat themselves because of the Market Fractal Nature. These patterns are displayed with help of Graphical Objects and Alerts can be received on their arrival. Read the Blog for full information. Features:- Auto Detection of Patterns Customization for Color and Line Styles Alerts, Emails & Push Notifications 
50+ Candlestick Patterns, Simulated Trading Results, Top Five Performers Candle Analysis extends Candlesticks Pattern Analysis by not only identifying Patterns but also recording the Past Performance of the Patterns. What it Does:- Identifies and plots results on chart Displays Top Patterns for both Bullish and Bearish type.  Log can be printed in experts tab to see Simulated Trading results Displays All or Selected Patterns Alerts on Pattern formation More detailed information in Blog
Stochastic force is an advanced version of the stochastic oscillator. Instead of using the regular price a more efficient price data is provided as an input for the oscillator which takes into account the price efficiency, volume and market noise. Also price is pre-filtered with the selected average type and then post-filtered by a hull moving average which provides a smooth transition of the oscillator. It eliminates maximum false signals and has the potential to become an integral part of any
The indicator helps the trader in identifying potential liquidity levels. The algorithm used in this indicator checks the behavior of the asset taking into account the price levels, momentum and volume analysis. Features:- Parameters for signal optimization and alerts. Usage:- The levels formed by the indicator can be helpful to traders in identifying potential entries, breakouts or reversals. it can assist traders of technical trading background or even pure price action trading.
IBB Candles is a tool that is based on the concept of Inverse Bollinger Bands. It compares price relative to state of the bands and plots candles with different colors defining the current state of the market i.e range | trend | strong trend. As the name suggests IBB(Inverse Bollinger Bands) is a technique which is completely different from the traditional Bollinger Bands and proves to be much more effective in analyzing market. This personal implementation makes this tool a more reliable optio
Horizontal volume bars, Cluster analysis, Volume profile Volume in Range gets information about the accumulated volume in a specified vertical range and period in bars. The received data is then plotted on the chart as rectangular boxes with the volume quantity inside. Usage:- The tool acts as a support resistance levels but most importantly it should be used to check in which direction the price breaks out of the significant levels formed by this indicator and then actions to be taken on correc
Market structures, Market balance, Range breakouts This tools helps to identify areas of market ranges, structures and plots colored boxes on breakout of those areas. User is given the option to receive alerts and notifications on the formation of the blocks. The tool has the ability to become an essential part of a technical trading system or even pure price action trading. Usage:- An essential tool for price action or technical traders.  More information in the blog
Market Fractal Analysis, Fractal Swing, Market Flow Fractal Cycles looks for Similar Patterns in the Market that repeat themselves because of the Market Fractal Nature. These patterns are displayed with help of Graphical Objects and Alerts can be received on their arrival. Read the   Blog   for full information. Features:- Auto Detection of Patterns Customization for Color and Line Styles Alerts, Emails & Push Notifications
50+ Candlestick Patterns, Simulated Trading Results, Top Five Performers Candle Analysis extends Candlesticks Pattern Analysis by not only identifying Patterns but also recording the Past Performance of the Patterns. What it Does:- Identifies and plots results on chart Displays Top Patterns for both Bullish and Bearish type.  Log can be printed in experts tab to see Simulated Trading results Displays All or Selected Patterns Alerts on Pattern formation More detailed information in   Blog
Filtro:
Sem comentários
Responder ao comentário