Gann Signal Indicator MT5
- Индикаторы
- Eda Kaya
- Версия: 1.3
Gann Signal Indicator for MetaTrader 4 Download
The Gann Signal Indicator is a robust tool for technical analysis, inspired by the Gann model and incorporating the Williams Percent Range. It helps traders pinpoint market trend reversals and provides precise entry points for trading opportunities.
«Indicator Installation & User Guide»
MT5 Indicator Installation |Gann Signal Indicator MT4 | ALL Products By TradingFinderLab | Best MT5 Indicator: Refined Order Block Indicator for MT5 | Best MT5 Utility: Trade Assistant Expert TF MT5 | TP & SL Tool: Risk Reward Ratio Calculator RRR MT5 | Money Management: Easy Trade Manager MT5 | Trade Copier: Free Fast Local Trade Copier MT5
Gann Signal Specifications Table
The following table summarizes the features and specifications of this indicator:
| Category | Volatile - Predictive Signal - Trading Tool |
| Platform | MetaTrader 5 |
| Skill Level | Intermediate |
| Indicator Type | Continuation - Reversal |
| Timeframe | Multi timeframe |
| Trading Style | Intraday Trading |
| Market | All Markets |
Indicator Overview
This indicator operates on a scale of 0 to -100, identifying both bullish and bearish trends. When the -30 line is surpassed, it indicates the start of an uptrend. Conversely, breaking below the -70 line signals the beginning of a downtrend.
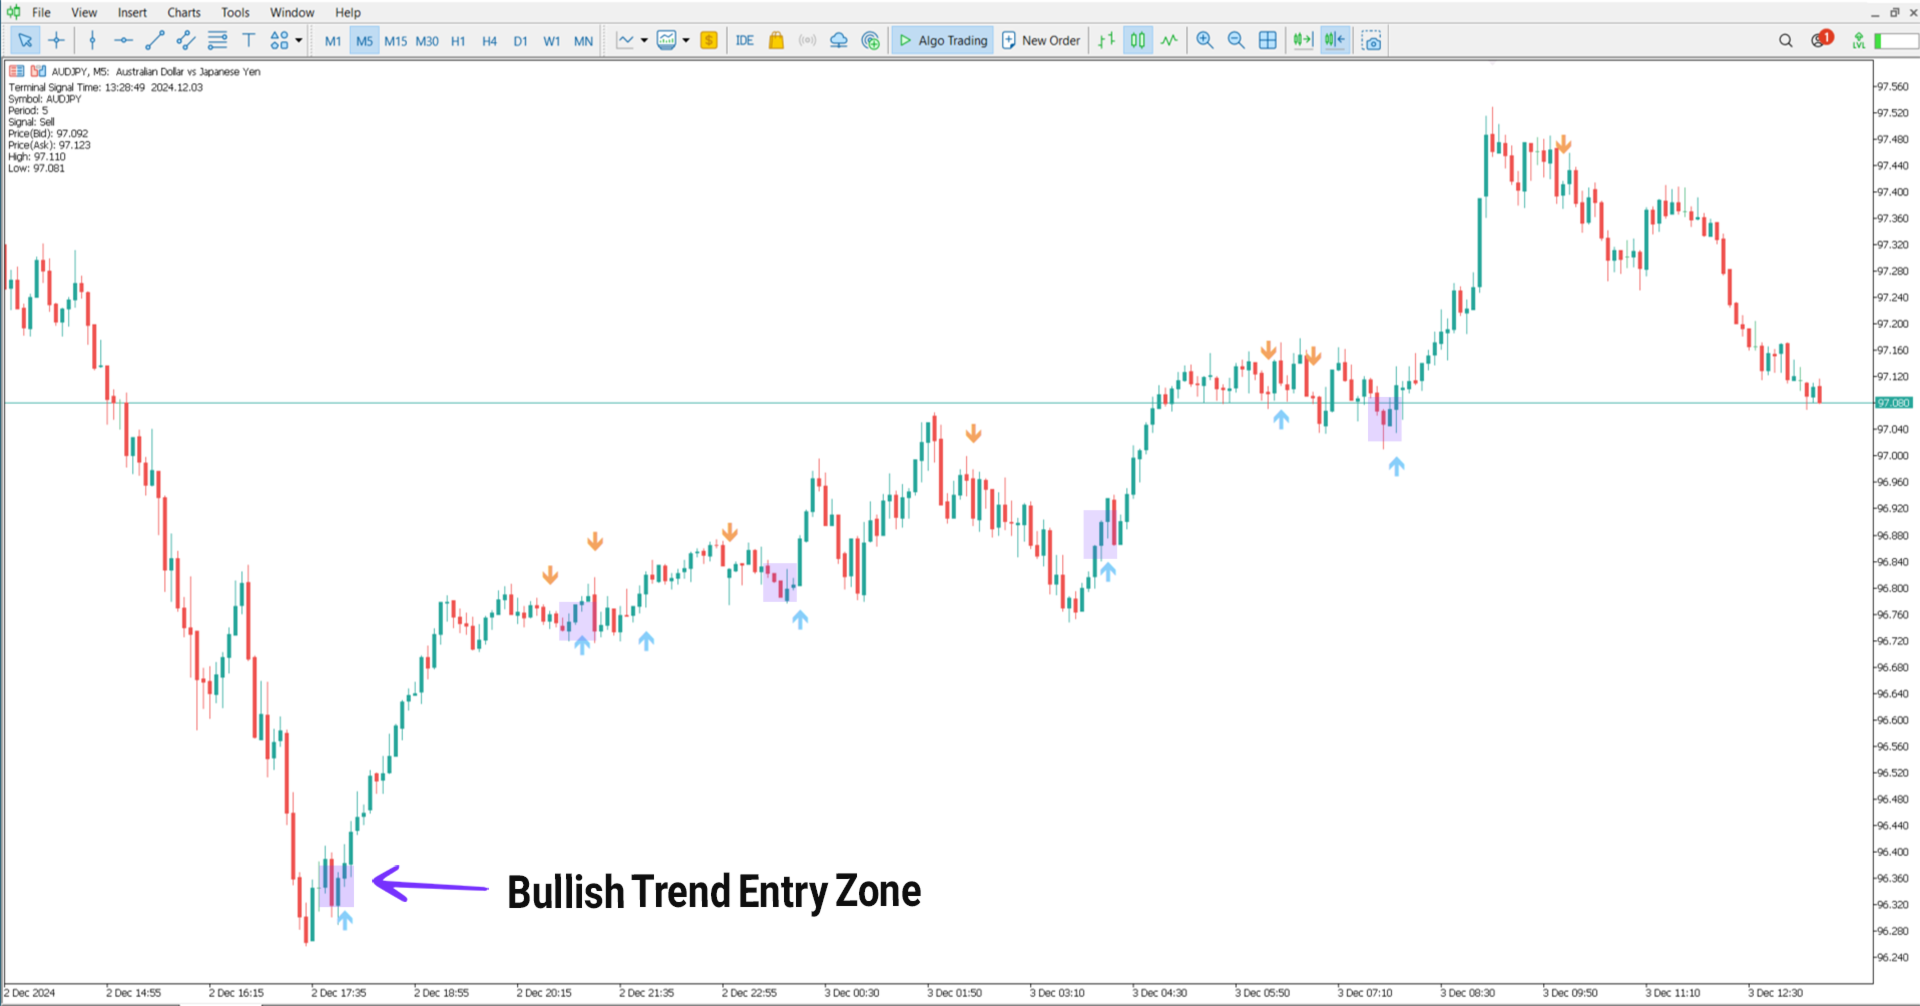
Uptrend Conditions
The chart for the AUD/JPY currency pair on a 5-minute timeframe demonstrates an uptrend. Blue arrows highlight trend reversals and signal suitable buy opportunities.
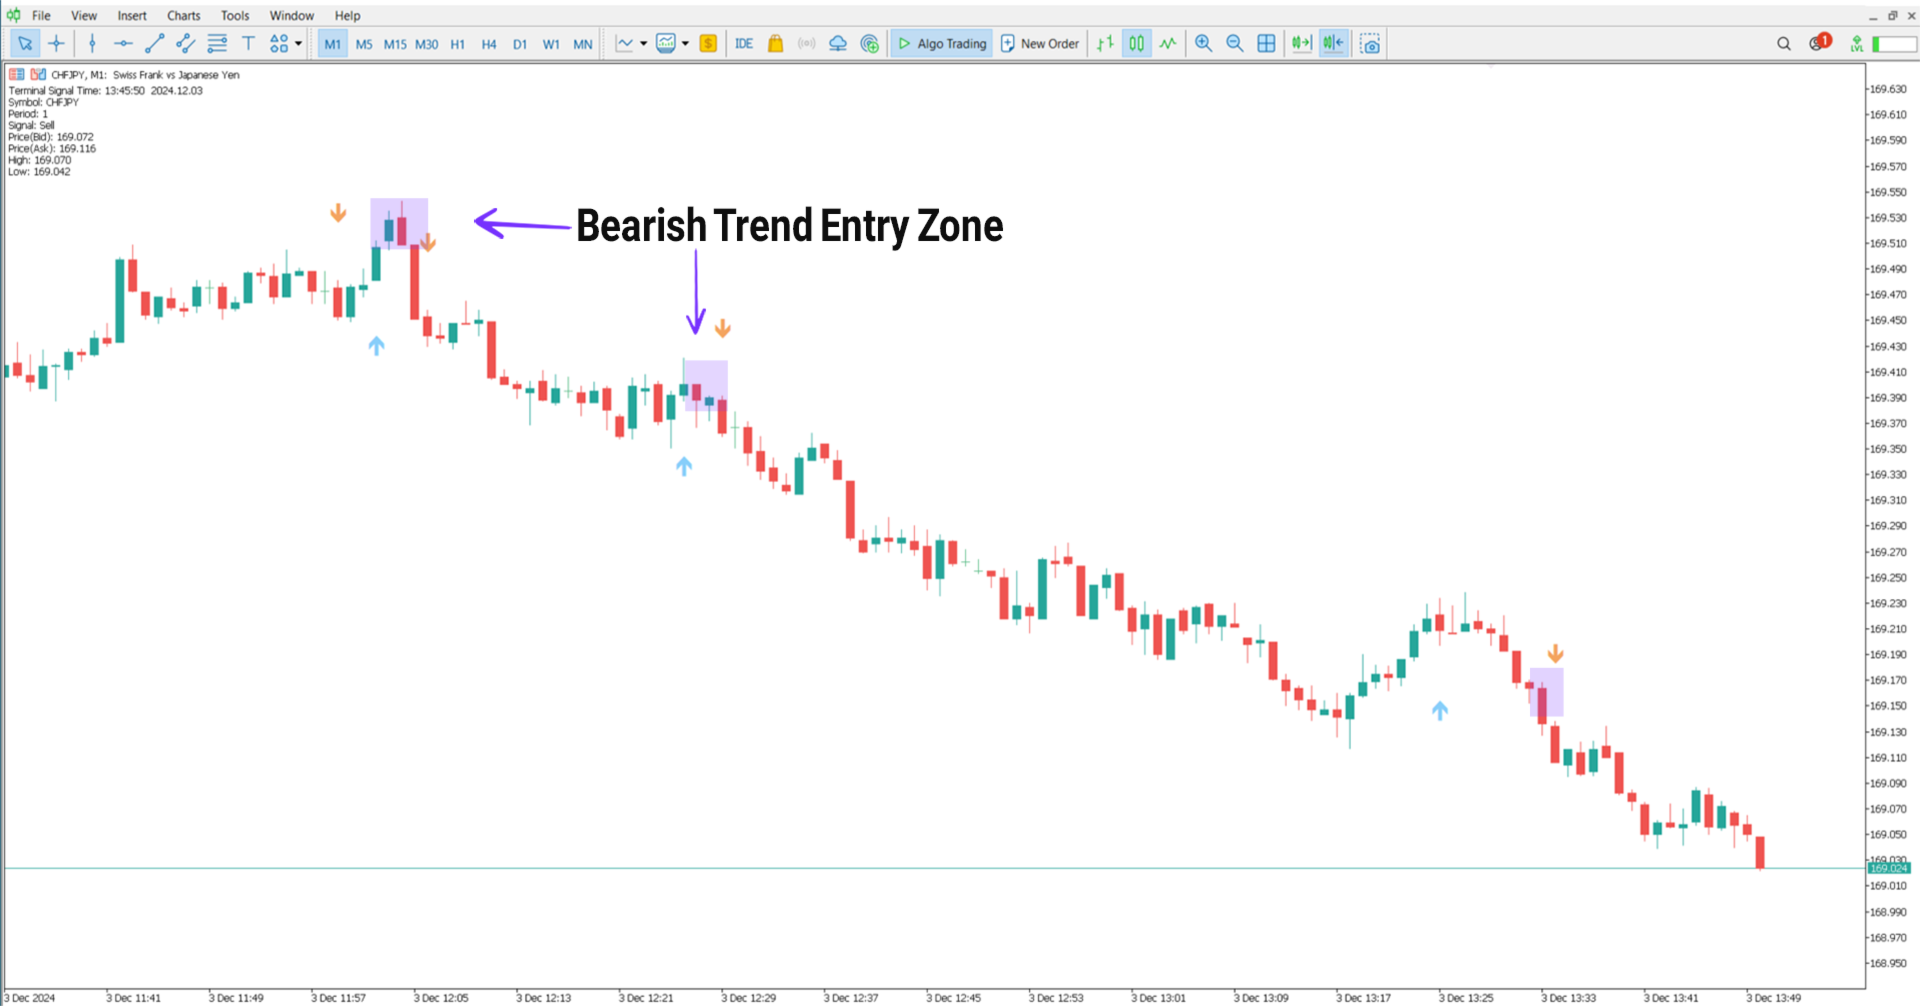
Downtrend Conditions
The CHF/JPY chart on a 1-minute timeframe illustrates a downtrend. Red arrows mark trend shifts from bullish to bearish, providing sell signals during bearish conditions.
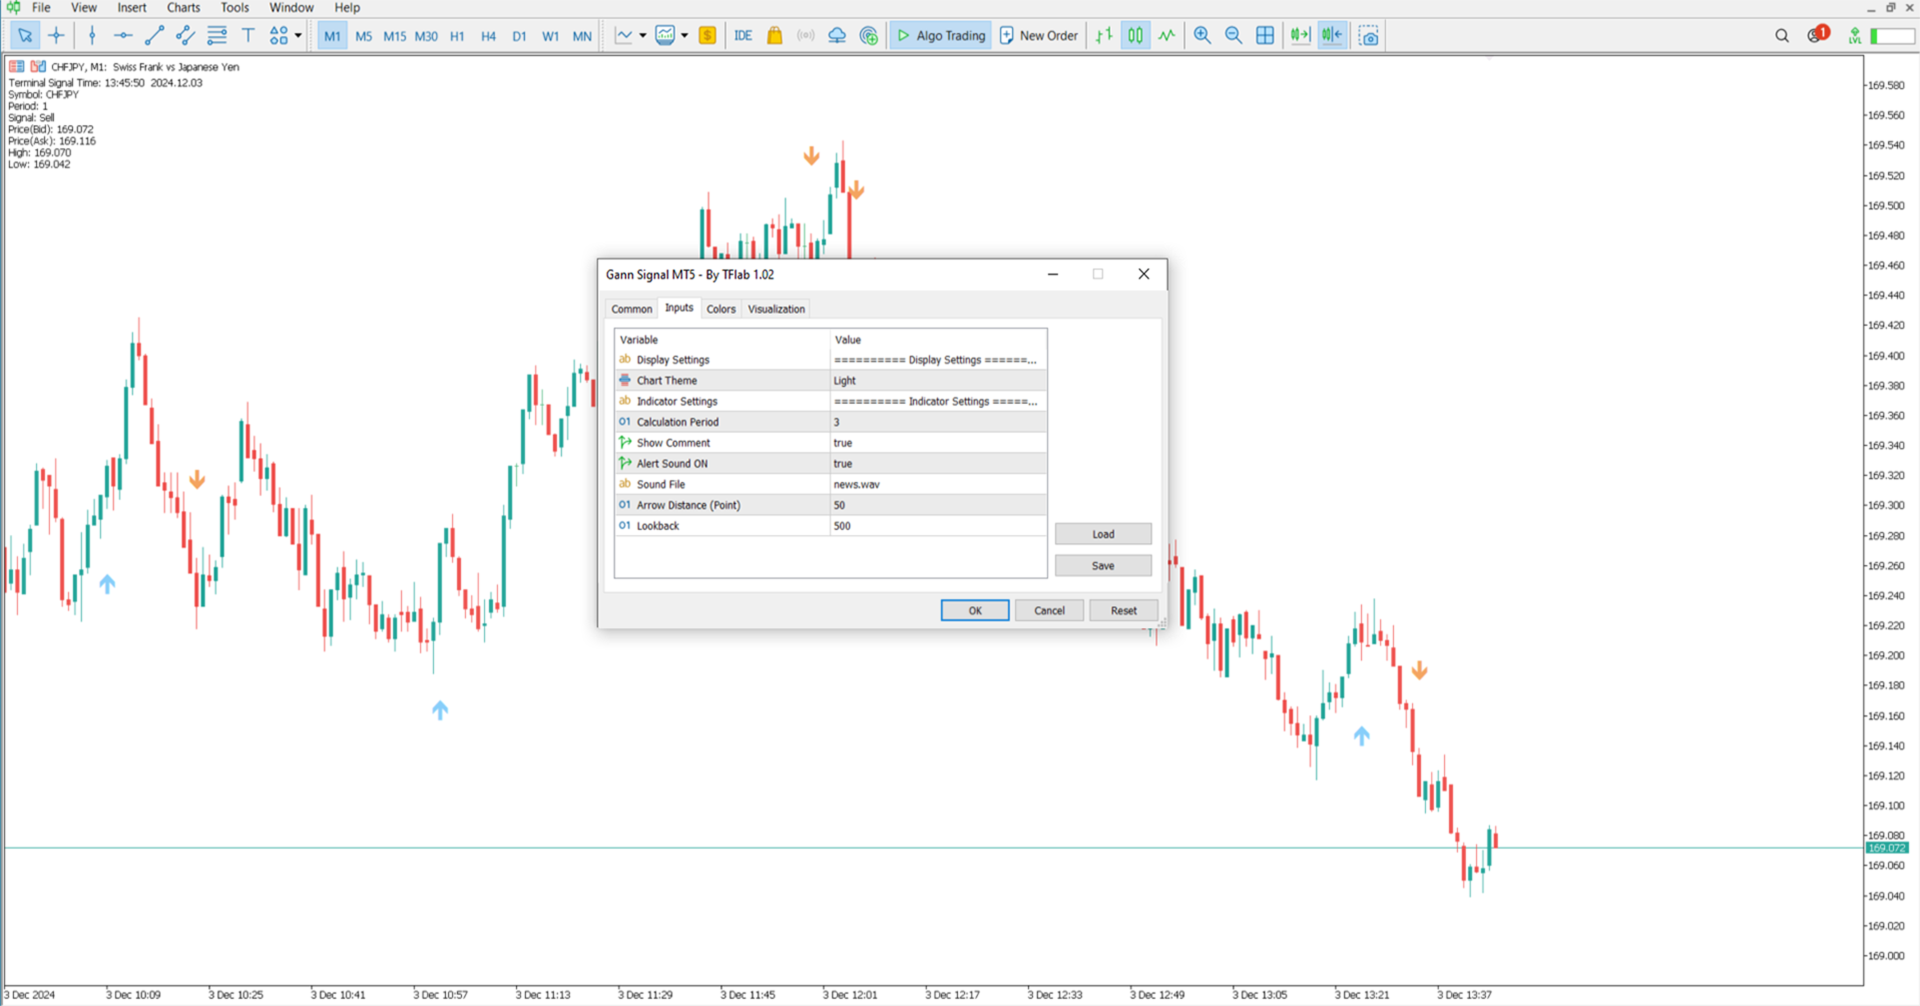
Indicator Settings
Image below displays the settings of the Gann Signal Indicator in the MetaTrader 5 platform:
Display-settings
- Chart theme: Graph theme.
Indicator settings
- Calculation Period: Time period to 3;
- Show Comment: Notes;
- alert Sound ON: Alert sound;
- Sound file: Sound file used;
- Arrow Distance: Arrow spacing to 50;
- Lookback: Historical view range to 500.
Conclusion
The Gann Signal Indicator is an essential tool for identifying bullish and bearish trends through its blue and orange arrows.Blue Arrows, Signal the start of an uptrend, suggesting buy opportunities.Orange Arrows, Mark the beginning of a downtrend, highlighting sell opportunities.