Breakout Zones Indicator MT5
- Индикаторы
- Eda Kaya
- Версия: 1.3
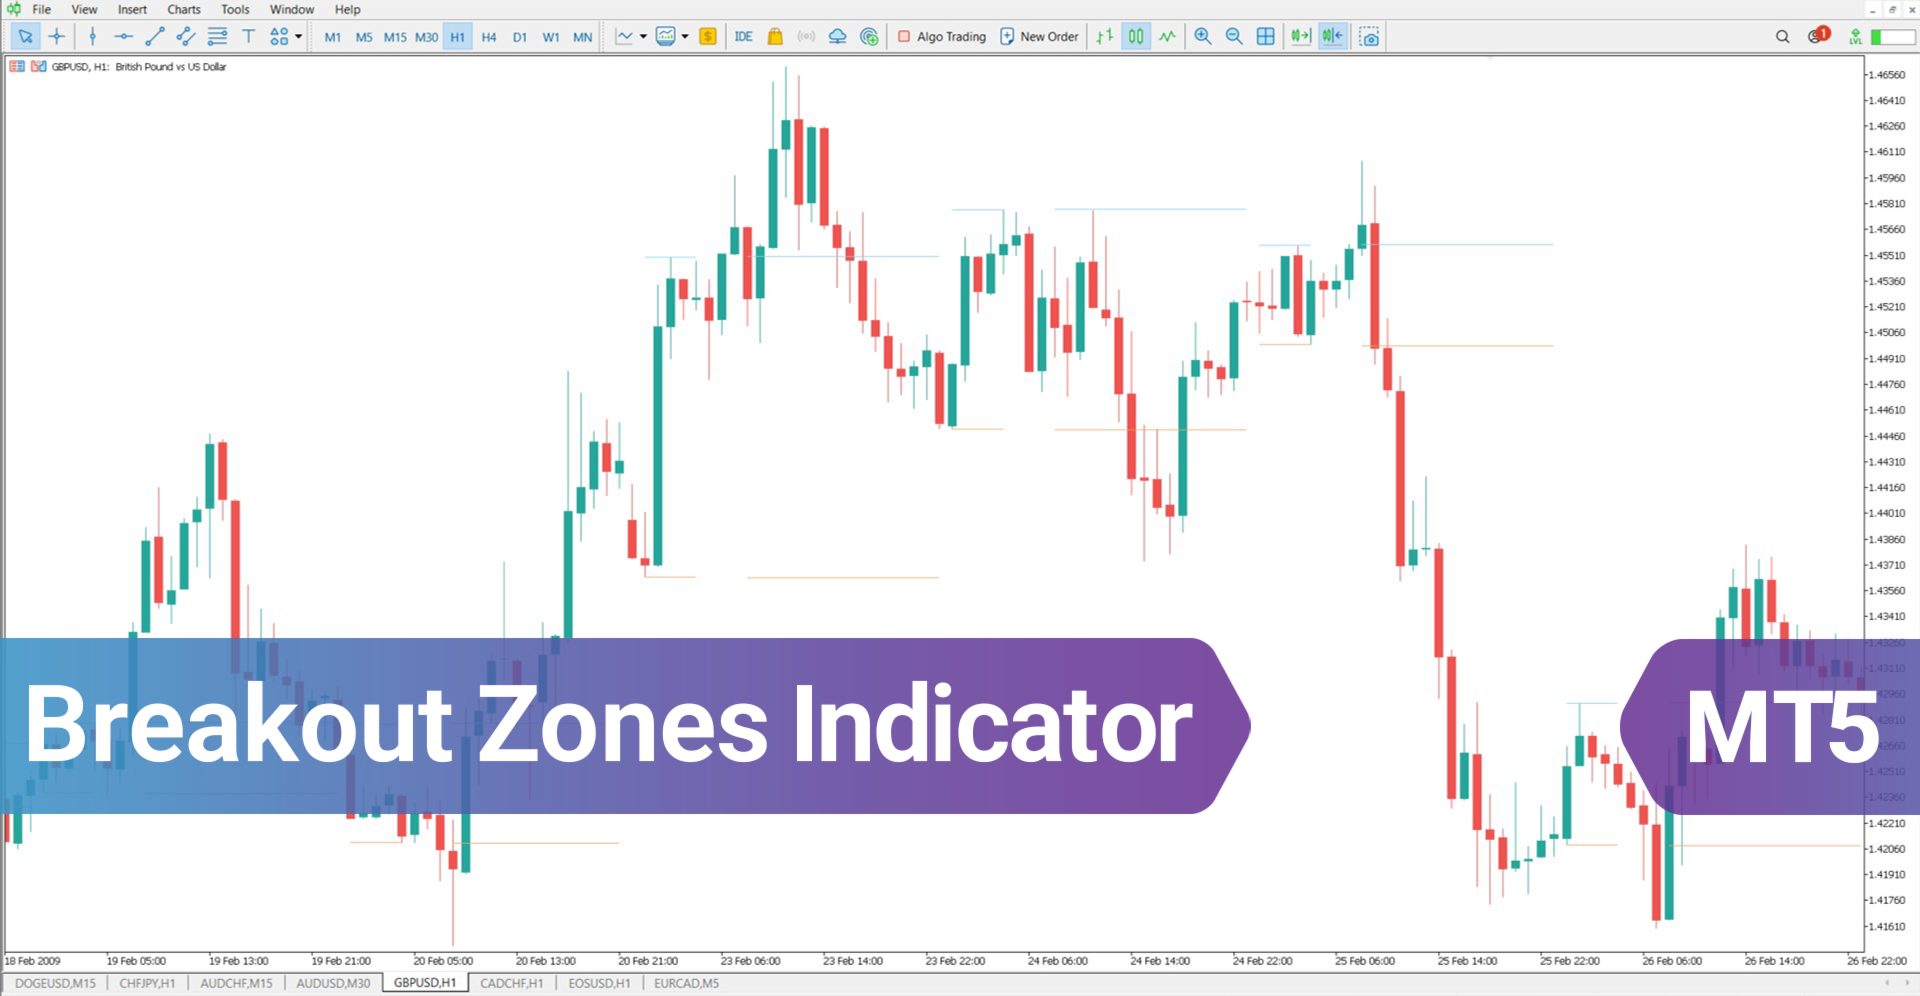
Breakout Zones indicator in MetaTrader 5
The Breakout Zones Indicator in MetaTrader 5 automatically draws support levels and resistance levels based on price movements on the chart.
When the price crosses the resistance line, it indicates the start of an uptrend, and when it drops below the support line, it signals the formation of a downtrend. This indicator effectively helps identify bullish and bearish market trends.
«Indicator Installation & User Guide»
MT5 Indicator Installation | Breakout Zones Indicator MT4 | ALL Products By TradingFinderLab | Best MT5 Indicator: Refined Order Block Indicator for MT5 | Best MT5 Utility: Trade Assistant Expert TF MT5 | TP & SL Tool: Risk Reward Ratio Calculator RRR MT5 | Money Management: Easy Trade Manager MT5 | Trade Copier: Free Fast Local Trade Copier MT5
Indicator Specifications
The table below provides a summary of this indicator's details:
| Category | Support and Resistance - Levels - Trading Tools |
| Platform | MetaTrader 5 |
| Skill Level | Intermediate |
| Indicator Type | Breakout - Range - Continuation |
| Timeframe | Multi-timeframe |
| Trading Style | Intraday Trading |
| Market | All Markets |
Breakout Zones Indicator at a Glance
Blue lines represent resistance in this indicator, while red lines indicate support. In the event of a breakout and with proper confirmation, such as price consolidation above the resistance line or below the support line, traders can enter positions to capitalize on the trading opportunities.
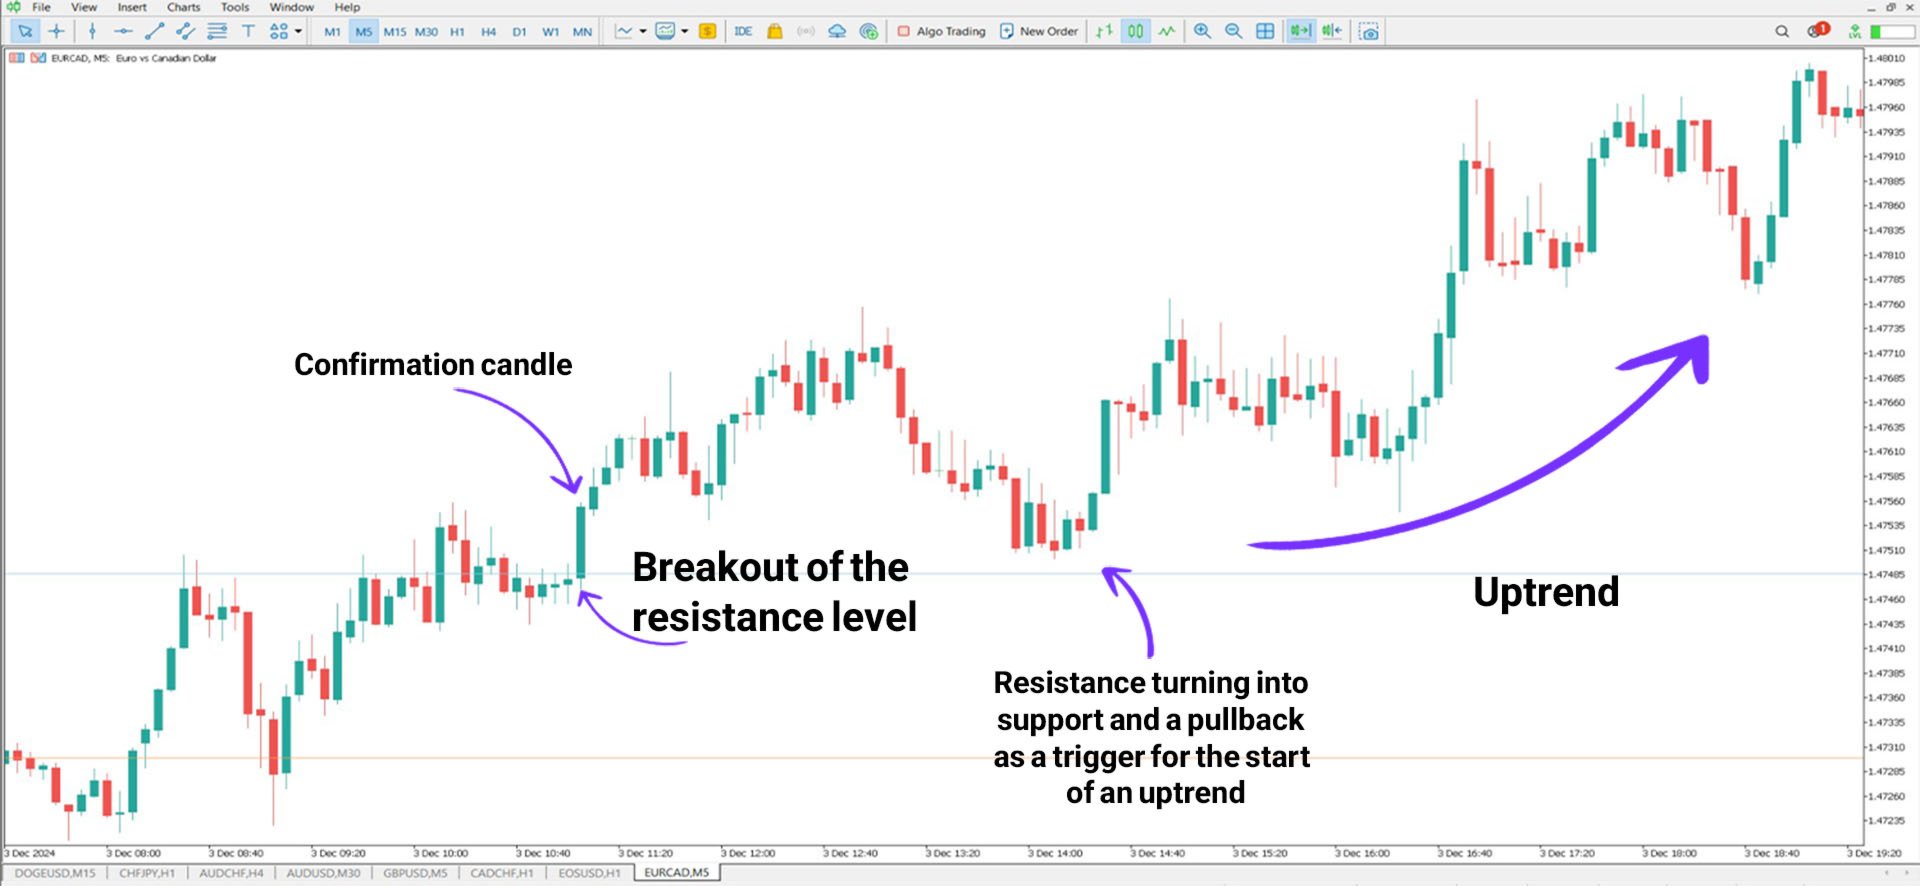
Indicator in an Uptrend
In the EUR/CAD price chart with a 5-minute timeframe, the price initially declines upon hitting the Resistance Zone. After a liquidity grab, it reattempts to breach the resistance line and successfully breaks it.
Following this breakout, the resistance zone turns into a support zone, and the price uptrends. With the necessary confirmations, traders can open buy positions.
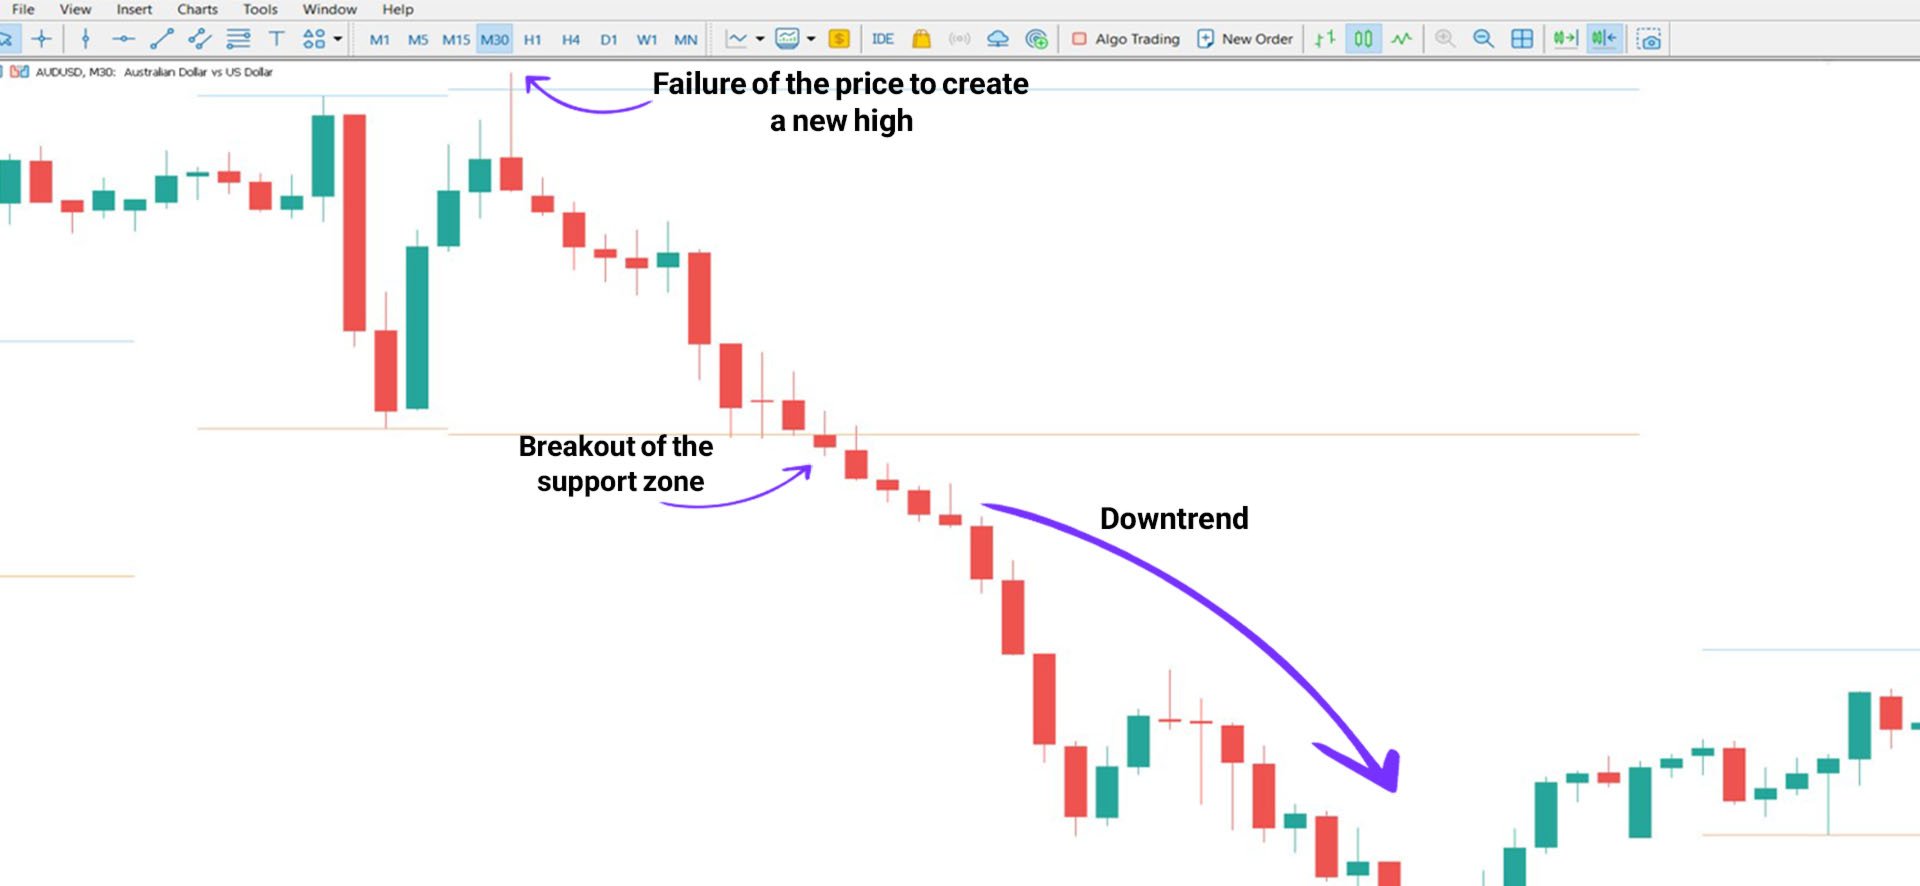
Indicator in a Downtrend
In the 30-minute chart of the AUD/USD pair, after reaching the resistance zone, the price fails to create a higher high and starts to decline sharply.
Upon breaking the Support Zone, traders can enter sell positions by confirming with candlestick patterns according to their trading strategy.
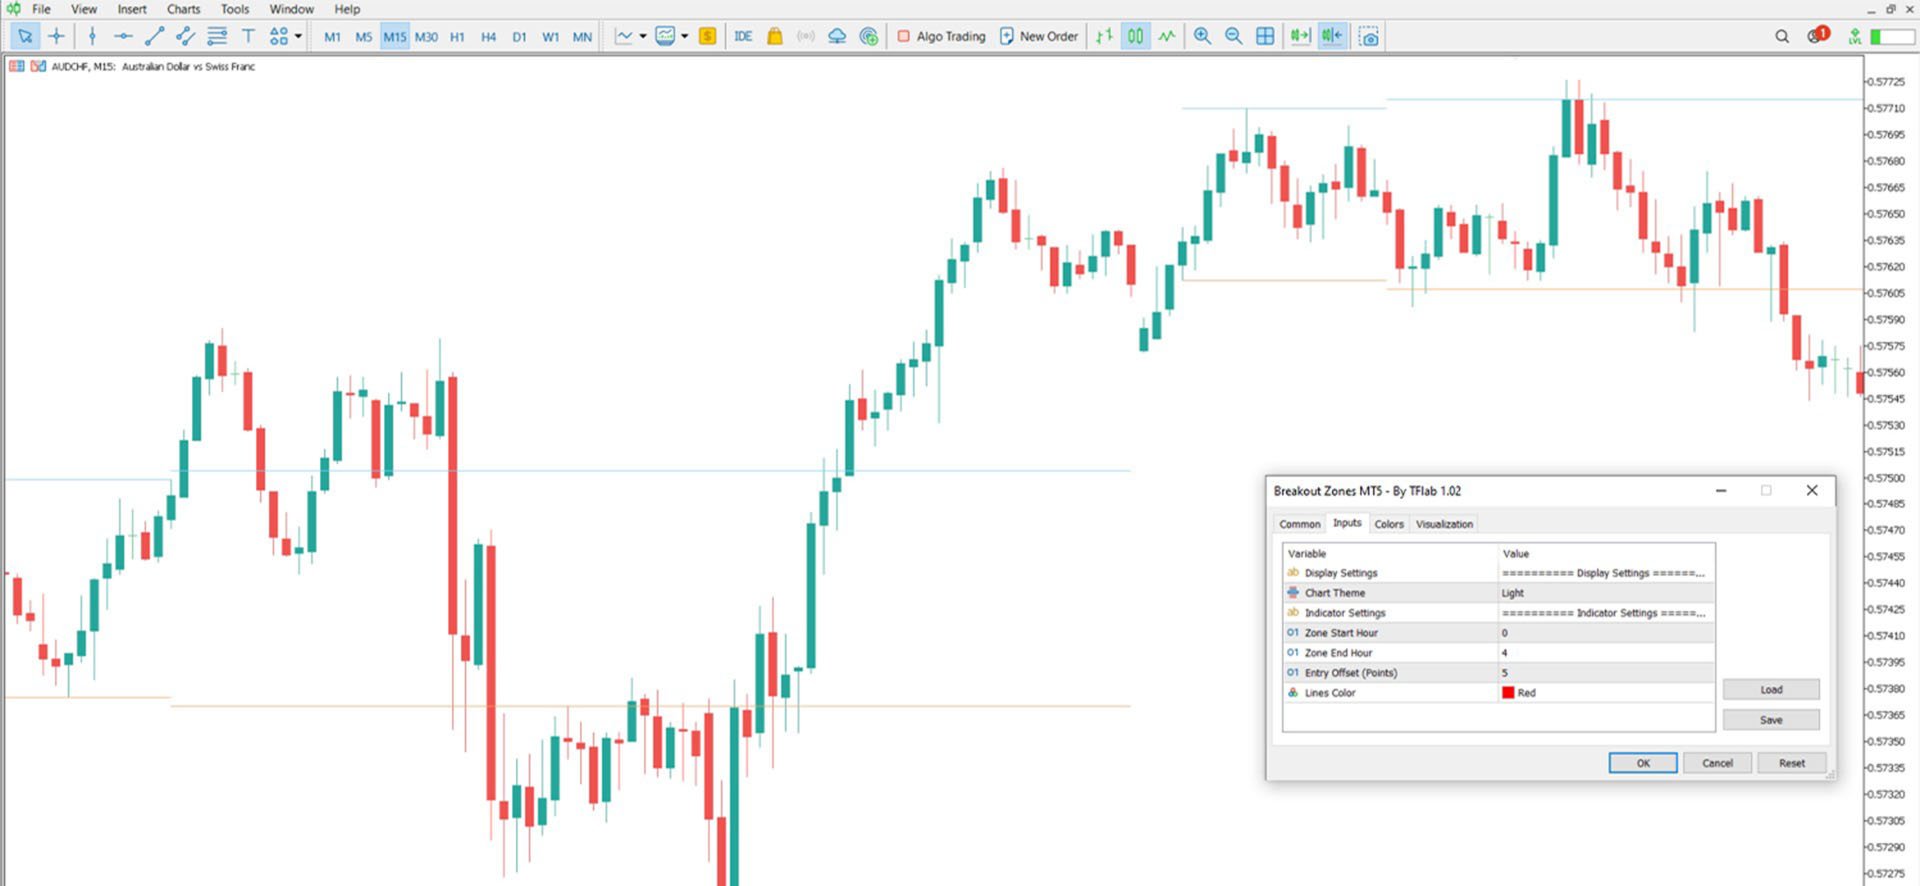
Breakout Zones Indicator Settings
The indicator settings are fully visible in the image below:
● Chart Theme: Background color of the chart;
● Zone Start Hour: Start hour of the zone;
● Zone End Hour: End hour of the zone;
● Entry Offset: Distance between the extended lines and the main zone lines;
● Lines Color: Line color.
Conclusion
The Breakout Zones Indicator in MetaTrader 5 is a key support and resistance-based trading tool. Traders can identify a zone and wait for a breakout to determine the probable market direction. However, they must watch out for false breakouts.