Three Bars High Low indicator MT5
- Индикаторы
- Eda Kaya
- Версия: 1.3
3 Bars High Low indicator for MT5
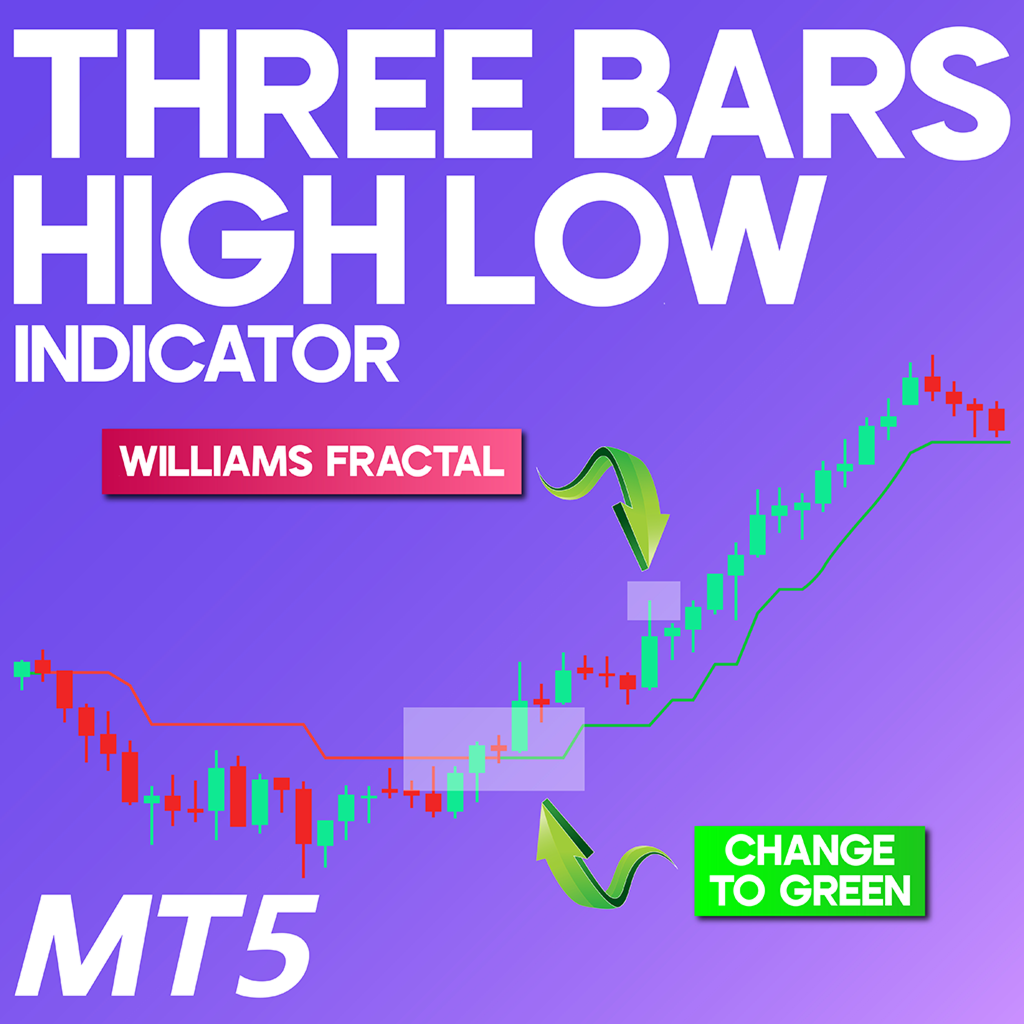
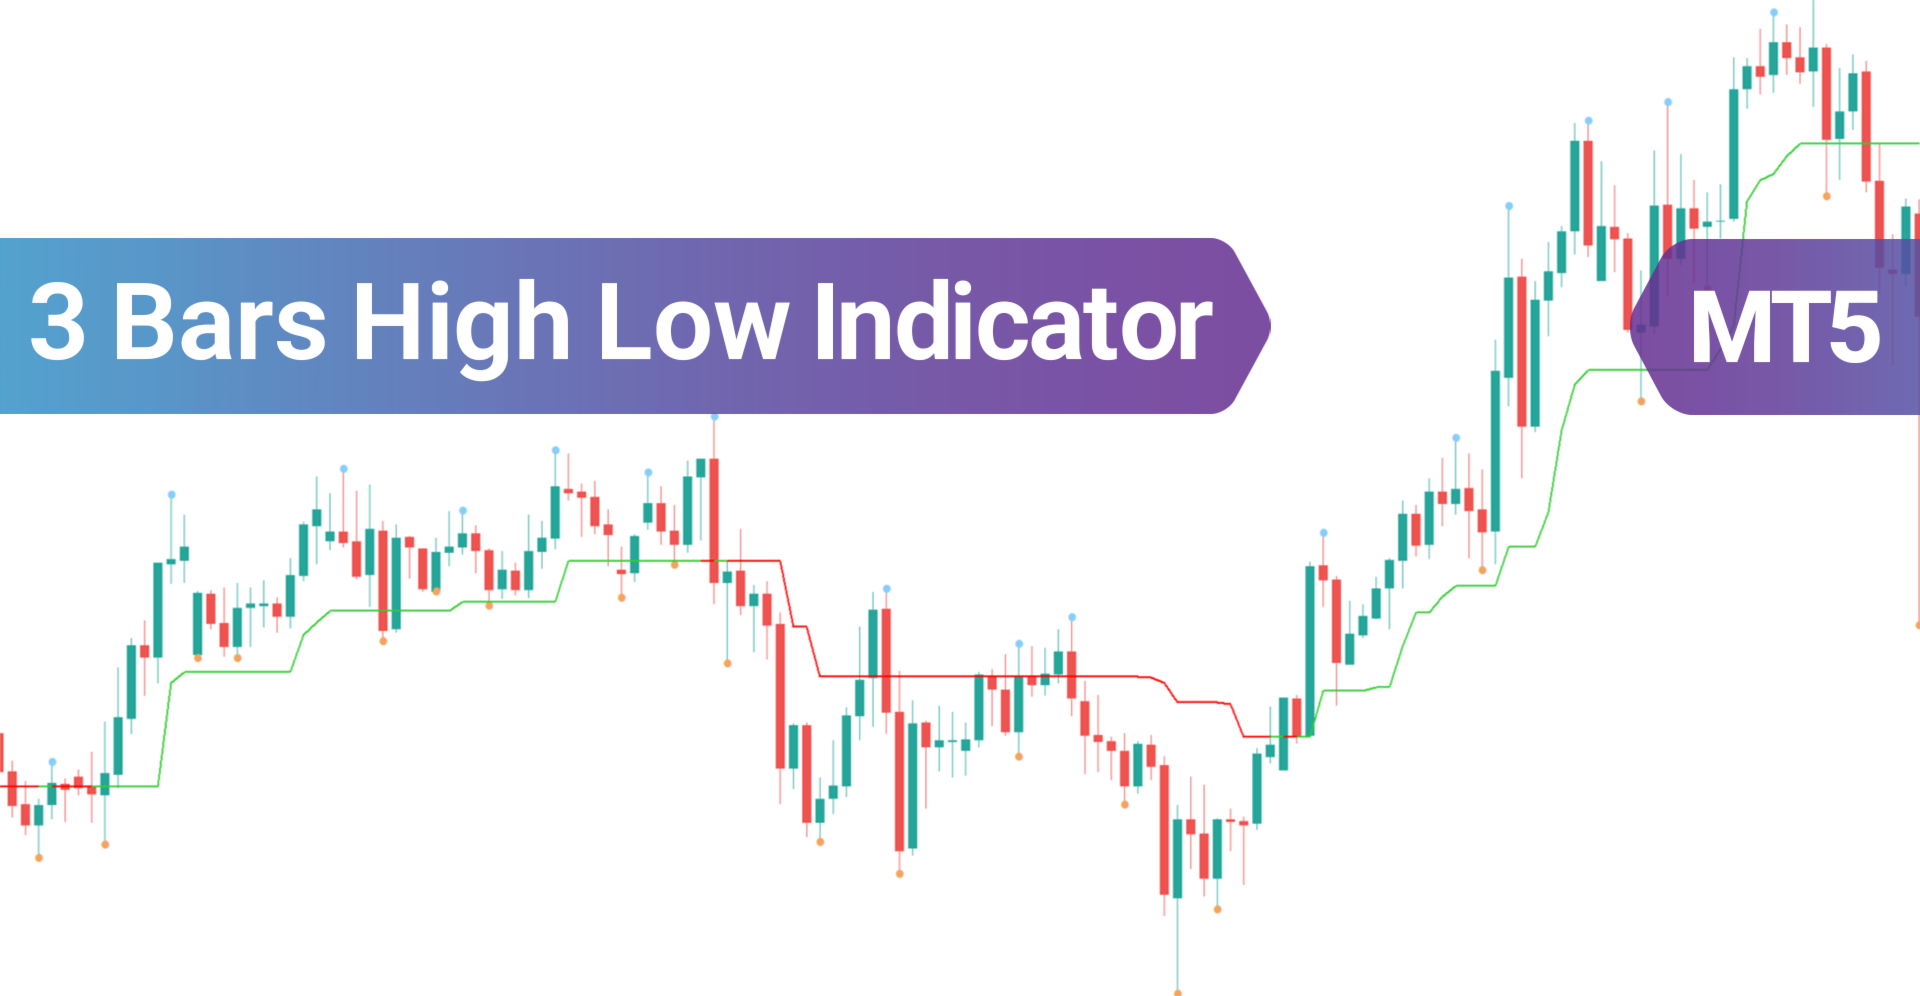
The 3 Bars High Low Indicator combines the concepts of the Commodity Channel Index (CCI) and Average True Range (ATR) to display trend movement and volatility. This indicator includes a dynamic line and Williams Fractal points.
When the price moves above the indicator line, the color changes to green, and when the price moves below it, the color changes to red. Consecutive Williams points indicate the price's inclination to move in a particular direction.
«Indicator Installation & User Guide»
MT5 Indicator Installation |Three Bars High Low indicator MT4| ALL Products By TradingFinderLab | Best MT5 Indicator: Refined Order Block Indicator for MT5 | Best MT5 Utility: Trade Assistant Expert TF MT5 | TP & SL Tool: Risk Reward Ratio Calculator RRR MT5 | Money Management: Easy Trade Manager MT5 | Trade Copier: Free Fast Local Trade Copier MT5
Specifications of the 3 Bars High Low Indicator
This table includes the features and specifications of the indicator:
| Category | Trading Tool - Support and Resistance - Levels and Zones |
| Platform | MetaTrader 5 |
| Skill Level | Intermediate |
| Indicator Type | Continuation - Reversal |
| Timeframe | Multi Timeframe |
| Trading Style | Intraday - Medium Term |
| Market | All Markets |
Overview
The Williams Fractal refers to five candles formed consecutively. A bullish fractal occurs when a candle is positioned between two candles with higher lows. In comparison, a bearish fractal occurs when a candle is positioned between two candles with lower highs.
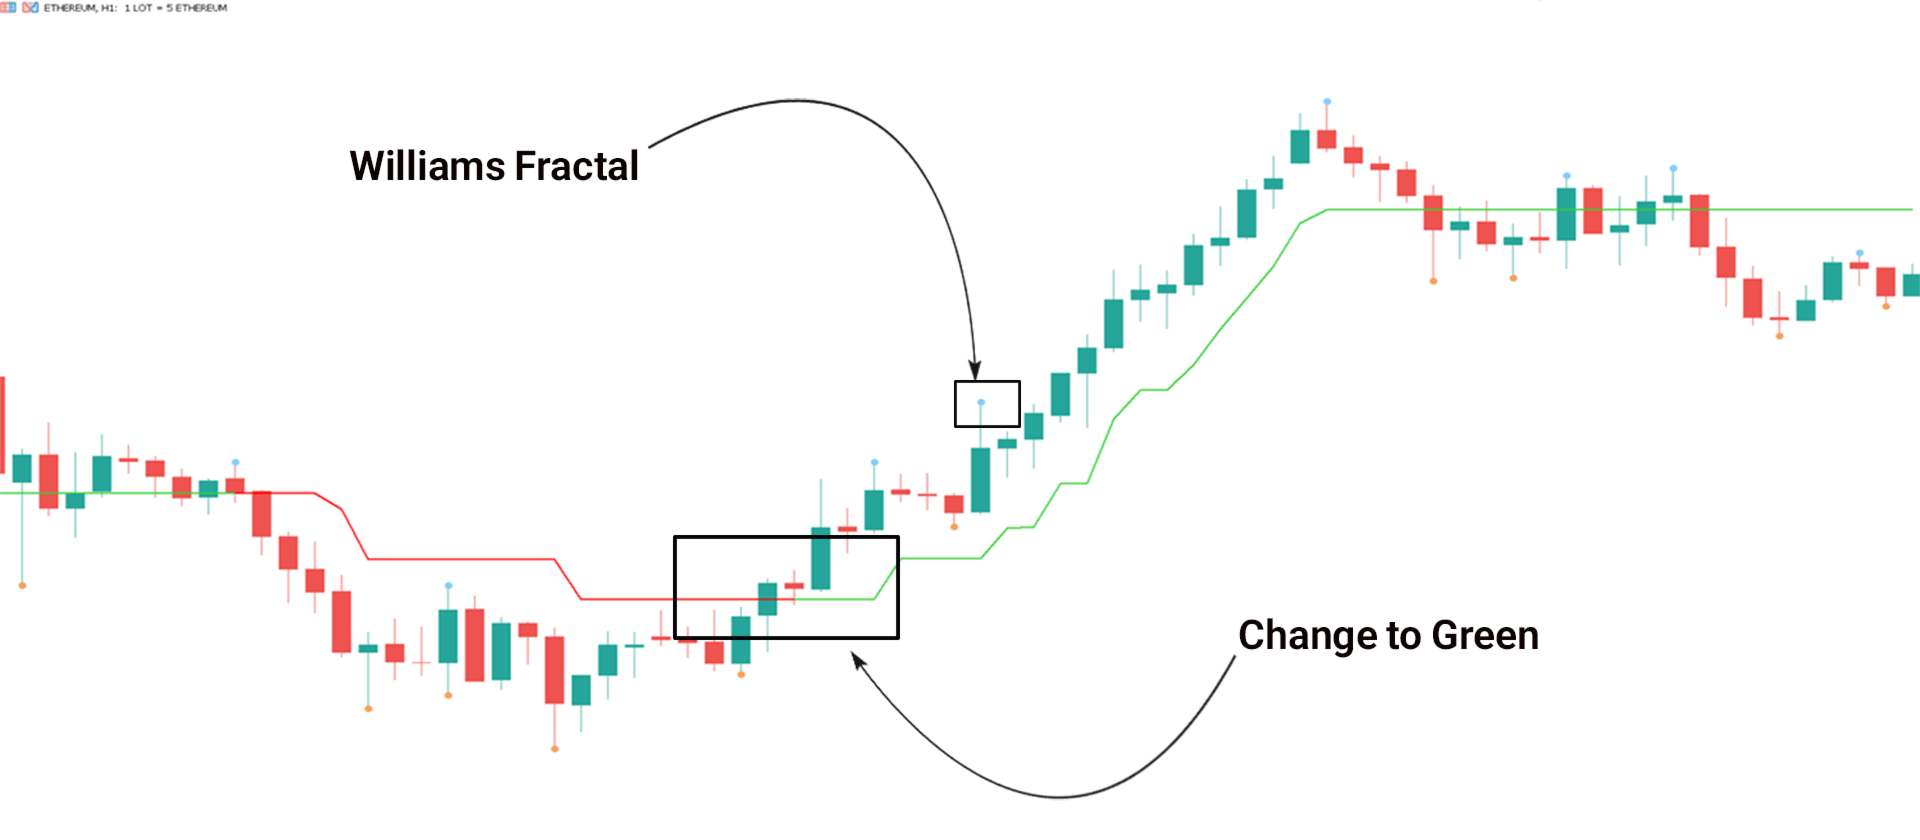
Performance of the Indicator in an Uptrend
As shown in the Ethereum (ETH) chart in the 1-hour timeframe, after forming a price range, the price breaks above the indicator line (changing to green).
The price breaking above the indicator line can indicate the beginning of an uptrend. The blue and red points are the Williams Fractal points.
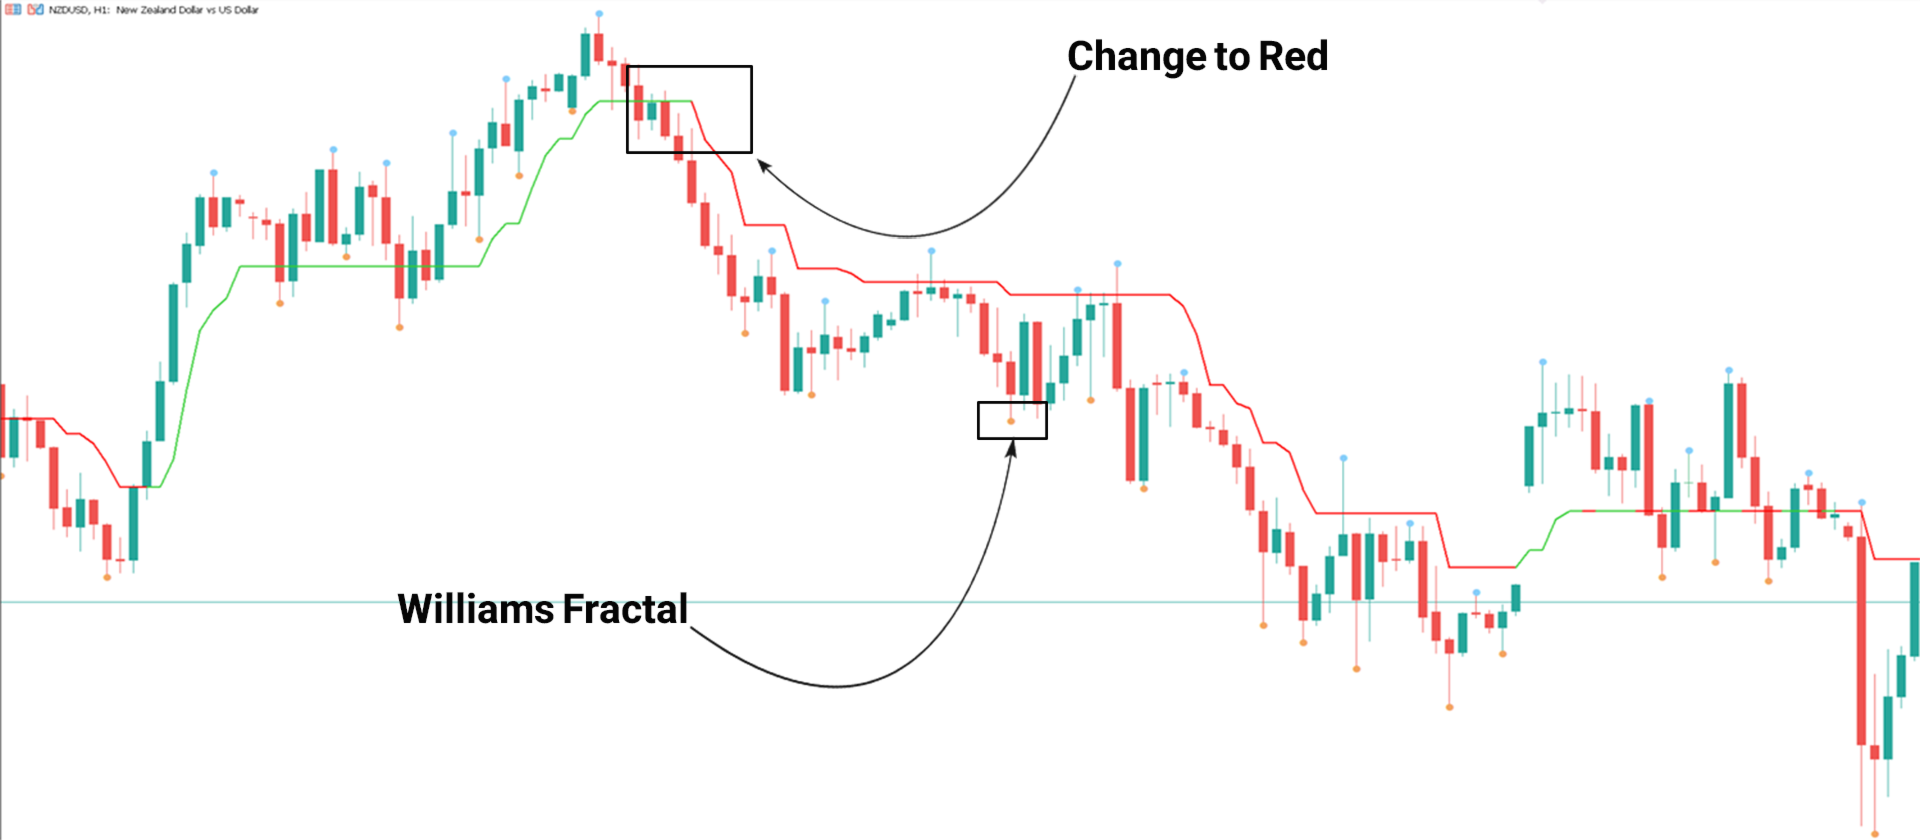
Performance of the Indicator in a Downtrend
As shown in the NZD/USD pair chart in the 1-hour timeframe, the price moves out of equilibrium and breaks below the indicator line (changing to red). The price breaking below the indicator line can indicate the beginning of a downtrend. The blue and red points also represent the Williams Fractal.
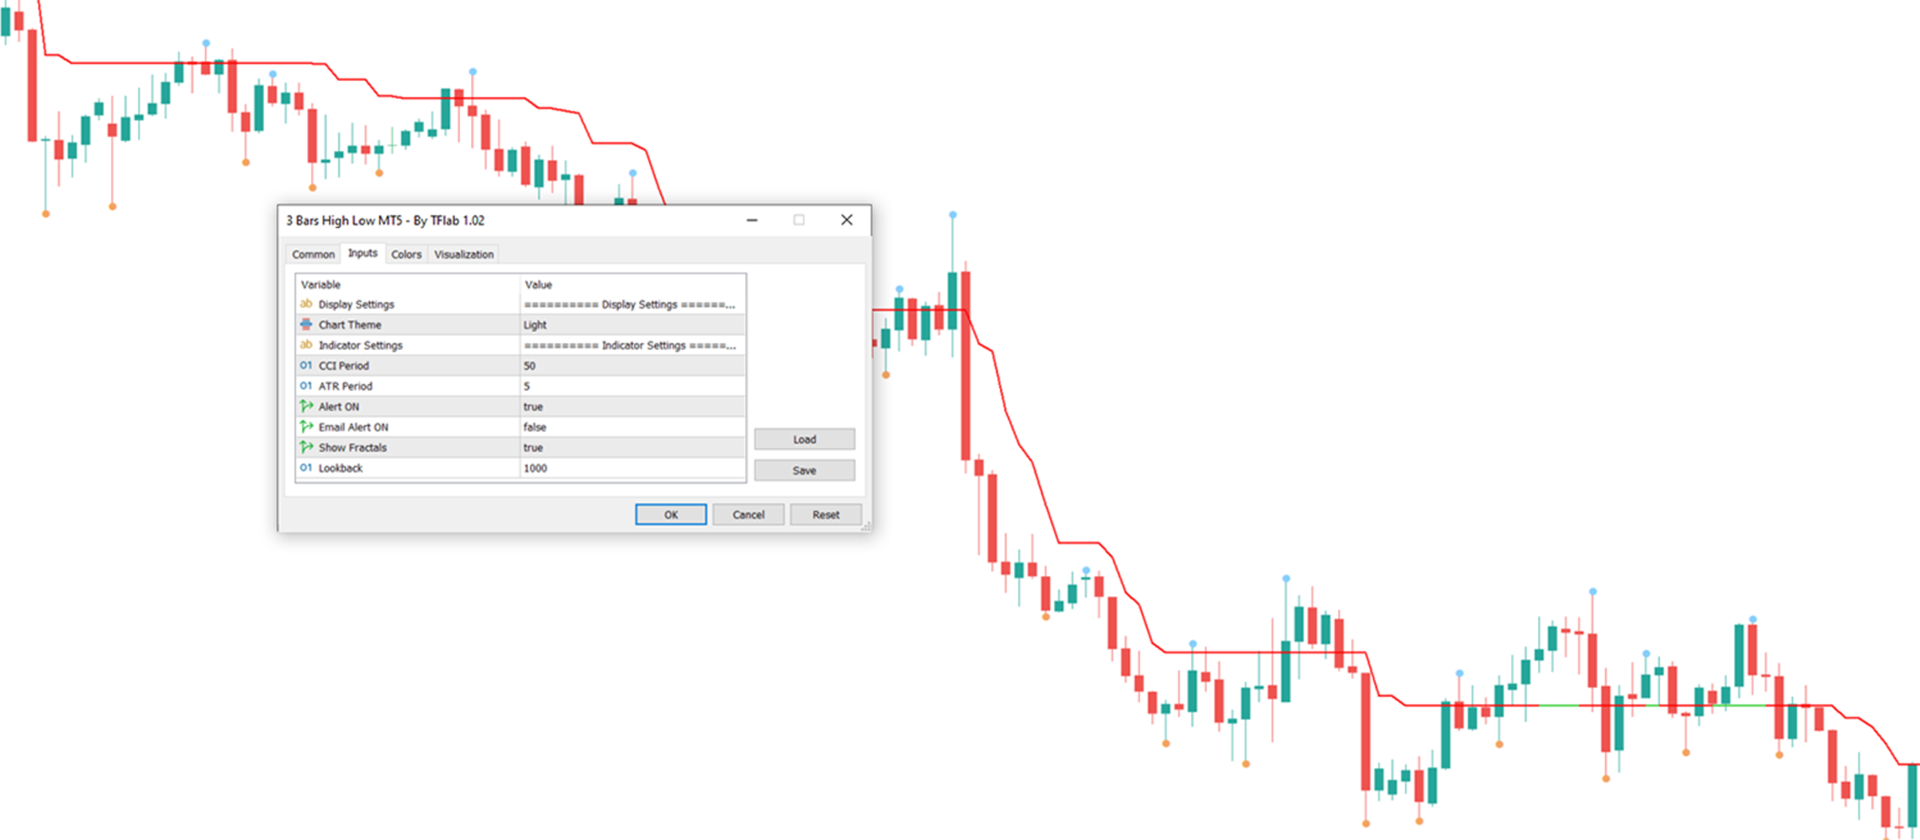
Indicator Settings
All parameters of the indicator are provided in this section to enhance performance:
● Chart Theme: Theme customization for the indicator;
● CCI Period: Set CCI period to 50;
● ATR Period: Set ATR period to 5;
● Alert On: Enable trend change alerts;
● Alert Email: Send alerts via email;
● Show Fractals: Display fractals on the chart;
● Lookback: Number of candles used for calculation, default is 500.
Conclusion
The 3 Bars High Low Indicator, using the CCI index and considering the ATR (Average True Range), can display trend reversals and retracement areas. Additionally, besides identifying price movements, the line drawn by the indicator can be an appropriate area for placing a stop-loss (SL).