• Обзор
  • Отзывы (15)
  • Обсуждение (73)
  • Что нового

Blahtech Supply Demand MT5

4.54

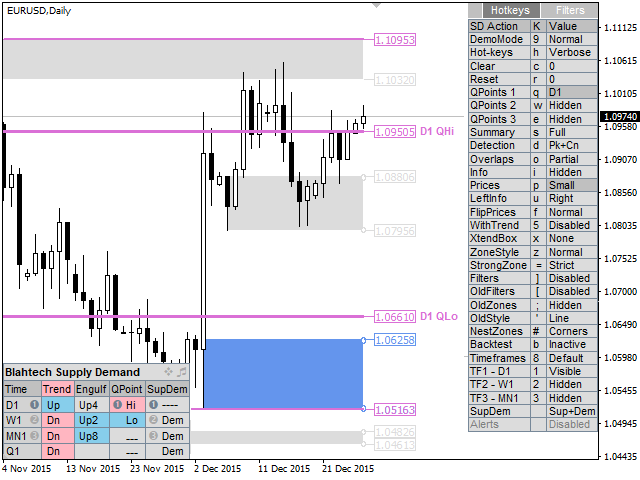
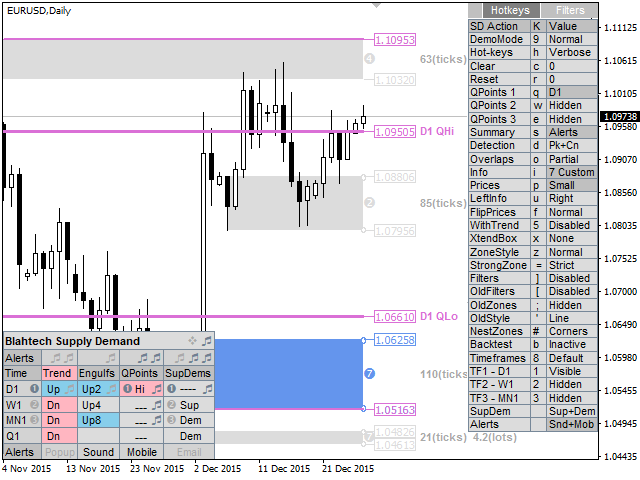
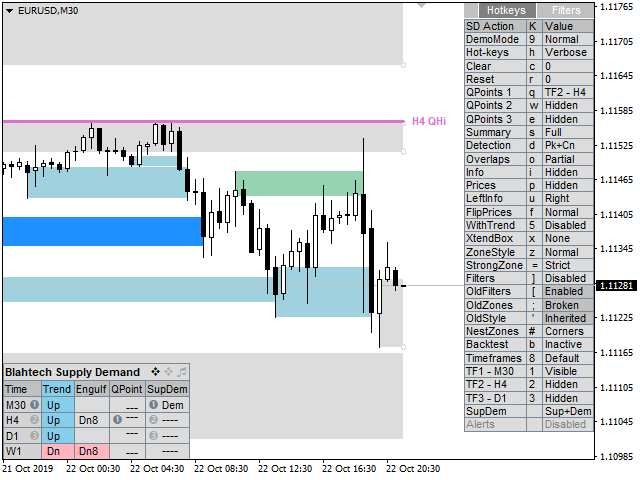
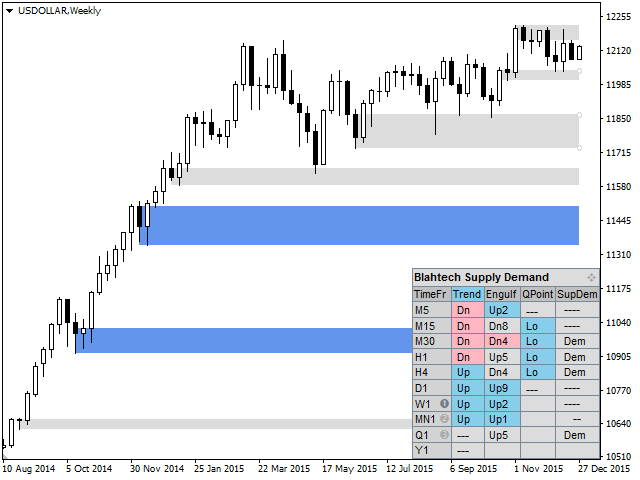
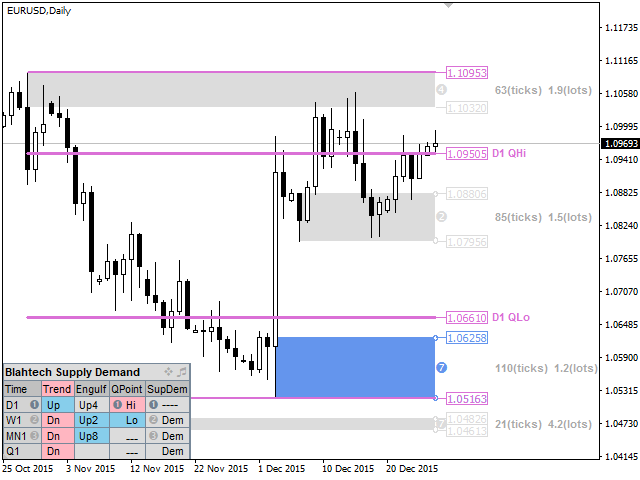
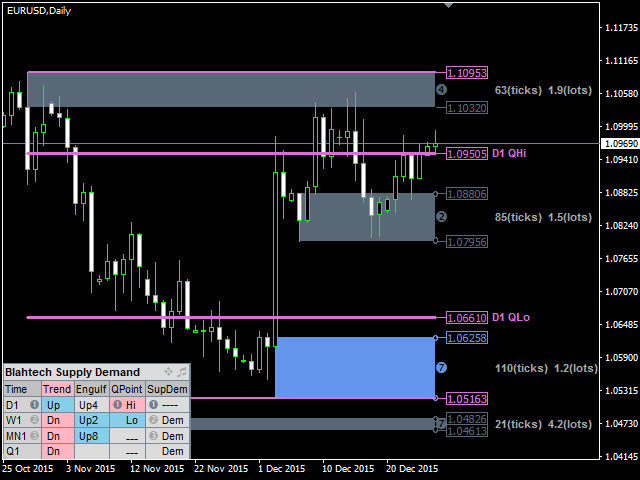
Индикатор Supply Demand использует предыдущее ценовое действие для выявления потенциального дисбаланса между покупателями и продавцами. Ключевым является определение зон с лучшими возможностями, а не просто вероятностей.

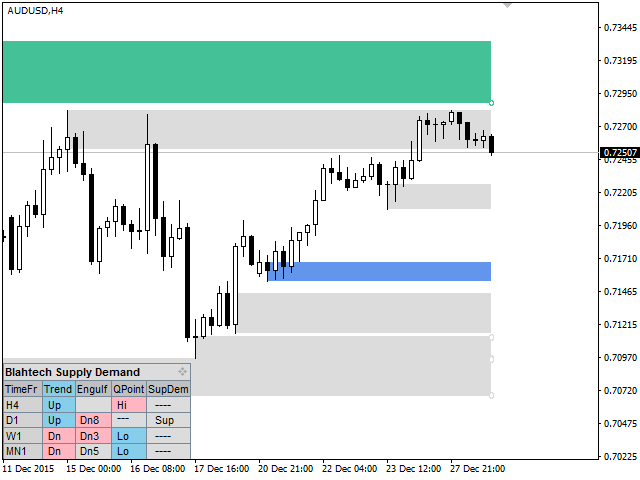
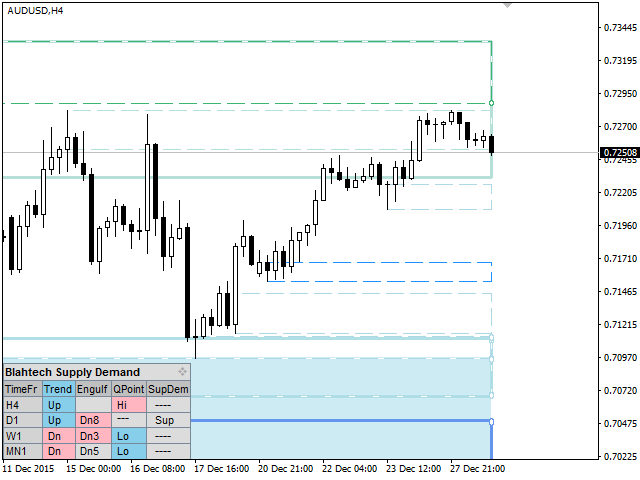
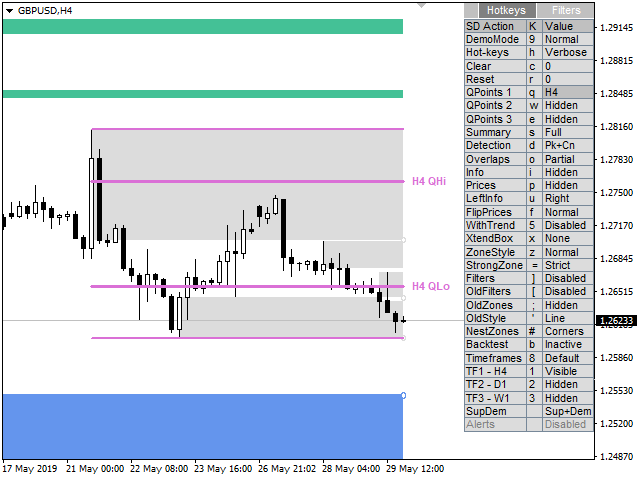
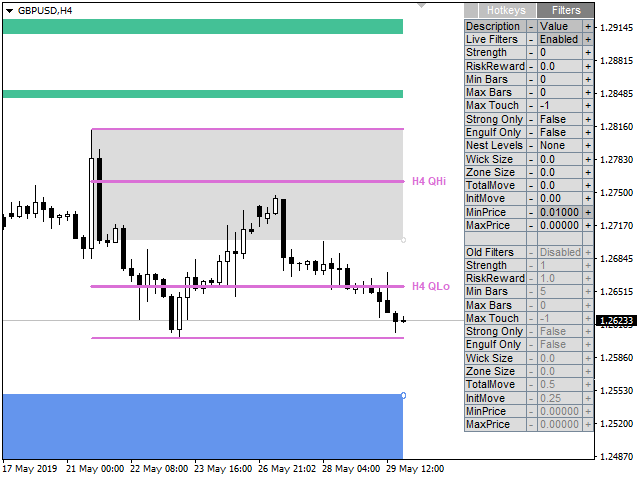
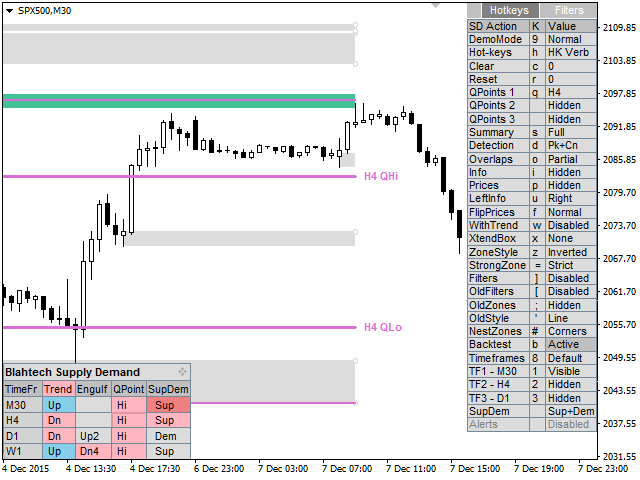
Индикатор Blahtech Supply Demand обеспечивает функционал, не доступный ни в одной платформе. Этот индикатор 4 в 1 не только выделяет зоны с более высокой вероятностью на основе механизма оценки силы по множественным критериям, но также комбинирует его с мульти-таймфреймовым анализом тренда, ранее подтвержденными свинг-движениями и детекторами поглощения. Индикатор включает в себя удобный и простой интерфейс, а также инновационный режим тестирования на истории, благодаря чему это незаменимый инструмент для всех трейдеров, торгующих на основе анализа спроса и предложения.


Links [ Install | Update | Documentation & Training ]


Основные особенности

  • Мультитаймфреймовое отображение
  • Тест по истории непосредственно на графике
  • Панель информации
  • Анализ тренда по нескольким таймфреймам
  • Подтвержденные свинг-движения 
  • Механизм оценки силы зоны 
  • Расширенный поиск уровней 
  • Квартальные и годовые уровни


Отзывы 15
onlinewolfgang
90
onlinewolfgang 2023.10.14 10:02 
 

5 Sterne, es hält was es verspricht, hilft wirklich sehr gut, es ist professionell bearbeitet.

Nicolas Dobrovsky
824
Nicolas Dobrovsky 2023.08.21 17:26 
 

Great indicator, I used it on MT4. I have been using it on MT5 for a few months now, the advantage of MT5 is more time frames (H2,H3 etc)

Denis Sokolovsky
421
Denis Sokolovsky 2023.06.25 21:39 
 

thank you :)

Рекомендуем также
Профиль Рынка (Market Profile) определяет ряд типов дней, которые помогают трейдеру распознать поведение рынка. Ключевая особенность - это область значений (Value Area), представляющая диапазон ценового действия, в котором произошло 70% торговли. Понимание области значений может помочь трейдерам вникнуть в направление рынка и установить торговлю с более высокими шансами на успех. Это отличное дополнение к любой системе, которую вы возможно используете. Blahtech Limited представляет сообществу Me
BoxChart MT5
Evgeny Shevtsov
5 (7)
Рынок несправедлив, хотя бы потому, что всего лишь 10% игроков управляют 90% капитала. У рядового трейдера мало шансов, чтобы противостоять этим «хищникам». Но выход есть, необходимо всего лишь перейти на другую сторону, необходимо находиться в числе этих 10% «акул», научиться распознавать их намерения и двигаться вместе с ними. Объем - это единственный опережающий фактор, который безупречно работает на любом периоде и любом торговом инструменте. Сначала зарождается и накапливается объем, и толь
Индикатор строит текущие котировки, которые можно сравнить с историческими и на этом основании сделать прогноз ценового движения. Индикатор имеет текстовое поле для быстрой навигации к нужной дате. Параметры : Symbol - выбор символа, который будет отображать индикатор; SymbolPeriod - выбор периода, с которого индикатор будет брать данные; IndicatorColor - цвет индикатора; Inverse - true переворачивает котировки, false - исходный вид; Далее идут настройки текстового поля, в которое можно ввес
Market Profile Introducing the Market Profile MetaTrader Indicator—your gateway to mastering market dynamics with precision and insight. This powerful tool delivers a classic Market Profile analysis, revealing price density over time and highlighting crucial levels, including the value area and control value for any trading session.  Compatible with timeframes from M1 to D1, it adapts to daily, weekly, monthly, or even intraday sessions, offering you unmatched flexibility. Lower timeframes prov
Advanced Volume Profile Analysis Tool for MetaTrader 5 The Kecia Volume Profile Order Finder provides traders with volume profile analysis capabilities. This MT5 indicator combines volume profile visualization with statistical calculations to help identify potential trading opportunities and suggests entry, stop loss, and take profit levels based on market structure. Market Profile Visualization Transform your chart with customizable volume profile visualizations: Multiple visualization options
Haven Volume Profile - это многофункциональный индикатор для анализа объемного профиля, который помогает определять ключевые ценовые уровни на основе распределения объема торгов. Он предназначен для профессиональных трейдеров, желающих более точно понимать рынок и выявлять важные точки для входа и выхода из сделок. Другие продукты ->  ЗДЕСЬ Основные возможности: Расчет Point of Control (POC) - уровня максимальной торговой активности, который позволяет выявить наиболее ликвидные уровни Определени
FREE
Description: The Volume Profile displays detailed informations of historical trading activities at certain price levels (Market Profile). Locate the areas with the best prices in the market and get an advantage over other market participants. Features: Customizable Market Profile Shows the "fair" Value Area with 70% of all Volume Shows critical low volume zones Shows VPOC, VAL and VAH Points integrated resource management to reduce the load while working with multiple charts Works on all timefr
Order Book, известный также как Market Book, глубина рынка, стакан цен, Level 2, - это предоставляемая брокером динамически обновляемая таблица с данными по текущим объемам торговых заявок на покупку и продажу для различных уровней цен вблизи Bid и Ask конкретного финансового инструмента. MetaTrader 5 предоставляет возможность трансляции стакана цен , но только в реальном времени. Данный индикатор OrderBook Cumulative Indicator позволяет аккумулировать данные стакана онлайн и визуализировать их
To download MT4 version please click here . - This is the exact conversion from TradingView: "Trend Direction Force Index - TDFI [wm]" By "causecelebre". - The screenshot shows similar results from tradingview and Metatrader when tested on ICMarkets on both platforms. - This indicator uses multiple levels of averaging to detect trend strength. - You can optimize filter low and filter high levels to achieve best results. - You have access to buffers to use in EAs. - This is a light-load processin
VR Grid Mt5
Vladimir Pastushak
3.25 (8)
Индикатор VR Grid разработан для создания графической сетки с настройками, определяемыми пользователем. В отличие от стандартной сетки VR Grid используется для построения круглых уровней . В зависимости от выбора пользователя, шаг между круглыми уровнями может быть произвольным. Кроме того, в отличие от других индикаторов и утилит, VR Grid сохраняет положение сетки даже при изменении временного периода или перезагрузке терминала. Настройки, set файлы, демо версии, инструкции, решение проблем, мо
FREE
Индикатор объемного профиля рынка + умный осциллятор. Работает практически на всех инструментах-валютные пары, акции, фьючерсы, криптовалюта, на реальных объемах и на тиковых. Можно задавать как автоматическое определение диапазона построения профиля, например за неделю или месяц и т.д. так и устанавливать диапазон вручную передвигая границы (две вертикальные линии красная и синяя). Показывается в виде гистограммы. Ширина гистограммы на данном уровне означает, условно, количество сделок, проведе
Индикатор вычисляет профиль объёма и выставляет метки, соответствующие уровням VAL, VAH и POC, для каждой свечи индивидуально. Особенности работы индикатора Индикатор работает на периодах от M3 до MN, но для вычислений использует исторические данные меньших периодов: M1 - для периодов от M3 до H1, M5 - для периодов от H2 до H12, M30 - для периода D1, H4 - для периода W1, D1 - для периода MN. Цвет и положение меток VAL, VAH и POC на текущей свече считаются корректными только по времени близкому
FREE
Индикатор   Visual Volatility Clustering   кластеризирует рынок на основе волатильности. Индикатор не перерисовывает и дает точные данные, не использует цены закрытия. Использует цены открытия или цены максимумов или минимумов но предыдущего завершенного бара. Поэтому вся информация будет четкой и однозначной. Суть индикатора – разделить рынок цены на определенные участки по схожему типу волатильности. Это можно делать как угодно. В данном примере индикатор сконфигурирован на временной период W
Premium level - это уникальный индикатор с точностью правильных прогнозов  более 80%!  Данный индикатор тестировался более двух месяцев лучшими Специалистами в области Трейдинга!  Индикатор авторский такого вы больше не где не найдете!  По скриншотах можете сами увидеть точностью данного инструмента!  1 отлично подходит для торговли бинарными опционами со временем экспирации на 1 свечу. 2 работает на всех валютных парах, акциях, сырье, криптовалютах Инструкция: Как только появляется красная стре
Этот продукт позволит Вам выгодно приобреcти и использовать два самых популярных продукта для анализа объемов заявок и сделок на биржевых рынках: Actual Depth of Market Chart Actual Tick Footprint Volume Chart Данный продукт вобрал в себя всю мощь каждого отдельного индикатора и оформлен в виде одного файла. Функционал продукта Actual COMBO Depth of Market AND Tick Volume Chart полностью идентичен оригинальным индикаторам. Вы оцените удобство объединения этих двух продуктов в один супер-индикато
The Penta-O is a 6-point retracement harmonacci pattern which usually precedes big market movements. Penta-O patterns can expand and repaint quite a bit. To make things easier this indicator implements a twist: it waits for a donchian breakout in the right direction before signaling the trade. The end result is an otherwise repainting indicator with a very reliable trading signal. The donchian breakout period is entered as an input. [ Installation Guide | Update Guide | Troubleshooting | FAQ | A
Market Profile 3 ForexArby com
Hussien Abdeltwab Hussien Ryad
3.93 (14)
Market Profile 3 MetaTrader 5 indicator  version 4.70— is a classic Market Profile implementation that can show the price density over time, outlining the most important price levels, value area, and control value of a given trading session. This indicator can be attached to timeframes between M1 and D1 and will show the Market Profile for daily, weekly, monthly, or even intraday sessions. Lower timeframes offer higher precision. Higher timeframes are recommended for better visibility. It is als
FREE
Индикатор SMC Venom Model BPR — профессиональный инструмент для трейдеров, работающих в рамках концепции Smart Money (SMC). Он автоматически идентифицирует на графике цены два ключевых паттерна:  FVG   (Fair Value Gap) — комбинация их трёх свечей, в которой имеется разрыв между первой и третьей свечой. Формирует зону между уровнями, где отсутствует поддержка объемов, что часто приводит к коррекции цены. BPR   (Balanced Price Range)— комбинация двух FVG-паттернов, образующих «мост»  — зону пробо
This is a multi-symbol and multi-timeframe table-based indicator designed for a candlestick patterns detection with 46 patterns for META TRADER 5. Each formation has own image for easier recognition. Here you find most popular formations such as "Engulfing", "Hammer", "Three Line Strike", "Piercing" or Doji - like candles. Check my full list of patterns on my screenshots below. Also you can not only switch all bearish or bullish patterns from input, but also select formation for a specified symb
Introducing "X Marks the Spot" – Your Ultimate MetaTrader 5 Indicator for Perfect Trades! Are you tired of the guesswork in trading? Ready to take your MetaTrader 5 experience to a whole new level? Look no further – "X Marks the Spot" is here to revolutionize your trading strategy! What is "X Marks the Spot"? "X Marks the Spot" is not just another indicator – it's your personal trading compass that works seamlessly on all timeframes . Whether you're a beginner or an experienced trader,
Trading Utility for Forex Currency Pairs Only not for Gold  Functions Auto Lot Calculation based on Risk Auto stoploss  Auto TakeProfit Breakeven Auto Close Half % Close in percentage with respect to the PIPs Pending Orders BuyLimit Sell Limit with distances BuyStop Sell Stop    with distances Trading Informations Risk in percentage For Multiple trades Combine Takeprofit and Combine Stoplosses
Introduction to Chart Pattern MT Chart Pattern MT is a chart pattern scanner to detect the triangle pattern, falling wedge pattern, rising wedge pattern, channel pattern and so on. Chart Pattern MT uses highly sophisticated chart pattern detection algorithm. However, we have designed it in the easy to use with intuitive user interface. Chart Pattern MT will show all the patterns in your chart in the most efficient format for your trading. You do not have to do tedious manual pattern detection an
Это, пожалуй, самый полный индикатор автоматического распознавания гармонического ценообразования, который вы можете найти для платформы MetaTrader. Он обнаруживает 19 различных паттернов, воспринимает проекции Фибоначчи так же серьезно, как и вы, отображает зону потенциального разворота (PRZ) и находит подходящие уровни стоп-лосс и тейк-профит. [ Руководство по установке | Руководство по обновлению | Устранение неполадок | FAQ | Все продукты ] Он обнаруживает 19 различных гармонических ценов
Before installing the HeatMap indicator make sure you are using a broker that gives you access to the Depth of market (DOM) !! This indicator creates a heatmap on your chart allowing you to see the buy or sell limit orders easily and in real time. You have the possibility to change the setting and the colors of the HeatMap in order to adapt to all markets and all charts. Here is an example of a setting you can use with the NASDAQ100 on the AMPGlobal broker :  https://www.youtube.com/watch?v=x0Y
VP hidden
Emr Aljnaby
4.22 (9)
The indicator works to convert normal volume into levels and determine financial liquidity control points. It is very similar in function to Fixed Volume Profile. But it is considered more accurate and easier to use than the one found on Trading View because it calculates the full trading volumes in each candle and in all the brokers present in MetaTrade, unlike what is found in Trading View, as it only measures the broker’s displayed prices. To follow us on social media platforms: telegram
FREE
Simple QM Pattern   is a powerful and intuitive trading indicator designed to simplify the identification of the Quasimodo (QM) trading pattern. The QM pattern is widely recognized among traders for effectively signaling potential   reversals   by highlighting key market structures and price action formations. This indicator helps traders easily visualize the QM pattern directly on their charts, making it straightforward even for those who are new to pattern trading. Simple QM Pattern includes d
FREE
An ICT fair value gap is a trading concept that identifies market imbalances based on a three-candle sequence. The middle candle has a large body while the adjacent candles have upper and lower wicks that do not overlap with the middle candle. This formation suggests that there is an imbalance where buying and selling powers are not equal. Settings Minimum size of FVG (pips) -> FVGs less than the indicated pips will be not be drawn Show touched FVGs Normal FVG color -> color of FVG that hasn't
FREE
Индикатор подчёркивает те моменты, которые профессиональный трейдер видит в обычных индикаторах. VisualVol визуально отображает разные показатели волатильности в единой шкале и общем масштабе. Подчёркивает цветом превышение показателей объёма. Одновременно могут быть отображены Тиковый и Реальный Объем, Действительный диапазон, ATR, размер свечи и ретурнс (разница open-close). Благодаря VisualVol вы увидите рыночные периоды и подходящее время для разных торговых операций. Эта версия предназначен
FREE
Value Chart Candlesticks
Flavio Javier Jarabeck
4.75 (12)
The idea of a Value Chart indicator was presented in the very good book I read back in 2020 , " Dynamic Trading Indicators: Winning with Value Charts and Price Action Profile ", from the authors Mark Helweg and David Stendahl. The idea is simple and the result is pure genius: Present candlestick Price analysis in a detrended way! HOW TO READ THIS INDICATOR Look for Overbought and Oversold levels. Of course, you will need to test the settings a lot to find the "correct" one for your approach. It
FREE
Индикатор анализирует шкалу объёмов и разделяет её на две компоненты - объёмы продавцов и объёмы покупателей, а также вычисляет дельту и кумулятивную дельту. Индикатор не мерцает и не перерисовывает, вычисления и отрисовку производит достаточно быстро, используя при этом данные с младших (относительно текущего) периодов. Режимы работы индикатора переключаются с помощью входной переменной Mode : Buy - отображает только объёмы покупателей. Sell - отображает только объёмы продавцов. BuySell - отобр
FREE
С этим продуктом покупают
Сколько раз вы покупали торговый индикатор с отличными бэк-тестами, доказательством производительности на реальном счете с фантастическими числами и статистикой повсюду , но после использования вы в конечном итоге сливали свой счет? Вам не следует доверять сигналу самому по себе, вам нужно знать, почему он появился в первую очередь, и это то, что RelicusRoad Pro делает лучше всего! Руководство пользователя + Стратегии + Обучающие видео + Приватная группа с VIP-доступом + Доступна мобильная верс
ENIGMERA: Сердце рынка Введение Этот индикатор и торговая система представляют собой выдающийся подход к финансовым рынкам. ENIGMERA использует фрактальные циклы для точного расчёта уровней поддержки и сопротивления. Он показывает подлинную фазу накопления и задаёт направление и цели — система работает как в тренде, так и в коррекции. Как это работает Большая часть функционала индикатора управляется кнопками на левой панели графика, что позволяет мгновенно реагировать на разные рыночные условия.
note: this indicator is for METATRADER4, if you want the version for METATRADER5 this is the link:  https://www.mql5.com/it/market/product/108106 TRENDMAESTRO ver 2.4 TRENDMAESTRO recognizes a new TREND in the bud, he never makes mistakes. The certainty of identifying a new TREND is priceless. DESCRIPTION TRENDMAESTRO identifies a new TREND in the bud, this indicator examines the volatility, volumes and momentum to identify the moment in which there is an explosion of one or more of these data a
Разворотные зоны / Пиковые объемы / Активные зоны крупного игрока =  ТС TPSPROSYSTEM ИНСТРУКЦИЯ RUS  /  INSTRUCTIONS  ENG        /       Version MT4    Каждый покупатель этого индикатора получает дополнительно БЕСПЛАТНО:  3 месяцев доступа к торговым сигналам от сервиса RFI SIGNALS — готовые точки входа по алгоритму TPSproSYSTEM. Обучающие материалы с регулярными обновлениями — погружение в стратегию и рост профессионального уровня. Круглосуточная поддержка в будние дни (24/5) и доступ в закрыт
TrendFusionXplorer consists of three powerful trend-analyzing indicators — TRP , PMax and OTT — developed by Kivanc Ozbilgic. Each indicator displays the trend's support and resistance levels based on its unique properties and methodology. TrendFusionXplorer assists in determining entry and exit points for markets and can also be used for setting trailing stop-loss (SL) and take-profit (TP) levels on open positions. Specifications 1. Trend Reversal Predictor (TRP): TRP follows Thomas R. DeMar
NOTE: CYCLEMAESTRO is distributed only on this website, there are no other distributors. Demo version is for reference only and is not supported. Full versione is perfectly functional and it is supported. CYCLEMAESTRO , the first and only indicator of Cyclic Analysis, useful for giving signals of TRADING, BUY, SELL, STOP LOSS, ADDING. Created on the logic of   Serghei Istrati   and programmed by   Stefano Frisetti ;   CYCLEMAESTRO   is not an indicator like the others, the challenge was to inter
Berma Bands
Muhammad Elbermawi
5 (4)
Индикатор Berma Bands (BBs) является ценным инструментом для трейдеров, стремящихся определить и извлечь выгоду из рыночных тенденций. Анализируя взаимосвязь между ценой и BBs, трейдеры могут определить, находится ли рынок в фазе тренда или диапазона. Посетите [ Блог Berma Home ], чтобы узнать больше. Berma Bands состоят из трех отдельных линий: Upper Berma Band, Middle Berma Band и Lower Berma Band. Эти линии наносятся вокруг цены, создавая визуальное представление движения цены относительно об
Triplet Cloud MTF is an indicator for trend-following strategy. It presents the trend in HTF from the LTF Chart that allows traders focus on looking for trade entry in the right direction and increase striking rate. It comes with simple input setup. You will only need to choose HTF you want to follow its trend and set the alert setup, then all is set. Here are the mostly selected HTF setup for each of entry timeframe: M1 Entry   : M15 Trend M5 Entry   : H1 Trend M15 Entry   : H4 Trend H1 Entry  
Viking_Strategy_Signal Indicator is a solution I offer to beginner, amateur, and professional traders. My scalping robot :  https://www.mql5.com/fr/market/product/133191 By purchasing this indicator, you will first save time because it automatically analyzes the market based on Dow Theory and the Smart Money Concept (High (H), Low (L), Higher High (HH), Lower Low (LL), Break of Structure (BOS) to determine market structure and trend). It is built on my strategy, which relies on the NRTR theory t
The AT Forex Indicator MT5 is a sophisticated trading tool designed to provide traders with a comprehensive analysis of multiple currency pairs. This powerful indicator simplifies the complex nature of the forex market, making it accessible for both novice and experienced traders. AT Forex Indicator uses advanced algorithms to detect trends, patterns and is an essential tool for traders aiming to enhance their forex trading performance. With its robust features, ease of use, and reliable signal
«Пиранья» - автономная торговая система, определяющая уровни перекупленности и перепроданности на графике. Красная и синяя зоны отображают уровни перекупленности и перепроданности соответственно. Вход в сделку обозначен стрелками: стрелка вниз в красной зоне для "sell" и стрелка вверх в синей зоне для "buy". Уровень Тейк профита обозначен зеленой средней скользящей. Важные особенности: Регулировка уровня Тейк профита при изменении положения зеленой средней скользящей. Возможность усреднения пр
Introduction to Fractal Pattern Scanner Fractal Indicator refers to the technical indicator that makes use of the fractal geometry found in the financial market. Fractal Pattern Scanner is the advanced Fractal Indicator that brings the latest trading technology after the extensive research and development work in the fractal geometry in the financial market. The most important feature in Fractal Pattern Scanner is the ability to measure the turning point probability as well as the trend probabil
IVISTscalp5
Vadym Zhukovskyi
5 (6)
Что нового в индикаторе прогнозов iVISTscalp5 (Версия 10)? iVISTscalp5 – это авторская система прогнозов для любого финансового инструмента на неделю вперед (для быстрого скальпинга по уровням времени). iVISTscalp5 – инструмент для простого изучения и понимания финансового рынка. 1)     Индикатор прогнозов iVISTscalp5 полностью переписан на другой язык программирования ( C ++), что ускорило загрузку и обработку данных. Разное графическое отображение прогнозов на графике будет еще проще для п
CBT Quantum Maverick Высокоэффективная система торговли бинарными опционами CBT Quantum Maverick – это точно настроенная, высокопроизводительная система торговли бинарными опционами, созданная для трейдеров, стремящихся к точности, простоте и дисциплинированному подходу. Настройка не требуется – система оптимизирована для эффективных результатов прямо "из коробки". Просто следуйте сигналам, которые можно освоить с небольшой практикой. Основные характеристики: Точность сигналов: Сигналы для тор
Увидьте тренд. Прочитайте паттерн. Выберите момент для входа. 3 шага за 30 секунд! Торгуйте без усилий — без необходимости анализа, ваш умный помощник готов упростить вашу работу Больше никаких перегруженных графиков. Торгуйте с уверенностью, используя умное определение тренда. Совместим с любыми валютами, криптовалютой, акциями, металлами, индексами и любыми таймфреймами. Просто нажмите и выполните — все так просто. Подходит для занятых трейдеров, которые хотят скорости и ясности. TPTSyncX — э
Pro Thunder V10: Нейросетевой Индикатор для MT5 | Сигналы для Бинарных Опционов и OTC-Рынков Выведите свою торговлю бинарными опционами на новый уровень с   Pro Thunder V10   — индикатором на базе искусственного интеллекта, созданным для MetaTrader 5. Благодаря передовым нейронным сетям и многолетнему опыту анализа рынка, этот нерепайнт-инструмент обеспечивает беспрецедентную точность сигналов в любых условиях: волатильность на новостях, OTC-рынки, индексы Deriv (Boom 300, Crash 500) и многое д
IQ FX Gann Levels a precision trading indicator based on W.D. Gann’s square root methods. It plots real-time, non-repainting support and resistance levels to help traders confidently spot intraday and scalping opportunities with high accuracy. William Delbert Gann (W.D. Gann) was an exceptional market analyst, whose trading technique was based on a complex blend of mathematics, geometry, astrology, and ancient mathematics which proved to be extremely accurate. Download the Metatrader 4 Version M
MetaForecast M5
Vahidreza Heidar Gholami
5 (3)
MetaForecast предсказывает и визуализирует будущее любого рынка на основе гармонии в данных о ценах. Хотя рынок не всегда предсказуем, если существует узнаваемый паттерн в ценах, то MetaForecast способен предсказать будущее с наибольшей точностью. По сравнению с другими аналогичными продуктами, MetaForecast способен генерировать более точные результаты, анализируя тренды на рынке. Входные параметры Past size (Размер прошлых данных) Указывает количество баров, которые MetaForecast использует для
Индикатор Elliott Wave Trend был разработан для научного подсчета волн на основе шаблонов и паттернов, впервые разработанных Чжон Хо Сео. Индикатор нацелен на максимальное устранение нечеткости классического подсчета волн Эллиотта с использованием шаблонов и паттернов. Таким образом индикатор Elliott Wave Trend в первую очередь предоставляет шаблон для подсчета волн. Во-вторых, он предлагает структурный подсчет волн Wave Structural Score, которые помогает определить точное формирование волны. Он
WHY IS OUR FXACCCURATE LS MT5 THE PROFITABLE ? PROTECT YOUR CAPITAL WITH RISK MANAGEMENT Gives entry, stop and target levels from time to time. It finds Trading opportunities by analyzing what the price is doing during established trends. POWERFUL INDICATOR FOR A RELIABLE STRATEGIES We have made these indicators with a lot of years of hard work. It is made at a very advanced level. Established trends provide dozens of trading opportunities, but most trend indicators completely ignore them! The
TPA True Price Action indicator reveals the true price action of the market makers through 100% non-repainting signals strictly at the close of a candle! TPA shows entries and re-entries, every time the bulls are definitely stronger than the bears and vice versa. Not to confuse with red/green candles. The shift of power gets confirmed at the earliest stage and is ONE exit strategy of several. There are available now two free parts of the TPA User Guide for our customers. The first "The Basics"
Данный индикатор основан на математике великого трейдера W.D.Ganna.  С помощью его мы с легкостью найдете сильные уровни анализируя свинг для поиска оптимальной точки входа. Индикатор работает на всех инструментах и всех тайм фреймах. Индикатор полностью ручной и оснащен кнопками управления. Все что вам нужно это нажать на кнопку NEW, появится отрезок, данный отрезок вы размещаете на любое движение, свинг или даже 1 свечу, которую хотите проанализировать. Разместив отрезок нажимаете кнопку ОК. П
IQ Gold Gann Levels a non-repainting, precision tool designed exclusively for XAUUSD/Gold intraday trading. It uses W.D. Gann’s square root method to plot real-time support and resistance levels, helping traders spot high-probability entries with confidence and clarity. William Delbert Gann (W.D. Gann) was an exceptional market analyst, whose trading technique was based on a complex blend of mathematics, geometry, astrology, and ancient mathematics which proved to be extremely accurate. Download
Данный индикатор находит и отрисовывает зоны , так сказать места силы, где цена будет разворачиваться. Индикатор может работать на любом графике, любом инструменте, любом таймфрейме. Индикатор имеет два режима. Индикатор оснащен панелью управления с кнопками для удобства и разбит на два режима. Ручной и авто. Ручной режим: Для работы с ручным режимом необходимо нажать кнопку NEW, появится отрезок. Данный отрезок натягиваете на движение и нажимаете кнопку LVL. Отрисовывается уровень. Авто режим:
Прецизионный индикатор осциллятора (Pi-Osc) от Роджера Медкалфа из Precision Trading Systems Версия 2 была тщательно перекодирована для быстрой загрузки на вашем графике, а также внесены некоторые другие технические улучшения для улучшения опыта. Pi-Osc был создан для предоставления точных сигналов времени для совершения сделок, предназначенных для поиска экстремальных точек истощения - точек, к которым рынок вынужден идти, чтобы сработать стоп-заказы всех остальных. Этот продукт решает вековую
Golden Spikes Detector
Batsirayi L Marango
3.25 (4)
Golden Spikes Detector This indicator is based on a strategy primarily for trading spikes on Boom and Crash Indices. It alerts on potential Buy and Sell entries. To trade spikes on the Deriv or Binary broker, only take Buy Boom and Sell Cash alerts. It was optimised to be loaded on 5-minute timeframe although multiple timeframe analysis is done in the background. Features ·             Desktop pop up and sound alerts on computer or laptop ·             Sends push notifications to mobile phone ·
Индикатор   Time_Price_SQ9_Degree   основан на квадрате 9 Ганна. Используя данный индикатор вы можете выявлять сильные временные и ценовые зоны. Индикатор отображает уровни в виде градусной величины. Градусы можно прописать в настройках. После запуска появляется кнопка МЕНЮ. Если она выделена, то ее можно передвигать в любую точку графика, а после кликнув по ней двойным щелчком мыши , она перестает быть выделенной и появляются кнопки меню. Чтоб спрятать меню просто кликните по кнопке двойным щел
On-Balance Volume (OBV) - это технический индикатор, который связывает объем и цену для определения ценовых движений. Основная идея OBV заключается в том, что изменения объема обычно предшествуют изменениям цены. Индикатор накапливает объемы за периоды, когда цена закрывается выше, и вычитает объемы за периоды, когда цена закрывается ниже. В результате получается значение, которое используется для определения направления тренда актива. Интерпретация OBV проста: растущий OBV говорит о том, что
TMA Channel is a price channel obtained through a special calculation method based on traditional TMA . The channel has upper, middle, and lower tracks . When the price approaches or exceeds the upper track, it is already in an overbought state, and attention should be paid to the situation of reversal and decline; When the price approaches or falls below the lower track, it is already in an oversold state, and attention should be paid to the situation of reversal and rise . The indicator will
Ultimate Forex Trading Indicator Elevate your trading with our multi-functional indicator packed with advanced features! Key Features: 1. Non-repainting indicator for accurate signals 2. Max activations for peace of mind 3. 7+ strategies integrated for diverse trading styles 4. 10 Indicators all in one for comprehensive analysis 5. Perfect for Day and Swing Trading strategies 6. Trend following, reversal, and scalping strategies built-in 7. Create your own Custom strategies 8. Prop firm ready t
Другие продукты этого автора
Over 100,000 users on MT4 and MT5 Blahtech Candle Timer displays the remaining time before the current bar closes and a new bar forms. It can be used for time management Links [  Install  |  Update  |  Training  ] Feature Highlights The only candle timer on MT5 with no stutter and no lag S electable Location Tracks server time not local time Multiple colour Schemes Configurable Text Customisable alerts and messages Optimised to reduce CPU usage Input Parameters Text Location - Beside / Upper Le
FREE
Профиль Рынка (Market Profile) определяет ряд типов дней, которые помогают трейдеру распознать поведение рынка. Ключевая особенность - это область значений (Value Area), представляющая диапазон ценового действия, в котором произошло 70% торговли. Понимание области значений может помочь трейдерам вникнуть в направление рынка и установить торговлю с более высокими шансами на успех. Это отличное дополнение к любой системе, которую вы возможно используете. Blahtech Limited представляет сообществу Me
Over 100,000 users on MT4 and MT5 Blahtech Candle Timer displays the remaining time before the current bar closes and a new bar forms. It can be used for time management Links [  Install  |  Update  |  Training  ] Feature Highlights The only candle timer on MT4 with no stutter and no lag S electable Location Tracks server time not local time Multiple colour Schemes Configurable Text Customisable alerts and messages Optimised to reduce CPU usage Input Parameters Text Location   - Beside / Upper
FREE
Индикатор Supply Demand использует предыдущее ценовое действие для выявления потенциального дисбаланса между покупателями и продавцами. Ключевым является определение зон с лучшими возможностями, а не просто вероятностей. Индикатор Blahtech Supply Demand обеспечивает функционал, не доступный ни в одной платформе. Этот индикатор 4 в 1 не только выделяет зоны с более высокой вероятностью на основе механизма оценки силы по множественным критериям, но также комбинирует его с мульти-таймфреймовым анал
Профиль Рынка (Market Profile) определяет ряд типов дней, которые помогают трейдеру распознать поведение рынка. Ключевая особенность - это область значений (Value Area), представляющая диапазон ценового действия, в котором произошло 70% торговли. Понимание области значений может помочь трейдерам вникнуть в направление рынка и установить торговлю с более высокими шансами на успех. Это отличное дополнение к любой системе, которую вы возможно используете. Blahtech Limited представляет сообществу Me
Was: $69  Now: $49   Blahtech VWAP - Volume Weighted Average Price (VWAP) is the ratio of price to total volume. It provides an average price over a specified time interval.  Links [  Install  |  Update  |  Documentation   ] Feature Highlights Configurable VWAP Line Sessions, intervals, anchored or continuous Previous day settlement line Standard Deviation bands Alerts at bar close or real time Automatic Broker or Tick volumes Significantly reduced CPU usage Input Parameters Expert Advisor Mo
Blahtech VWAP
Blahtech Limited
5 (3)
Was: $69    Now: $49   Blahtech VWAP - Volume Weighted Average Price (VWAP) is the ratio of price to total volume. It provides an average price over a specified time interval.  Links [  Install  |  Update  |  Documentation   ] Feature Highlights Configurable VWAP Line Sessions, intervals, anchored or continuous Previous day settlement line Standard Deviation bands Alerts at bar close or real time Automatic Broker or Tick volumes Significantly reduced CPU usage Input Parameters Expert Advisor
Индикатор Blahtech Fisher Transform представляет собой осциллятор, который отображает графике области перекупленности и перепроданности. Алгоритм преобразования Фурье (Fisher Transform) преобразует цены с любой формой распределения в нормальное распределение. Конечным результатом является кривая с резкими точками разворота, которые могут помочь определить бычьи или медвежьи тренды. Значения Fisher Transform выше 1.6 на дневном графике считаются хорошими областями для сделок на разворот. Основны
Was: $49    Now: $33   Blahtech Better Volume provides an enhanced version of the vertical volume bars. Each bar is compared to the previous 20 bars. Depending on its volume, range and volume density it will be assigned a state and colour. Low Volume – Minimum volume High Churn   – Significant volume with limited movement Climax Neutral –   High volume with unclear direction Climax Up   – High volume with bullish direction Climax Dn   – High volume with bearish direction Climax Churn – High vol
Blahtech Moving Average indicator is a multitimeframe version of the standard Moving Average indicator. It is also enhanced with customisable alerts, period breaks and other configuration options. The 50 day and 200 day moving averages are widely followed by investors and traders, with breaks above and below the MA lines considered to be signals of interest. Links [  Install  |  Update  |   Training   |   All Products  ] Feature Highlights Up to three timeframes Configurable calculation variabl
FREE
Индикатор Blahtech Daily Range отображает средний дневной диапазон вместе с диапазонами отдельных сессий. Используя дневные цены открытия в качестве опорных, индикатор показывает цели фиксированного диапазона и динамического диапазона в виде линий на графике. Эти линии четко показывают, когда происходит истощение среднего диапазона. Дневные и сессионные диапазоны могут быть полезны для подтверждения входов или для установки целей, а также являются отличным способом улучшить шансы любой торговой
Индикатор Blahtech Moving Average - модифицированная версия стандартного индикатора Moving Average. Он также дополнен настраиваемыми оповещениями, разделителями периодов и другими возможностями настройки. 50-дневная и 200-дневная скользящие средние широко применяются инвесторами и трейдерами, а прорывы вверх и вниз от линий MA считаются значимыми сигналами. Основные особенности До трех таймфреймов Настраиваемые переменные для вычислений Настраиваемые оповещения и сообщения Дополнительные период
FREE
Was: $49    Now: $33   Blahtech Better Volume provides an enhanced version of the vertical volume bars. Each bar is compared to the previous 20 bars. Depending on its volume, range and volume density it will be assigned a state and colour. Low Volume – Minimum volume High Churn   – Significant volume with limited movement Climax Neutral –   High volume with unclear direction Climax Up   – High volume with bullish direction Climax Dn   – High volume with bearish direction Climax Churn – High vol
Индикатор Blahtech Daily Range отображает средний дневной диапазон вместе с диапазонами отдельных сессий. Используя дневные цены открытия в качестве опорных, индикатор показывает цели фиксированного диапазона и динамического диапазона в виде линий на графике. Эти линии четко показывают, когда происходит истощение среднего диапазона. Дневные и сессионные диапазоны могут быть полезны для подтверждения входов или для установки целей, а также являются отличным способом улучшить шансы любой торговой
Blahtech Fisher Transform indicator is an oscillator that displays overbought and oversold locations on the chart. The Fisher Transform algorithm transforms prices with any distribution shape into a normal distribution. The end result is a curve with sharp turning points that may help to identify bullish or bearish trends. Fisher Transform values exceeding 1.66 on the daily chart are considered to be good areas for reversal trades. Links [  Install  |  Update  |  Training   |  All Products  ] F
Фильтр:
onlinewolfgang
90
onlinewolfgang 2023.10.14 10:02 
 

5 Sterne, es hält was es verspricht, hilft wirklich sehr gut, es ist professionell bearbeitet.

Nicolas Dobrovsky
824
Nicolas Dobrovsky 2023.08.21 17:26 
 

Great indicator, I used it on MT4. I have been using it on MT5 for a few months now, the advantage of MT5 is more time frames (H2,H3 etc)

Denis Sokolovsky
421
Denis Sokolovsky 2023.06.25 21:39 
 

thank you :)

RiaB
59
RiaB 2022.11.14 21:07 
 

I've been using this indicator for over a year and can definitely recommend this reliable and effective tool showing high probability zones on multiple timeframes. Other functionalities include detailed info on the zones and their strength, trend indicator and backtesting mode.

boxtrader
71
boxtrader 2022.06.25 21:44 
 

Amazing tool to identify Supply & Demand levels on any chart timeframe. Tremendous flexibilty in configuring alerts and display options. Found an issue with duplicate alerts in a previous version and Blahtech quickly resolved for me. Would definitely recommend!

Frank Paetsch
7463
Frank Paetsch 2022.01.24 10:56 
 

simly good

Makarios  Yacoubian
2911
Makarios Yacoubian 2022.01.16 10:22 
 

one of the best coded system , many choices to adjust your zones . i will defiantly give 5 stars from experience trader to experience developer

47358640
24
47358640 2021.06.16 23:59 
 

I liked the app when I tested it on my demo account so I went ahead and bought it to use once I opened a “real” account. Unfortunately the MT5 platform is not very user friendly and it is very poor when it comes to customer support so I have not been able to fund my “real” account or link it to my other brokerage accounts like they say you are supposed to be able to do, so I can’t give a good review. My issue is more with MT5 and MQL5 than with Blahtech.

musashi69
24
musashi69 2021.05.22 16:03 
 

For all the bells and whistles the training and documentation fall well short of easy or intuitive use. I try to figure things out on my and then go for help if I need it. Even after I go to the manual I can't get some features to work or be altered as they do in the video. They manual should have enhanced screen captures which show what they are talking about and show changes. Not just pages of insufficient text.

EdiF
170
EdiF 2021.05.19 08:04 
 

One of the few high level Indicators.

Alief Nurtendron
123
Alief Nurtendron 2020.12.01 06:04 
 

plis help, how to lunc this indicator, i am beginner and can not use this, the botton of lunch indicator was gone

Scott Moore
34
Scott Moore 2020.09.27 17:40 
 

It works great with the relevant theory. Already back tested it with more recent market moves. I was specifically hoping it would work with S&P 500 and it aligned perfectly with the setups I was looking at. Coupled with market profile and specific setups it saves me time doing the math and charting points. Worth the money in my humble opinion.

arti90
52
arti90 2019.02.11 14:52 
 

its a brilliant indicator when u get a little bit used to it and understand it. good one its the money worse.

faithdefender
1736
faithdefender 2019.01.23 00:52 
 

I was not too impressed with this supply/demand indicator. It appears it may have been developed with Online Trading Academy's "program" in mind. (A very expensive course that didn't help me) The idea that a drop base drop or a rally base rally equates into a S/D zone is silly. These same DBD RBR can and often are developed by price imbalances. I even heard the proverbial "don't diddle in the middle" saying that runs rampant through the $$ OTA course. Nevertheless, this indicator carries with it the idea that these S/D pointed out by the indicator could be areas where Bank Institution left orders. The same sentiment taught by OTA. I have used the indicator and I have yet to have the "Big Banks" helping my trades. The key pad should be memorized because you depend upon the alphabet to learn how to use the indicator. Too many bells and whistles. I gave it a three because it does provide Supply/Demand levels, but nothing more than other indicators.

Jair Miranda
175
Jair Miranda 2017.04.27 05:35 
 

Пользователь не оставил комментарий к оценке

Ответ на отзыв
Версия 4.3 2024.07.02
- Keyboard - Fix Ctrl Click issue
Версия 4.2 2024.04.09
- Keyboard - Fix Ctrl and Shift Click mappings on MT5
Версия 4.1 2024.01.11
- Solo Zones - Use "Zone Line Width 1" when setting SoloZone Line Width
- Keyboard - Fix Ctrl and Shift Click mappings on MT5
- Alerts - Add "Reverse Candle From Zone" alerts
- Alerts - Update parameter names
Версия 4.0 2022.05.12
- Overall Trend - Add "Three In A Row" option to highlight trend when all three timeframe trends align
- Hotkeys - Zone Visibility - With Trend - Hide zones with unknown trend status
- Alerts - Zone Visibility - Alow user to filter visibility independent of the display hotkey setting
Версия 3.9 2022.04.11
- New Alerts - Stop excessive alerts being generated when multiple timeframes are active
Версия 3.8 2022.02.07
- Block invalid alerts that were triggered when broker resets data feed
- Improve level tooltip texts to always include nested info
- Summary Panel - Add parameter Trend Show Consolidation Dots
- Summary Panel - Rename parameter Engulfings - Stop Loss to Engulfings - Viable Size
Версия 3.7 2021.05.05
Enhancements
- Timeframes - Add new timeframe options - Current Plus One / Two / Three
- Profiles - Add parameter "Clear Hotkeys On Terminal Close" to improve profile switching on MT5
- Offline Charts - Add support for offline charts and backtest tools with missing market data and unsynced current time

Fixes
- Summary Panel - Q Points - Improve accuracy of real time updates
- Summary Panel - Q Points - Ensure text is positioned correctly in the center of the box
- Trend Change - Incremental - Check that BarNum >= MinBarsOldZones
- Mouse Events - Keep CHART_EVENT_MOUSE_MOVE enabled if other indicators are waiting on mouse events
Версия 3.6 2021.04.20
Enhancements
- MT5 - Add support for extended timeframes
- Trend Worm - Add option to display Trend Worm and/or Consolidation Worm on the chart
(Due to a platform issue, MT5 users may need to re-attach the indicator to see the Trend Worm)

Performance
- Clear Hotkey - Improve performance of clear chart calls
- Redraw - Remove ObjectsDeleteAll calls that slow other indicators with many objects
Версия 3.5 2021.04.02
Fixes
- Summary SupDem - Apply Filters to SupDem column
- iCustom - Apply Filters to iCustom buffers
- iCustom - Improve Blahtech Expert Advisor Examples
- Alerts - Add MinBarsLevel and PriceAway filters to alerts
- Overall Move - Fix edge case where Overall Move wasn't being calculated correctly
Версия 3.4 2021.03.24
Enhancements
- Enable filters whenever an individual filter is changed in the GUI
- iCustom - Refactor EA code examples into class to support cleaner multiple instances

Fixes
- Summary SupDem - Improve highlighting of overlapped zones
- Consolidations - Fix edge case when near MaxBars
- Allow user to configure Timeframes 1-4 in any order
- Allow experts to operate on higher timeframes than the current chart period
- Change format of diff files to support iCustom development
- Only populate iCustom buffers if they are enabled and used
- Change position of Overall Move filter to the top half of the GUI
Версия 3.3 2021.03.08
Enhancements
- Summary Trend - Display dot next to the trend direction when recent bars are consolidating
- Filters - Add Max Levels filter to allow the user to restrict the number of levels on the chart
- Zone Highlight - Add parameter to change highlighting mode (None/Strength/Untouched)
- Parameters - Write simple list of changed parameters to experts log when Ctrl+Q keys are pressed
- Parameters - Create detailed report of changed parameters in Files/Blahtech directory to assist users and support

Fixes
- Q Points - Add Min Risk Reward parameter
- Trend Change - Add Min Range and rename Min Risk Reward parameters
- Overall Trend Alerts - Print all three timeframe directions in alert message
- Summary SupDem - Improve highlighting accuracy with overlapped zones
- Old Zones - Enable detection of old zones with just two bars
- Consolidation - Fix edge case in consolidation zones detection
- Hotkeys - Revert regression from 3.1 release where [ and ] were swapped round
- Expert Advisor Mode - Change to a single option named "Reserved For iCustom Calls"
Версия 3.2 2021.01.20
Enhancements
- Alerts - Add parameter "Filter Nested (Levels)" to control raising alerts for nested zones only
- Alerts - Add parameter "Trigger Alerts Early" to trigger touch/break alerts N points before the level
- Hotkey Panel - Add "Alerts Nest" button to allow user to modify the nested zone filter from the GUI
- Summary - Alerts panel - Add icon next to title to show "Trigger Early Alerts" points value
- Summary - Alerts panel - Improve alerts icon tooltips
- Touches - Increase accuracy of Touches and add optional Touch/Untouch points parameters
- Info - Add parameter to control the precision of the {lots1} substitution string
- Info - Add a second user custom format string

Fixes
- Alerts - Fix edge case where duplicate alerts could be raised
- Alerts - Remove overlaps from Retouch alerts and apply filters to New alerts
- Alerts - Don't raise alerts for levels hidden from display by the "Zone Visibility" parameter
- Alerts - Improve text format, add bid price and number of touches
- Trend Change - Modify trend change parameter to OVERLAP_ALL to improve consistency of trend reversals
- Summary Panel - Improve accuracy of summary panel when price retraces from touched levels
- Summary Panel - Optimise summary panel redraw to compensate for increased accuracy
- HotKey Panel - Adjust panel Y location when position changed to Bottom left/right
Версия 3.1 2019.10.17
- Enable left mouse click actions on Hotkey panel when keys have been reserved
Версия 3.0 2019.10.09
Enhancements
- Add a third mode to the Summary panel GUI to control all alerts
- Alow user to set individual alert timeframes for Trend, Engulfings, QPoints and Levels
- Allow M30,H4,D1 as well as 1,2,3 when setting alerts timeframe parameters
- Enable Summary Timeframe Bubble Numbers by default
- Add bubble numbers to QPoints and SupDem columns in the Summary panel
- Add option to adjust the zone start bar of a level to the begining of a consolidation
- Add Timeframe hints to the TF section of the Hotkey panel
- Add {lots3} option to Info format

Fixes
- Change default colour of QPoint 2 from MediumOrchid to PaleVoiletRed
- Change Invert Style and colour parameters to be more intuitive
- Change text colour of oversized Q Points on the chart to Gray
- Change Summary heading from TimeF to Time
- Improve the behaviour of the Q Points hotkeys
- Modify all lines drawn by the indicator to be unselectable
- Include first bar in search for max move away of zones and Q Points
- Reset hotkey settings when indicator is removed from chart or chart is closed
- Only call TerminalInfoInteger to get ctrl status when key pressed or object clicked
Версия 2.9 2019.07.16
Fix issue when backtesting beyond Max Bars
Версия 2.8 2019.06.19
Enhancements
- Add options to draw multi timeframe Q Points on the chart
- Add GUI tab within HUD panel for control of filter parameters
- Add extra filters for Nested Levels, Zone Size and Min Price Away
- Change default values for live filters to disabled
- Add option to choose method for Zone Height calculation - Default/Whole Body/Entire Candle
- Add parameters to limit zone height "Zone Height Min" and "Zone Height Max"
- Add iCustom Buffers for QPoint 1 Top Bar and QPoint 1 Bot Bar
- Add option to display Total Move in custom format
- Left clicking any description in the Hud Panel now resets the value back to its input parameter version

Fixes
- Change defaults to display more features on chart at startup
- Check UserTickSize to stop divide by zero error
- Check for empty iCustom buffer
Версия 2.7 2018.05.30
Улучшения
- Возможность отключить выделение сильных зон
- Возможность использовать текущий таймфрейм только для общего тренда
- Параметр, позволяющий изменить угол привязки окна информации
- Добавлена кнопка "Sup/Dem", позволяющая отображать только уровни спроса или предложения
- Добавлен фильтр по количеству повторных касаний
- Добавлен фильтр для уровней, которые были сформированы паттерном "Поглощение"
- Добавлен фильтр по максимальному отдалению цены
- Добавлен фильтр по возрасту старых зон в барах
- Поддержка оповещений об изменениях тренда
- Поддержка оповещений об изменениях общего тренда
Версия 2.5 2017.08.29
Улучшения
- Поддержка оповещений при касании и пробое QPoint
- Поддержка оповещений по 3 таймфреймам
- Поддержка инвертированных стилей зон для мультитаймфреймного отображения
- Запоминание горячих клавиш при перезапуске терминала
- Поддержка вызовов iCustom с более чем 64 параметрами при помощи set-файла

Изменения
- Добавлены всплывающие подсказки в графику вложенных зон
- Добавлен параметр резервирования клавиш для предотвращения конфликтов с другими продуктами
Версия 2.4 2017.07.21
- Перекомпилирован с помощью MetaEditor 1629 для поддержки облака MetaTrader
- Добавлены тултипы для отображения "горячих" клавиш
Версия 2.2 2017.04.06
Улучшения
- Поддержка дополнительных таймфреймов
- Поддержка оповещений для поглощений
- Отрисовка зон со смещением на один бар назад, если там начинается совпадающая линия
- Изменен цвет и шрифт метки QPoints, когда диапазон больше 15x среднего размера
- Отделены старые и активные фильтры для упрощения использования
- Добавлены расширенные буферы iCustom для таймфреймов два и три
- Добавлен второй демонстрационный режим, чтобы показать дополнительные таймфреймы
= Панель информации
- Поддержка скрытия/показа зон при нажатии на значения таймфреймов
- Поддержка изменения фокуса при нажатии на значения QPoint
- Отключено выделение значения QPoint розовым/синим цветом, когда диапазон меньше 15x среднего диапазона
- Изменено выделение значений SupDem, теперь для этого используются только розовый и синий цвета
= Горячие клавиши
- Изменен порядок изменения горячих клавиш при нажатой клавише "Shift"
- Сдвиг начала и конца зоны на один бар вперед при нажатии на клавишу "X"

Исправления
- Запоминание установленного пользователем таймфрейма QPoint при переключении таймфрейма графика
- Исправлен расчет среднего значения бара, чтобы соответствовать значениям версии 1.0 (регрессионная ошибка)
- Перекомпилирован в соответствии с новейшими изменениями платформы MetaTrader
- Все глобальные переменные изменены на постоянные выражения
Версия 2.1 2017.01.19
- Исправлен вызов iCustom
- Уменьшен максимум каждого тика для оптимизации быстродействия советника
- Добавлен режим советника для пропуска создания и отображения объектов