WPR Dashboard MT5
- Индикаторы
- The Huy Phan
- Версия: 3.0
- Обновлено: 15 ноября 2024
- Активации: 10
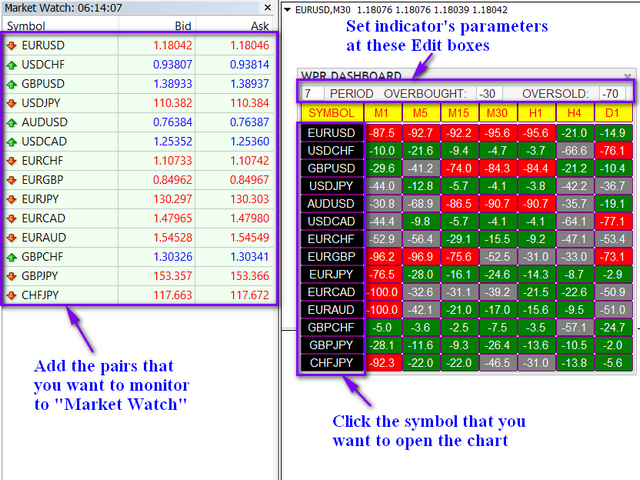
WPR Dashboard uses the value of William's Percent Range indicator. The parameters can be adjusted via the Edit boxes of this dashboard.
The monitoring pairs will be selected by adding to the Market Watch (no need to set prefixes or suffixes), you can monitor many pairs as you like.
This dashboard will check almost popular time frame (M1,M5,M15,M30,H1,H4 and D1). The colors can be customized.
We can have a look at many pairs and many time frames without opening the chart. In addition, we can jump to the chart quickly if we want.