Key Levels of Support and Resistance
- Göstergeler
- Pavel Verveyko
- Sürüm: 1.2
- Güncellendi: 24 Aralık 2020
- Etkinleştirmeler: 5
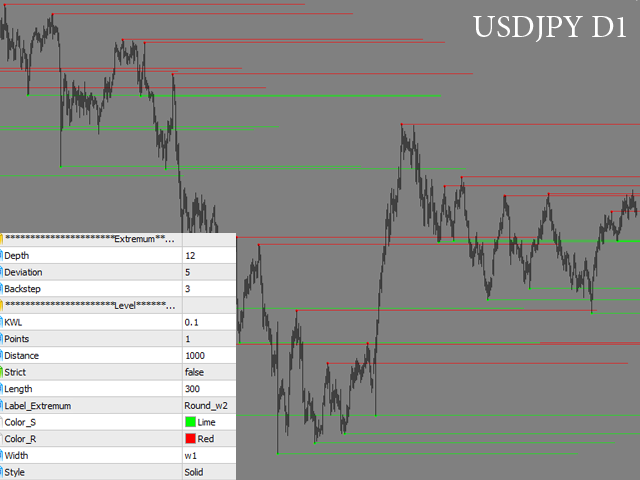
The indicator displays the key support and resistance levels on the chart.
The significance of these levels lies in that the price may reverse or strengthen the movement when passing such levels, since they are formed as a consequence of the natural reaction of market participants to the price movement, depending on which positions they occupied or did not have time to occupy.
The psychology of the level occurrence: there always those who bought, sold, hesitated to enter or exited early.
If the price bounces off a support level and moves up;
- those who bought regret not buying more and think of increasing the lot if the price returns to the level;
- those who sold realize they mixed the direction and hope the price returns to the level so that they are able to break even;
- those who closed early understand that the price actually goes in "their" direction and think of opening positions again if the price returns to the level;
- those who were uncertain about the direction and hesitated to enter now see where the price goes, but realize that it is too late and the price has already left; they think of opening positions if the price returns to the level.
That is, all interested participants plan to buy with a rollback to the level.
A rollback to the support level area may provoke a new wave of buys and upward price movement.
If the price breaks the level downwards, the opinion of traders will change radically, and the support level will become a resistance level.
A level is a blurred line, a narrow price range.
The significance of the levels is influenced by: the amount of time the level is formed, the number of touches, the height of the range, the activity of the trade when approaching the level. The levels not touched by the price for a long time gradually lose their significance. Some levels start working again after a breakout or when the price has not tested them for a long time, while they are supposed to be forgotten long ago.
When working with the levels, the following signals are used:
- rebound from a level,
- level breakout,
- rebound from the opposite side a level after a breakout.
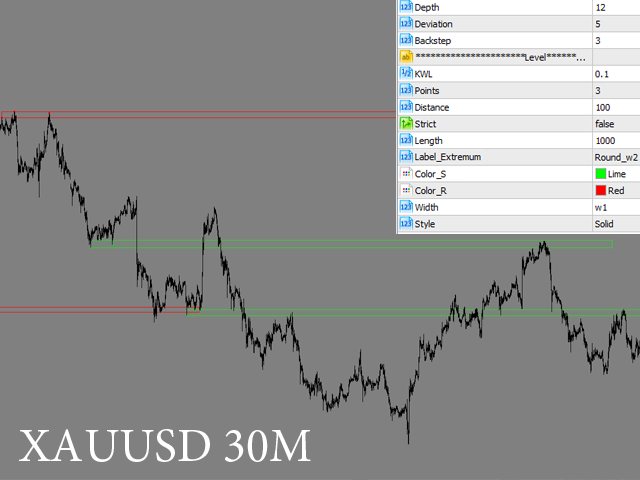
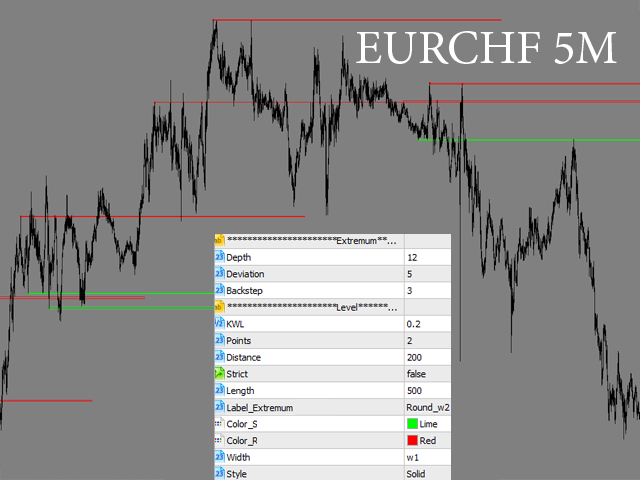
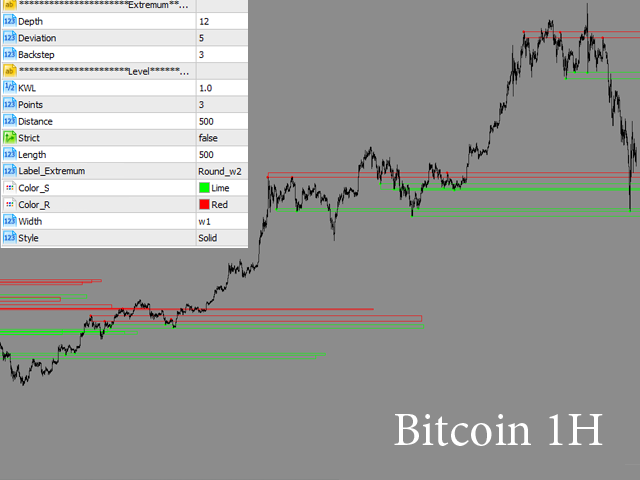
The indicator can be used on any timeframe, on the stock, commodity and currency markets.
It can be used for long-term, medium-term and short-term trading.
The indicator is not redrawn.
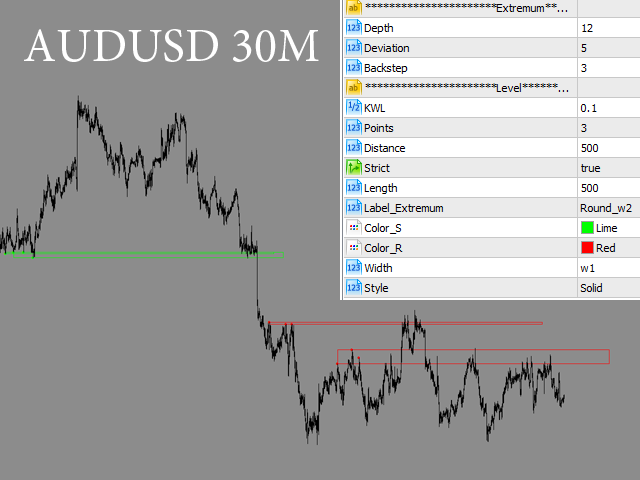
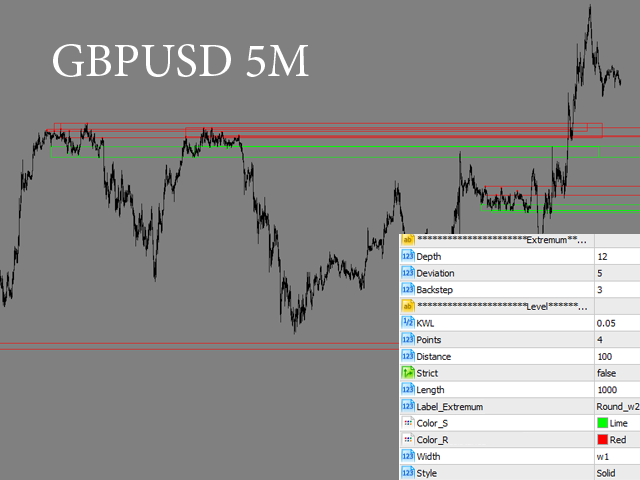
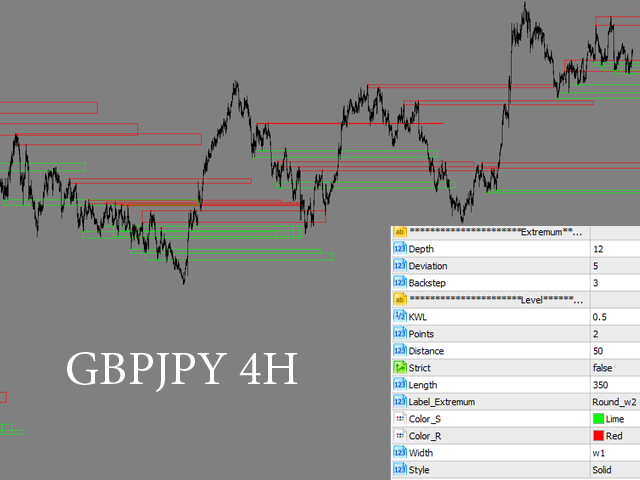
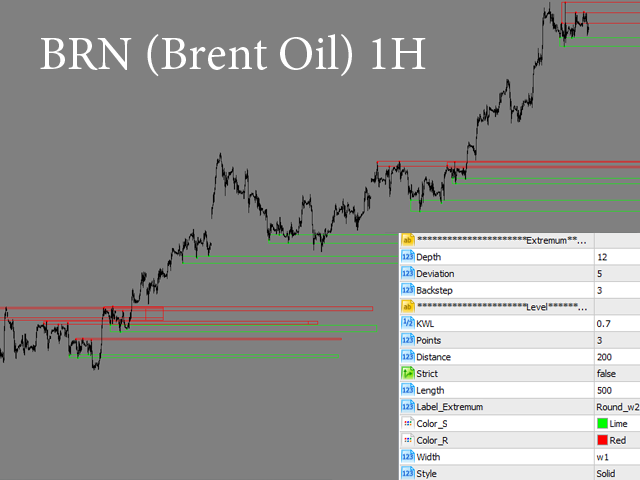
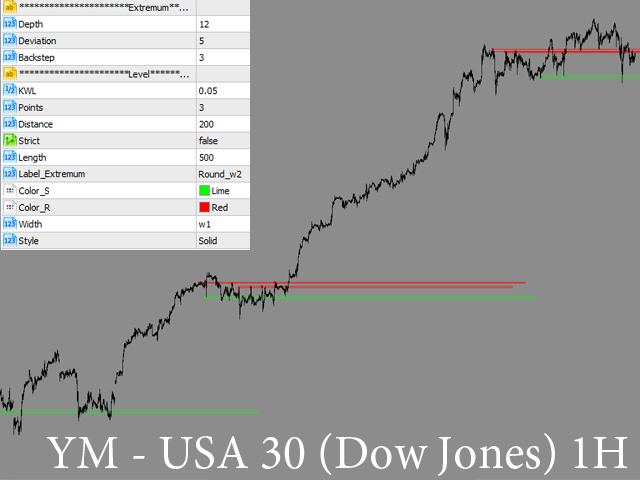
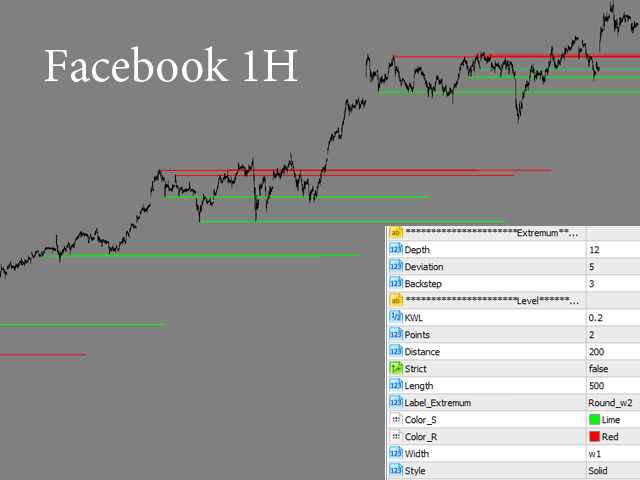
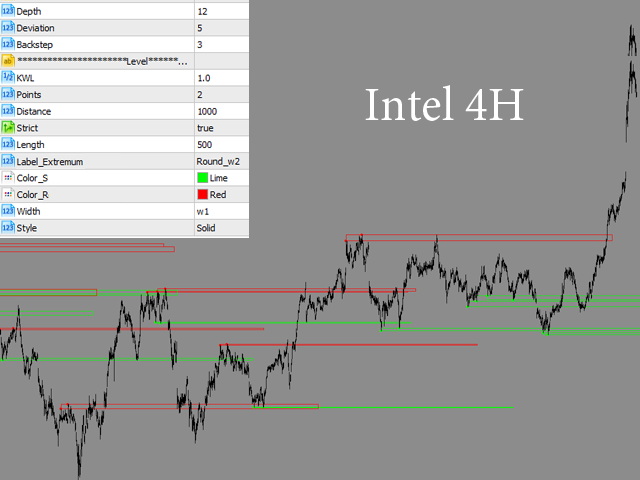
Settings
- History_Size - depth of the calculated history.
- Depth - the minimum number of candles, where a second High or Low cannot be formed if the Deviation parameter is met.
- Deviation - the minimum number of points, expressed as a percentage between the Highs and Lows of two adjacent candles (this parameter is responsible for the extremes used to search for the levels).
- Backstep - the minimum number of candles between the local Highs or Lows (this parameter is responsible for the extremes used to search for the levels).
- KWL - (main parameter) level width ratio (percentage, multiplied by two).
This value will be different for different market types and time periods, as it depends on the range of the price fluctuations on the chart.
For example: in Forex, this can be 0.001 on the minute chart and 0.1 on the daily chart.
For stocks (for example: Google), it can be 0.01 on the minute chart and 1.0 on the daily chart. - Points - (main parameter) the number of points (extremums) required to plot a level.
- Distance - (main parameter) the maximum distance (expressed in the number of candles) between the points (extremums) used to plot a level.
- Strict - (main parameter) strict approach to the formation of levels (the levels are not broken by the price during the formation).
- Length - extend the levels to the right by "x" candles.
- Label_Extremum - type of the extremum labels and their size.
- Color_S - color of the support levels.
- Color_R - color of the resistance levels.
- Width - thickness of the level lines.
- Style - style of the level lines.
Kullanıcı incelemeye herhangi bir yorum bırakmadı