• 概述
  • 评论
  • 评论

Buy Sell Volume

Buy/Sell Volume Indicator with Pair Divergence for MT5 

version "1.1"

Description

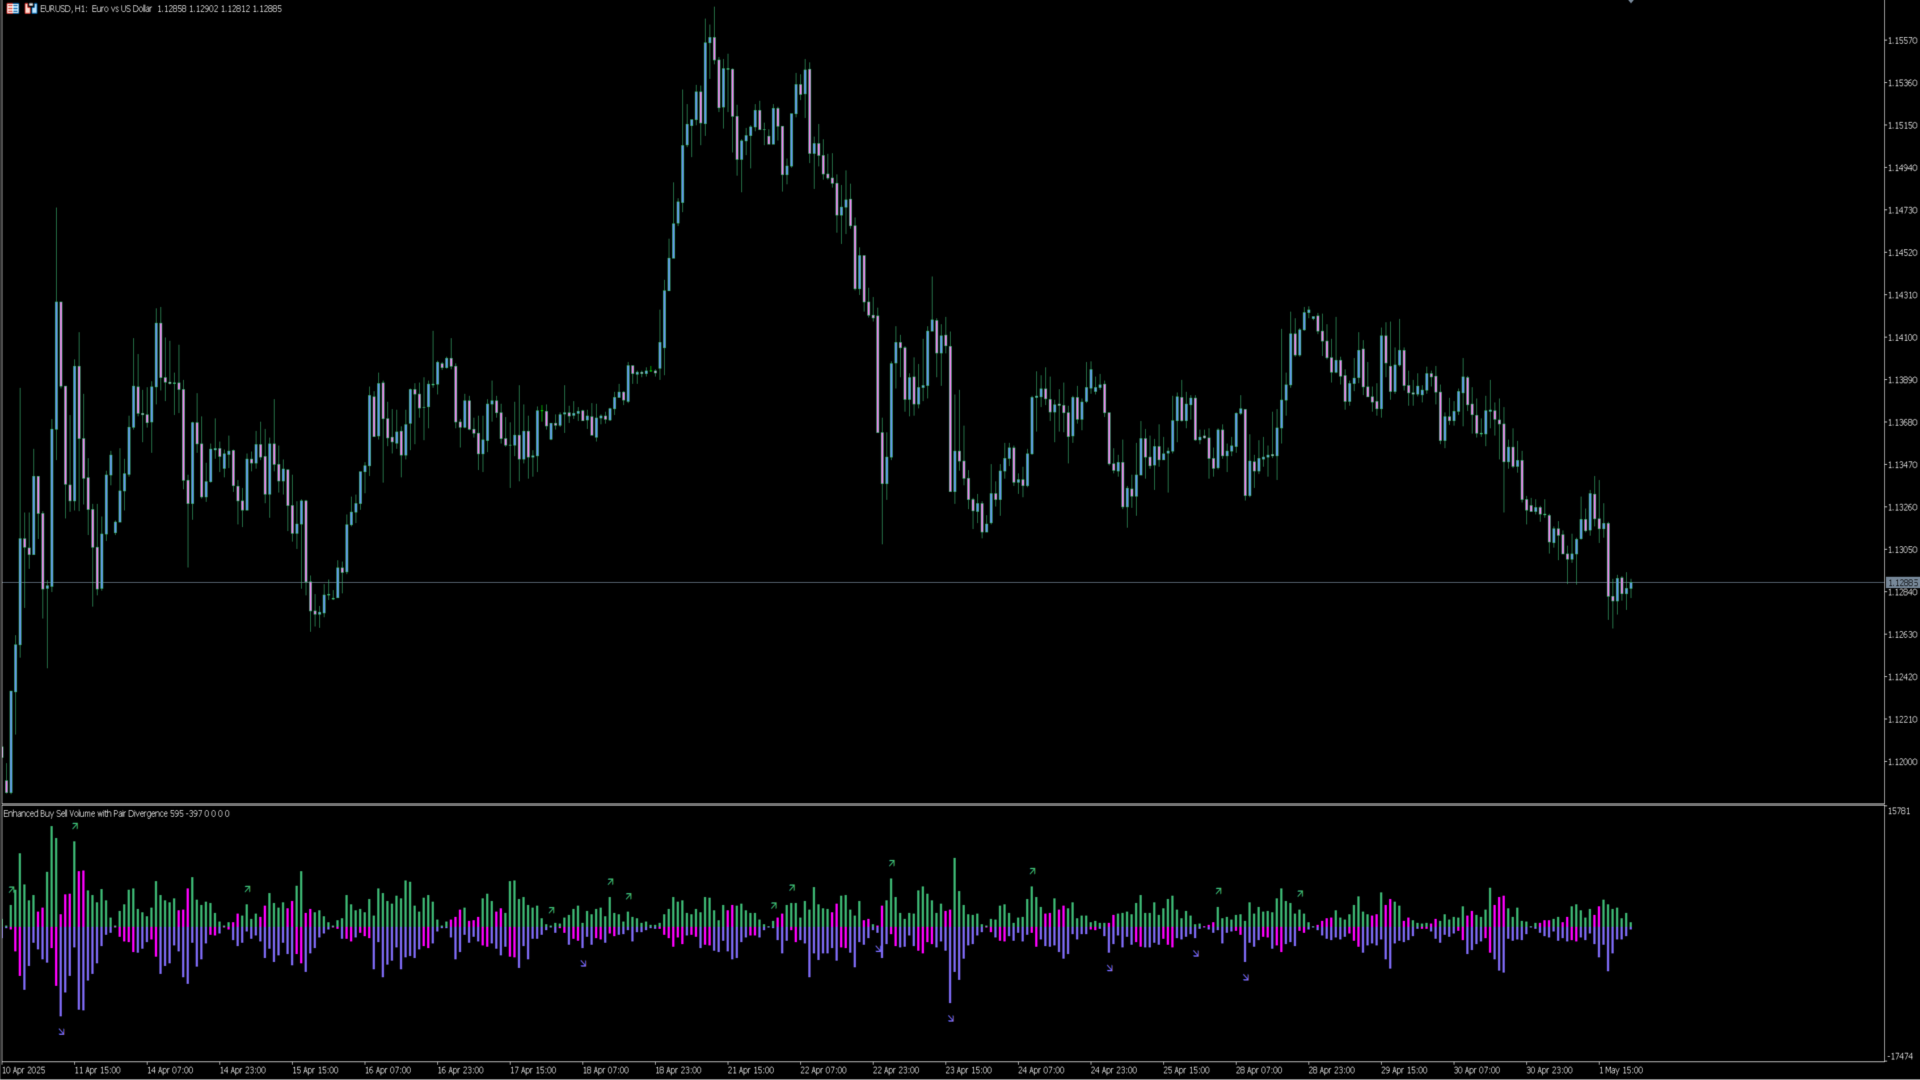
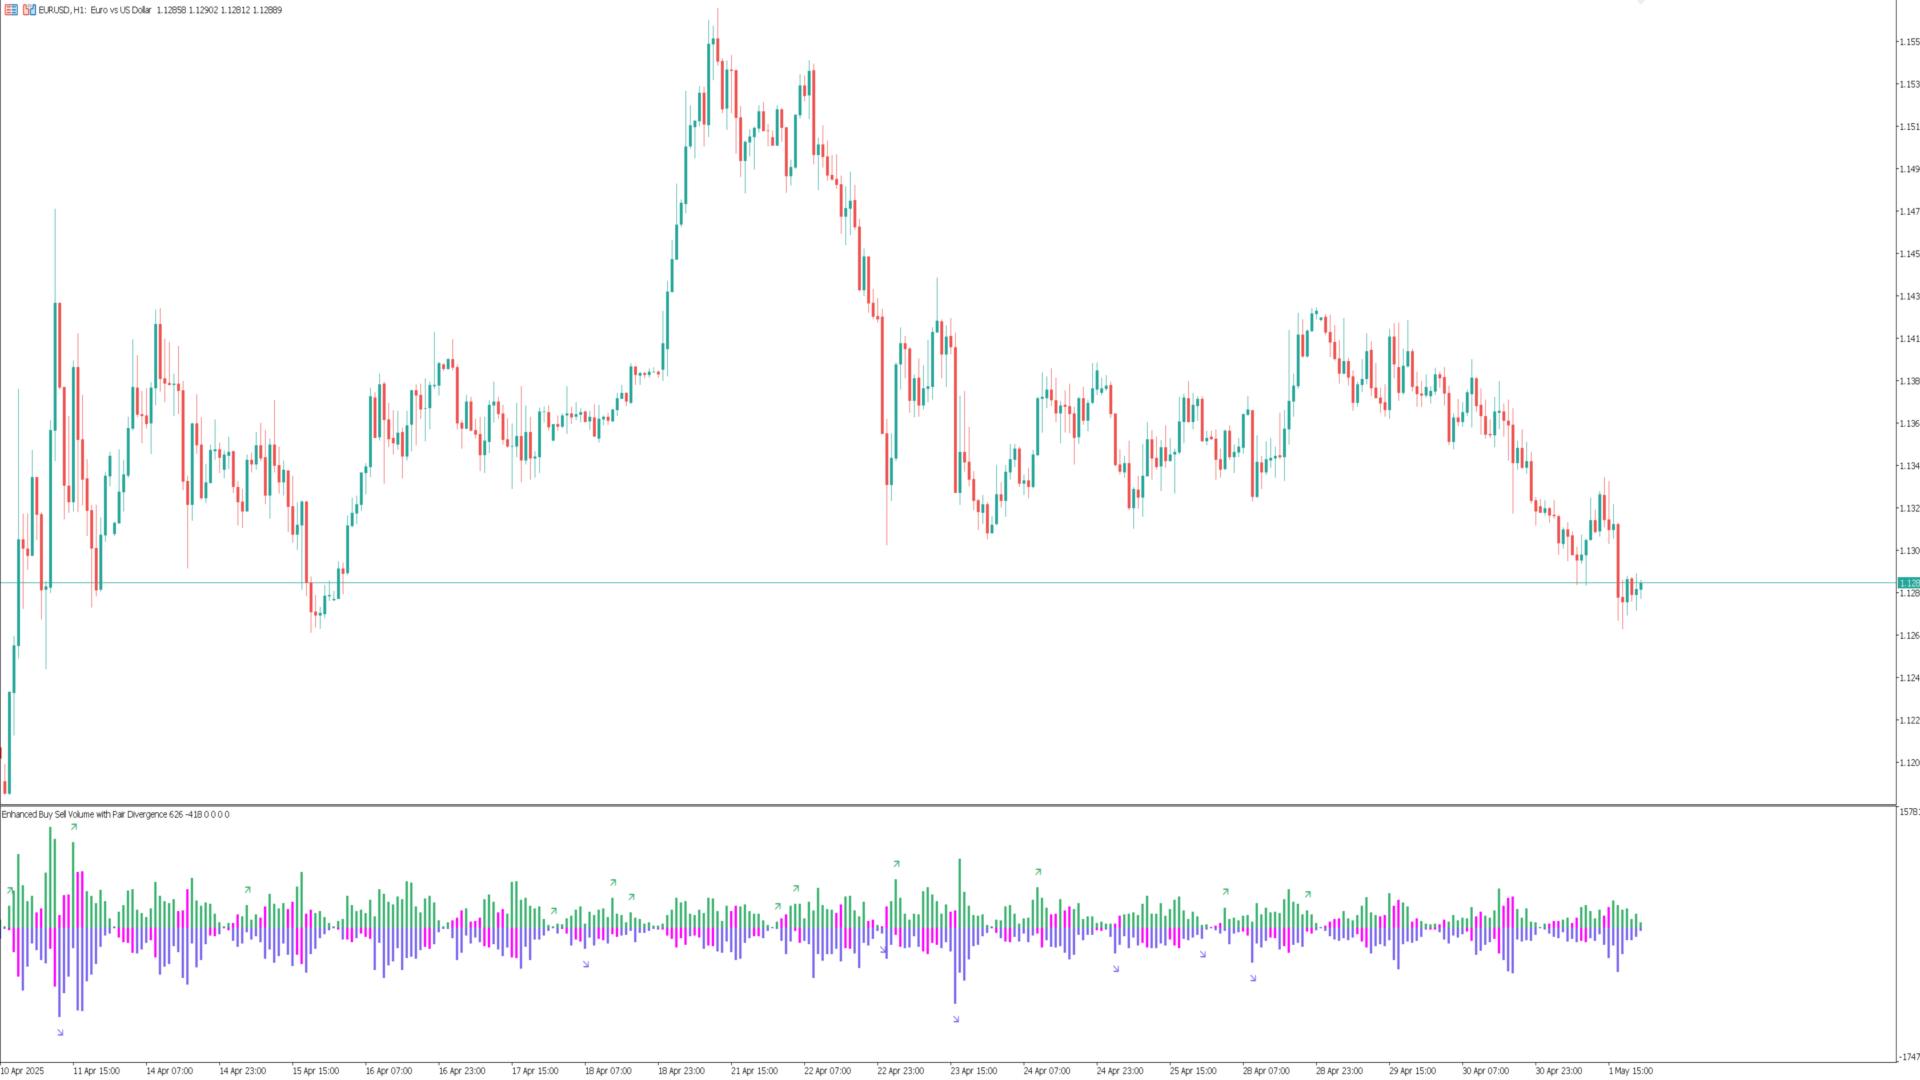
The Enhanced Buy/Sell Volume Indicator is a custom technical indicator designed for MetaTrader 5 (MT5) to analyze and visualize buy and sell tick volumes in a separate window. It provides traders with insights into market dynamics by highlighting volume dominance, balance, and divergence patterns. The indicator uses tick volume data to estimate buying and selling pressure, offering a detailed view of market sentiment and potential reversals.

Key Features and Capabilities

  1. Buy and Sell Volume Visualization:
    • Displays buy and sell volumes as histograms in a separate indicator window.
    • Buy volumes are shown as positive histograms, and sell volumes as negative histograms, making it easy to compare their relative strength.
    • Customizable histogram width and colors for buy (default: MediumSeaGreen) and sell (default: MediumSlateBlue) volumes.
  2. Dominance Detection:
    • Identifies periods of significant buying or selling dominance when the volume of one side exceeds a user-defined threshold (default: 80%).
    • Dominant bars are marked with arrows (colored red by default) above or below the histogram for closed candles, indicating strong market direction.
  3. Balance Analysis:
    • Detects periods of market balance where buy and sell volumes are closely matched, based on deviation from a moving average of buy volume percentage.
    • A user-defined balance threshold (default: 5%) determines when volumes are considered balanced.
    • Balanced bars are highlighted with a distinct histogram color (default: Orange), signaling potential consolidation or indecision.
  4. Pair Divergence Detection:
    • Identifies bullish and bearish divergences between price movements and volume trends:
      • Bullish Divergence: Occurs when the price falls or stagnates (close ≤ open) while buy volume increases, suggesting potential upward reversal.
      • Bearish Divergence: Occurs when the price rises or stagnates (close ≥ open) while sell volume increases, indicating potential downward reversal.
    • Divergent bars (current and previous) are highlighted with a unique color (default: Yellow) to emphasize these patterns.
  5. Dynamic Scaling:
    • Automatically adjusts the indicator’s vertical scale based on the maximum and minimum volume values over a user-defined period (default: 800 bars).
    • A scale multiplier (default: 1.2) ensures sufficient visual space for volume fluctuations, preventing the histogram from appearing cramped.
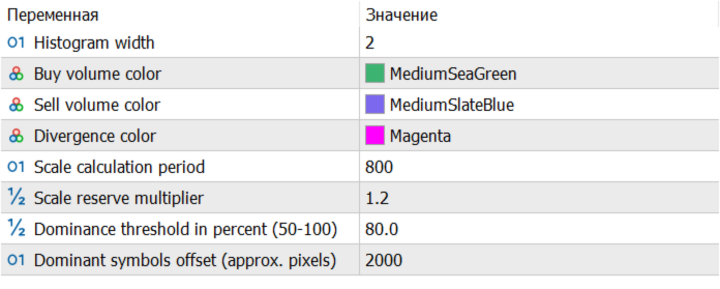
  6. Customizable Parameters:
    • Histogram Width: Adjust the thickness of histogram bars (default: 2).
    • Scale Period: Set the lookback period for dynamic scaling (default: 800).
    • Scale Multiplier: Control the vertical range of the indicator window (default: 1.2).
    • Dominance Threshold: Define the percentage threshold for dominance detection (default: 80%).
    • Balance Period: Set the period for calculating the moving average of buy volume percentage (default: 40).
    • Balance Threshold: Specify the maximum deviation for balance detection (default: 5%).
    • Colors: Customize colors for buy/sell volumes, dominance markers, balance histograms, and divergence highlights.

How It Works

  • Volume Calculation: The indicator estimates buy and sell volumes based on tick volume and price movement:
    • If the price range (high - low) is zero, volumes are split equally (50/50).
    • For upward price movement (close > open), buy volume is weighted higher (60-90% based on the price change relative to the range).
    • For downward price movement (close < open), sell volume is weighted higher.
    • If the price is unchanged (close = open), volumes are split equally.
  • Dominance: Calculated as the percentage of buy or sell volume relative to total volume, with markers added when exceeding the threshold.
  • Balance: Compares the current buy volume percentage to its moving average over the balance period, marking bars where deviation is minimal.
  • Divergence: Analyzes price and volume trends between consecutive bars to detect mismatches that may indicate reversals.
  • Scaling: Adjusts the indicator window’s range dynamically to ensure clear visualization of volume data.

Use Cases

  • Trend Confirmation: Use dominance markers to confirm strong buying or selling pressure in trending markets.
  • Reversal Signals: Identify potential reversals through bullish or bearish divergence patterns.
  • Consolidation Detection: Spot periods of market indecision with balance highlights, useful for range-bound strategies.
  • Volume Analysis: Gain insights into market sentiment by comparing buy and sell volume strengths.

Practical Notes

  • The indicator works best on instruments with high tick volume data, such as forex pairs or major indices.
  • Divergence signals are most reliable when confirmed with other technical tools (e.g., support/resistance levels, RSI).
  • Adjust input parameters to suit specific timeframes or trading styles (e.g., shorter balance periods for scalping).
  • The indicator only places dominance markers on closed candles to avoid repainting.

Limitations

  • Relies on tick volume, which may not reflect actual traded volume in some markets.
  • Divergence detection is based on a simple two-bar comparison, which may require additional confirmation.
  • Performance may vary on low-liquidity instruments or during low-volume periods.

This indicator is a powerful tool for traders seeking to understand volume-driven market dynamics, offering a blend of volume analysis, dominance detection, balance identification, and divergence signals in a single, customizable package.


推荐产品
The VWAP indicator is our version of the popular Volume-Weighted Average Price indicator. The VWAP is the ratio between the value traded (price multiplied by the number of volume traded) and the total volume traded over a specific time period. As a result, it measures the average price of the instrument much better than the simple moving average. Although there are many ways to use the VWAP, most investors use it to calculate the daily average.  The indicator works in five modes: Moving  - In
The Volume+ and VSA Signals indicator for MT5 is based on the Volume Spread Analysis (VSA) methodology to provide the signals. The signals are displayed at closing of bars on the main window or subwindow in the form of symbols. The symbols are not repainting.  The indicator produces a signal on an individual bar and this signal is not buy or sell signal. When a minor trend goes in the opposite direction of a major trend, there are sequences of major trend-following signals that give a higher pro
重要通知 – 需进行许可证和激活 激活说明: 完成购买后,请立即联系我们以获取您的许可证密钥、密码或激活详情。如果没有这些,软件将无法运行。我们将确保激活过程顺畅,并协助您解答任何问题。 多语言定制 为了提升您的交易体验,我们提供软件的多语言完整定制服务。我们的团队可以提供以下语言的翻译: 中文 | 法语 | 葡萄牙语 | 西班牙语 | 俄语 日语 | 德语 | 韩语 | 意大利语 | 土耳其语 只需告知我们您偏好的语言,我们将定制指标,确保提供用户友好的体验。 MT5市场轮廓指标 – 高级拍卖市场分析 市场轮廓是一种强大的图表工具,使交易者能够观察驱动所有市场运动的双向拍卖过程。它可视化了价格随时间的变化,揭示了群体行为和价格接受区域的关键模式。 本质上,市场轮廓是一个动态图形,持续记录和组织拍卖数据,帮助交易者精确地确定关键市场水平。 主要功能与概念 价值区域(VA) – 识别真正的市场平衡 价值区域表示包含一天交易活动中68%或70%(可调整)的价格范围,相当于价格分布的一个标准差。该区域突出显示了大部分交
SimSim Arrow ADX 是一個標準的「平均方向運動指數」指標,但採用箭頭版本。 MetaTrader 4 版本 指標參數與標準類似。 啟用「控制交易」進行操作,將自動開啟基於指標訊號的交易。 您可以將指示器用作其預期用途,作為可靠的信號設備。 然而,它的次要目的是作為“ CONTROL DEAL ”實用程式的信號提供者。 指標與該實用程式之間的共生使您不僅可以看到訊號,還可以根據它進行交易。 如果您想有效地使用這些訊號,請下載免費實用程式: SimSim Control Deal MT5 。 「 SimSim ARROW 」系列指標的訊號以其明顯性和清晰度吸引了交易者,這使得它們比顧問更具吸引力。當箭頭出現時,指標的視覺清晰度就會顯現出來這正是開啟交易的時刻!相反,當使用顧問時,事件通常以隱藏的方式展開,交易者並不總是清楚為什麼啟動特定操作,因為許多內容仍然隱藏在演算法的幕後。在這些指標中一切都是透明和可訪問的!您可以單獨或組合使用這些指標,這為分析開啟了新的視野。指標選項提供了多種下載,其可能性無窮無盡。沒有任何限制可以阻擋您的成功,因為您可以同時使用數百個指標
UPD1 Profile Levels MT5
Vitaliy Kuznetsov
5 (3)
该指标在指定柱数的工作直方图上找到最大和最低价格量(市场概况)的水平。   复合型材 。 柱状图的高度是全自动的,并适应任何仪器和时间框架。 作者的算法被使用,并且不重复众所周知的类似物。 两个直方图的高度近似等于蜡烛的平均高度。 智能警报将帮助您了解有关交易量水平的价格。 概念Smart Money 。 Low Volume - Imbalance. 用于寻找良好的市场环境,确定市场结构并作为二元期权的过滤器。 它是价格的磁铁。 High Volume - Liquidity. 用于退出累积时的测试。 输入参数 。 基本 。 Bars Count - 要计数和显示的条数 。 Signal Fractal = 5 (对于颜色信号电平)。 水平将在以下条件下成为信号:顶部和底部有五个直方图不超过它 。 Min Candles For High Volume Level - 在水平蜡烛的最小数量,以便它可以成为一个信号 。 按钮设置 。 Visual Button - 按钮显示(启用/禁用) 。 Corner - 按钮的卡角 。 X indent - 以像素为单位的水平偏移量 。
KT Volume Profile MT5
KEENBASE SOFTWARE SOLUTIONS
KT Volume Profile 将交易量堆积数据显示为纵轴上的柱状图,使交易者能够分析特定时间段和价格水平的市场活跃度。该指标非常适合识别市场中最重要的交易区域和支撑/阻力水平。 成交量轮廓中的控制点 (POC) POC 是成交量轮廓中交易量最多的价格水平。它通常被视为关键支撑/阻力位或市场在选择方向前经常回测的重要价位。 功能特点 使用非常简单,只需将矩形拖放到图表上的任意位置,即可实时更新成交量轮廓数据。 当价格突破 POC 时可触发提醒。 从零开始编码,最大限度地优化 CPU 和内存资源的使用。 输入参数 成交量来源:   按Tick成交量 / 实际成交量。 轮廓柱状图颜色:   设定柱状图的颜色。 轮廓矩形宽度:   设置矩形框的宽度。 矩形颜色:   设置框体的颜色。 显示控制点 (POC):   true/false POC 颜色:   控制点的颜色。 POC 样式:   控制点的线条样式。 POC 宽度:   控制点的线条粗细。 提醒设置:   参数简单明了。 实际成交量 vs Tick成交量 由于外汇市场是去中心化的,散户交易者很难获得真实的成交量数据。如果
Volume Profile DD 1B
OBARE PAUL OTIENO
重要通知 – 需要许可证和激活 激活说明: 完成购买后,请立即联系我们以获取您的许可证密钥、密码或激活详情。没有这些,软件将无法运行。我们将确保激活过程顺利进行,并随时为您解答任何疑问。 多语言定制 为了提升您的交易体验,我们提供软件的多语言完整定制服务。我们的团队可以提供以下语言的翻译: 中文 | 法语 | 葡萄牙语 | 西班牙语 | 俄语 日语 | 德语 | 韩语 | 意大利语 | 土耳其语 只需告诉我们您偏好的语言,我们将定制指标,确保为您提供用户友好的体验。 成交量分布 – 高级市场分析工具 成交量分布是一个复杂的分析工具,旨在为交易者提供对市场动态的深入洞察。它捕捉价格随时间的变化,提供实时图形化的拍卖数据表示,揭示影响价格变动的集体行为模式。 其核心是 价值区域 (Value Area) ,代表包含当天68%交易活动的价格范围。这一区域与标准差对齐,突出显示大多数交易发生的区域。 主要功能: 成交量控制点 (VPOC): 识别在指定时间内交易量最高的价格水平,作为公平价格。 价值
Volume Profile V6
Andrey Kolesnik
4.5 (2)
市场的成交量曲线指标+一个智能振荡器. 它适用于几乎所有工具-货币对,股票,期货,加密货币,实际交易量和报价。 您可以设置配置文件范围的自动定义,例如,一周或一个月等。,并通过移动边界(两条垂直线红色和蓝色)手动设置范围。 示为直方图。 此级别直方图的宽度有条件地意味着在其上进行的交易数量。 通过"模式水平线颜色"参数,您可以设置自动显示价格可能会击退的最重要交易量水平,而最大颜色参数则分别显示整个设定范围内最大交易量的水平。 智能振荡器显示超买和超卖区域,它分析来自多个指标的信息,并根据处理的数据,以适当的颜色为超买和超卖区域着色。 该指标非常简单易用,同时尽可能提供信息。 有了这个指标,做市商将无法向您隐藏其购买或销售。 成千上万的用户已经下载了这个产品,没有一个负面的评论。 其他有用的免費和付費產品可以在這裡查看: https ://www.mql5.com/en/users/raprofit/seller 選項: 範圍 描述 範圍模式 指定範圍限制的方法: 行間——兩行之間 最後分鐘 - 最後 RangeMinutes 分鐘 Minitues to line - Range
Advanced Volume Profile Analysis Tool for MetaTrader 5 The Kecia Volume Profile Order Finder provides traders with volume profile analysis capabilities. This MT5 indicator combines volume profile visualization with statistical calculations to help identify potential trading opportunities and suggests entry, stop loss, and take profit levels based on market structure. Market Profile Visualization Transform your chart with customizable volume profile visualizations: Multiple visualization options
CVD SmoothFlow Pro
Thalles Nascimento De Carvalho
CVD SmoothFlow Pro - 适用于任何资产的无限量分析! CVD SmoothFlow Pro 是寻求精确和无限量分析的交易者的终极解决方案。该专业版利用累计成交量 delta (CVD) 并结合高级噪声过滤,为交易任何金融资产提供所需的灵活性和精确度。 CVD SmoothFlow Pro 提供了什么? 清晰分析 :过滤市场噪声,突显任何金融资产中的重要成交量变动。 ️ 精确计算 :监测买卖差异,提供外汇、指数、加密货币等资产的成交量行为的详细视图。 直观界面 :提供易于理解和高效的分析,数据呈现清晰明了。 趋势识别 :更自信地识别市场趋势,帮助做出明智决策。 实际应用: 实时监测任何资产中买卖双方的平衡。 基于成交量识别趋势反转。 精确过滤,关注外汇、指数、加密货币等资产中的重要变动。 无限制的专业版! 专业版提供无限制的所有功能访问权限,让您能够对任何金融资产进行详细和无限量的分析。
VolumeDeltaBars
Stanislav Korotky
This indicator is a conventional analytical tool for tick volumes changes. It calculates tick volumes for buys and sells separately, and their delta on every bar, and displays volumes by price clusters (cells) within a specified bar (usually the latest one). The algorithm used internally is the same as in the indicator VolumeDeltaMT5 , but results are shown as cumulative volume delta bars (candlesticks). Analogous indicator for MetaTrader 4 exists - CumulativeDeltaBars . This is a limited substi
The Accumulation and Distribution indicator is a volume-based indicator that was essentially designed to measure underlying supply and demand. This is accomplished by trying to determine whether traders are actually accumulating (buying) or distributing (selling). This is accomplished by plotting a cumulative total of the money flow volume for each period. This indicator can reveal divergences between volume flow and actual price to primarily affirm a current trend or to anticipate a future reve
Color Histogram Volume Set
Ricardo Almeida Branco
Do you use volume in your reading of the market? Certainly many traders use it, and do not imagine operating without it. The Color Histogram Volume Set indicator allows the user to choose the value that he considers interesting to monitor. When you pass this you will have visual confirmation and if you want you will also have the audible alert that is given by the indicator. Of course, there are other ways to try to find a high volume, such as assessing whether the volume is above av
Volumes Direction MT5
William Oswaldo Mayorga Urduy
卷方向 MT5 通常,当当前音量高于前一音量时,音量指示器具有默认的颜色变化,这很重要但不是很有用。 出于这个原因,这个指标的创建是为了除了正常的交易量之外,当蜡烛看涨或看跌时,它会为它们绘制不同的颜色,默认情况下看涨的蓝色和看跌的红色,但这些颜色可以定制为 商人的味道。 不要忘记查看我的其他指标,它们将帮助您改善交易。 卷方向 MT5 通常,当当前音量高于前一音量时,音量指示器具有默认的颜色变化,这很重要但不是很有用。 出于这个原因,这个指标的创建是为了除了正常的交易量之外,当蜡烛看涨或看跌时,它会为它们绘制不同的颜色,默认情况下看涨的蓝色和看跌的红色,但这些颜色可以定制为 商人的味道。 不要忘记查看我的其他指标,它们将帮助您改善交易。
SimSim Arrow Momentum 是一個標準的「動量」指標,但採用箭頭版本。 MetaTrader 4 版本 指標參數與標準參數類似,另外還增加一個參數 Delta。 Delta = 0 - 100 相對於 100 值的偏差。改變 100 指標的水平,可以加法或減量。 當價格穿過水平線 = 100 +- Delta 時,指標會產生訊號。 啟用「控制交易」進行操作,將自動開啟基於指標訊號的交易。 您可以將指示器用作其預期用途,作為可靠的信號設備。 然而,它的次要目的是作為“ CONTROL DEAL ”實用程式的信號提供者。 指標與該實用程式之間的共生使您不僅可以看到訊號,還可以根據它進行交易。 如果您想有效地使用這些訊號,請下載免費實用程式: SimSim Control Deal MT5 。 「SimSim ARROW」系列指標的訊號以其明顯性和清晰度吸引了交易者,這使得它們比顧問更具吸引力。當箭頭出現時,指標的視覺清晰度就會顯現出來這正是開啟交易的時刻!相反,當使用顧問時,事件通常以隱藏的方式展開,交易者並不總是清楚為什麼啟動特定操作,因為許多內容仍然隱藏在演算法
PivotWave
Jeffrey Quiatchon
Introducing PivotWave – your ultimate trading companion that redefines precision and market analysis. Designed with traders in mind, PivotWave is more than just an indicator; it’s a powerful tool that captures the pulse of the market, identifying key turning points and trends with pinpoint accuracy. PivotWave leverages advanced algorithms to provide clear visual signals for optimal entry and exit points, making it easier for traders to navigate volatile market conditions. Whether you are a begin
Wapv Price and volume
Eduardo Da Costa Custodio Santos
本指标可以让您享受两个最流行的产品来分析在感兴趣的价位的请求量和市场成交量: 真实市场深度图表 真实报价足迹成交量图表 本产品结合两个指标的效力,并以单个文件提供。 反危机出售。今日低价。赶紧! 真实的 COMBO 市场深度功能和报价成交量图表,完全等同于原始指标。您将享受这两款产品结合为单一超级指标的力量!下面是您将得到的功能: 真实市场深度图表 股民专用工具现已在 MetaTrader 5 上可用。 真实市场深度图表 指标在图表上以直方条的形式显示可视化的市场深度,并在实时模式下刷新。 利用 真实市场深度图表 指标您可以正确评估市场请求并从图表上看到大的市场。这可以 100% 的精确剥头皮和设置持仓止损。 指标以两种相应颜色的水平直方条形式显示买和卖的请求 (买-卖)。价格图表上给定级别的显示条和它们的长度与请求的交易量相应。此外, 它指示买卖请求的最大交易量。 此指标显示买卖请求总数量作为堆积面积图。这可以评估当经过下一价位时将会执行的请求总量。买卖请求总数量也显示在图表上。 省缺, 指标显示在图表背景上, 且它不会干扰任何其它指标。当使用指标交易时, 建议使用实际交易量。 本
Total Volume Profile
Shahabeddin Baset
Includes almost all the concepts related to Volume Profile: POC , Value Area , Developing POC , Anchored VWAP , Volume Delta ; since the “Total” in its name. It is fast in its calculations and simple to work with. Features: 1.    Selectable calculation timeframe to find most traded levels. 2.    Capable of calculating Volume Profile based on tick data 3.    Adjustable histogram bars by their count. 4.    Adjustable histogram bars by their height (price range). 5.    Showing Value Area (VA
BoxChart MT5
Evgeny Shevtsov
5 (7)
The market is unfair if only because 10% of participants manage 90% of funds. An ordinary trader has slim changes to stand against these "vultures". This problem can be solved. You just need to be among these 10%, learn to predict their intentions and move with them. Volume is the only preemptive factor that faultlessly works on any timeframe and symbol. First, the volume appears and is accumulated, and only then the price moves. The price moves from one volume to another. Areas of volume accumu
Market Marker MT5
Evgeny Shevtsov
3.8 (5)
The indicator displays peak levels of activity formed by the maximum volume, tracks the correlation of the candles on all timeframes (from the highest to the lowest one). Each volume level is a kind of key trading activity. The most important cluster is inside a month, week, day, hour, etc. Indicator operation features A volume level receives Demand status if the nearest volume level located to the left and above has been broken upwards. A volume level receives Supply status if the nearest volu
Segmented Volume MT5
Eduardo Da Costa Custodio Santos
Normalized OBV
Jose Miguel Soriano
When looking at the information of On Balance Volume indicator, a question arises: is it a strong or weak movement? Should it be compared with previous days? These data should be normalized to always have a reference. This indicator presents the followings parameters: Normalization period (Max-Mins absolute) Smoothing period (-1 off) Tick/Real Volume Maximum number of bars to calculate (-1 off) Upper value normalization Lower value normalization Calculation: normOBV = (value - absMin) * (relMax
Blahtech Market Profile MT5
Blahtech Limited
5 (10)
Was: $249  Now: $149   Market Profile defines a number of day types that can help the trader to determine market behaviour. A key feature is the Value Area, representing the range of price action where 70% of trading took place. Understanding the Value Area can give traders valuable insight into market direction and establish the higher odds trade. It is an excellent addition to any system you may be using. Inspired by Jim Dalton’s book “Mind Over Markets”, this indicator is designed to suit the
BidAsk Balance
Dmitriy Gurenko
The indicator measures and displays the difference in the number of "Bid" and "Ask"  prices changes in the form of digital, analog and graphic indicators. Designed for market research and for determine the moments of position closing during scalping trade with H1 or less timeframe. Use with bigger timeframe is not prohibited, but it is not informative because of a large number of accumulated values. Theory "Bid" and "Ask" prices do not change simultaneously for most symbols. Often you can see ho
RSI Dashboard  uses the value of Relative Strength Index indicator. The parameters can be adjusted via the Edit boxes of this dashboard. The monitoring pairs will be selected by adding to the Market Watch (no need to set  prefixes or suffixes) , you can monitor many pairs as you like. This dashboard will check almost popular time frame (M1,M5,M15,M30,H1,H4 and D1). The colors can be customized. We can have a look at many pairs and many time frames without opening the chart. In addition, we can
Quantum Tick Volumes Indicator for MT5
QUANTUM TRADING SOFTWARE LIMITED
5 (1)
Many Forex traders assume there is no volume in the foreign exchange market. And they would be correct. There is no central exchange, not yet anyway. And even if there were, what would it report? What there is however is activity, and this is captured as tick volume. After all, volume is simply displaying activity, the buyers and sellers in the market. So for volume read activity, and for activity read volume – simple. The MT5 platform delivers tick data which the Quantum Tick Volumes indicator
该指标的独特之处在于交易量核算算法:在所选时段内直接进行累积,而无需参考当天的开始。可以从计算中排除最后的柱线,那么当前数据对之前形成的显着水平(交易量)的影响较小。 为了更精确的计算,默认使用 M1 图表中的数据。规范了价格量的分配步骤。默认情况下,显示的右边框设置为用于分析的数据开头对应的栏,但如果需要,可以设置为您需要的栏。显示的音量带的长度(右边界)由系数调节,也可以向左或向右移动到 0(当前)条或参照当前条进行镜像。 参数: Accumulation period -  累积量计算周期 Number of excluded last bars - 从计算中排除的最后一根柱线的数量   Accumulation price step - 按价格参数的成交量总和步骤 Graph length multiplier -  显示数据的长度比例 Use data from timeframe - 用于分析的图表(时间范围) Graph show shift - 开始显示数据的移位,如果留为0,则数据将从分析数据周期开始时间对应的条开始显示; “-1”——显示在左侧; “-2” - 显示
成交量加权 MACD 成交量加权 MACD (VW-MACD) 由 Buff Dormeier 创建,并在他的《使用成交量分析投资》一书中进行了描述。它代表了成交量加权价格趋势的收敛和发散。 包含成交量允许 VW-MACD 通常比传统 MACD 更具响应性和可靠性。   什么是 MACD(移动平均收敛散度)? 移动平均收敛发散由 Gerald Appel 在 1979 年创建。标准 MACD 绘制短期指数平均值和长期指数平均值之间的差异。当差值(MACD 线)为正且上升时,表明价格趋势向上。当 MACD 线为负时,表明价格趋势向下。 计算此差异的平滑指数平均值以形成 MACD 信号线。当MACD线高于MACD信号线时,说明MACD的动能正在上升。同样,当 MACD 低于 MACD 信号线时,MACD 的动能下降。 MACD 线和 MACD 信号线之间的这种差异经常被绘制为直方图,以突出两条线之间的价差。   MACD和大众MACD有什么区别? 成交量加权 MACD 是用两条指数移动平均线来计算 MACD 与两条相应的成交量加权移动平均线的差值。因此,VW-MACD 对
If you like this project, leave a 5 star review. Follow on TikTok: @quantum.trader       [ Any Symbol Can Be ADDED ]       DM me for adding any Pair symbol, crypto, index, stock or anything related. you can also DM me in TikTok [@quantum.trader] Works on [ EURUSD-GBPUSD-GBPJPY-USDJPY-XAUUSD-US30-BTCUSD-ETHUSD-SOLUSD ] This indicator calculate and draw the Prediction or Forecast the peaks of the current day ( forecast high - forecast low - forecast middle - forecast upper q - forecast lower q
该产品的买家也购买
Divergence Bomber
Ihor Otkydach
5 (39)
购买该指标的每位用户将额外免费获得以下内容: 原创工具“Bomber Utility”,该工具会自动跟踪每一笔交易,设置止损和止盈点,并根据策略规则自动平仓; 适用于不同交易品种的指标设置文件(Set 文件); 三种不同风险模式下的 Bomber Utility 设置文件:“最低风险”、“平衡风险” 和 “观望策略”; 一套详细的 视频操作手册,帮助您快速完成安装、配置并开始使用本交易系统。 注意: 要获取以上所有赠品,请通过 MQL5 的私人消息系统联系卖家。 我为您介绍原创的自定义指标 “Divergence Bomber”(背离轰炸机),它是一套基于 MACD 背离交易策略 的“全功能”交易系统。 该技术指标的主要任务是识别 价格与 MACD 指标之间的背离,并发出交易信号(包括推送通知),指示未来价格可能的运动方向。平均而言,这些信号的准确率超过 98%。有关该指标如何工作的详细说明,请观看本页面上的视频演示。 该系统使用 止损订单 和 动态回撤平仓机制 来管理交易。 Divergence Bomber 指标的主要特点: 支持交易的品种: AUDCAD、AUDCHF、AUDSG
Algo Pumping
Ihor Otkydach
4.83 (18)
PUMPING STATION – 您的专属“全包式”交易策略 我们为您推出PUMPING STATION —— 一款革命性的外汇指标,它将使您的交易变得更加有趣且高效。这不仅仅是一个辅助工具,而是一套完整的交易系统,具备强大的算法,帮助您开始更加稳定的交易。 购买本产品,您将免费获得: 专属设置文件:用于自动配置,实现最大化性能。 逐步视频教程:学习如何使用PUMPING STATION策略进行交易。 Pumping Utility:专为PUMPING STATION打造的半自动交易机器人,让交易变得更加方便和简单。 购买后请立即联系我,我将为您提供所有额外资源的访问权限。 PUMPING STATION如何工作: 趋势监控:能够即时识别市场趋势方向。趋势是您最好的朋友。 进场信号:图表上的箭头会提示您何时进场以及交易方向。 明确的交易目标:指标会自动识别最佳的平仓时机。 回调交易:内置的基于布林带的价格通道可检测修正结束并发出新趋势开始的信号。 效率分析:如果当前设置效果较差,系统会自动提示。只需调整PUMPING STATION,即可获得最佳性能。 交易資產:我推薦我親自測試過的
Trend Screener Pro MT5
STE S.S.COMPANY
4.86 (86)
使用趋势筛选指标释放趋势交易的力量:由模糊逻辑和多货币系统提供支持的终极趋势交易解决方案! 使用趋势筛选器(由模糊逻辑提供支持的革命性趋势指标)提升您的趋势交易。 它是一个强大的趋势跟踪指标,结合了超过 13 种高级工具和功能以及 3 种交易策略,使其成为使您的 Metatrader 成为趋势分析器的多功能选择。 限时优惠:趋势筛选指标终身仅需 50 美元。 ( 原价 250$ ) (优惠延长) 体验趋势筛选器 100% 无需重新绘制的准确性,确保您的交易决策不受过去价格变化的影响。 释放多时间框架和多货币功能的多功能性,使您能够以无与伦比的信心在外汇、商品、加密货币和指数领域进行交易。 利用 Trend Screener 的综合策略套件增强您的交易: - 趋势跟踪策略和趋势延续策略 :趋势筛选器的趋势跟踪策略提供清晰的趋势延续信号,让您有效捕捉趋势走势并管理风险。 - 反转策略和早期入场点策略 :趋势筛选器的反转策略可检测市场方向的潜在变化,使您能够预测趋势反转并利用疲弱的市场趋势。通过早期入场点,您可以在潜在的趋势变化之前定位自己 获取可观的利润。 - 倒卖策略: 趋势筛选器的倒卖
Gold Stuff mt5
Vasiliy Strukov
4.93 (187)
Gold Stuff mt5 是专为黄金设计的趋势指标,也可用于任何金融工具。 该指标不会重绘,也不会滞后。 推荐时间框架 H1。 购买后立即联系我以获得设置和个人奖励!   你可以在我的个人资料中找到它。   重要! 购买后立即与我联系,以获得说明和奖金!   您可以免费收到我们的强力支持和趋势扫描指标的副本,请私信。大部头书!   设置 绘制箭头 - 打开关闭。 在图表上绘制箭头。 警报 - 打开关闭声音警报。 电子邮件通知 - 打开关闭。 电子邮件通知。 Puch-notification - 打开关闭。 推送通知。 接下来,调整色域。 Gold Stuff mt5 是专为黄金设计的趋势指标,也可用于任何金融工具。 该指标不会重绘,也不会滞后。 推荐时间框架 H1。 购买后立即联系我以获得设置和个人奖励!   设置 绘制箭头 - 打开关闭。 在图表上绘制箭头。 警报 - 打开关闭声音警报。 电子邮件通知 - 打开关闭。 电子邮件通知。 Puch-notification - 打开关闭。 推送通知。 接下来,调整色域。
*** Entry In The Zone and SMC Multi Timeframe” 是一款基于智能资金概念(SMC)的实时市场分析工具。它有效地集成了反转信号,并通过多时间框架结构检测自动识别关键反转区域,以及识别重要的兴趣点(POI)。此工具旨在帮助交易者以更大的信心和更有结构的方法进行交易决策和规划。*** 功能包括: 自动化市场结构检测(BOS CHoCH)(mBOS mCHoCH) 识别订单区块、供需区和公平价值缺口(FVG) 流动性区、溢价与折扣区域、平高和平低 关键兴趣点(POI) 交易时段(东京、伦敦、纽约) 可定制的仪表板,适应您的独特交易风格 实时操作,无信号重新绘制,全面的多时间框架覆盖,让您做 出更自信的交易决策 ------------------------------------------------------------------------------ 与我们一起进行实时前向测试 :  https://www.youtube.com/@fableedge        教程视频(点击观看):  https://youtu.be/tW
Grabber System MT5
Ihor Otkydach
5 (11)
向您介绍一款优秀的技术指标——Grabber,它是一套即开即用的“全包式”交易策略。 在一个代码中集成了强大的市场技术分析工具、交易信号(箭头)、提醒功能和推送通知。 每位购买该指标的用户还可免费获得以下内容: Grabber辅助工具:用于自动管理已开仓位 视频操作指南:逐步教学如何安装、设置和使用该指标进行交易 原创Set文件:可快速自动配置,帮助实现最佳交易效果 忘掉其他策略吧!只有Grabber能够真正激励你在交易中攀登新高峰! Grabber策略的主要特点: 交易周期:从M5到H4 适用资产:任意,但我推荐我亲自测试过的品种(GBPUSD、GBPCAD、GBPCHF、AUDCAD、AUDUSD、AUDSGD、AUDCHF、NZDUSD、NZDCAD、EURCAD、EURUSD、EURAUD、EURGBP、EURCHF、USDCAD、USDSGD) 交易时间:全天候 24/7 交易效果:我分享自己的真实交易结果,并在此教学如何操作: https://www.mql5.com/ru/market/product/134563?source=Site+Market+MT5+Indic
RelicusRoad Pro MT5
Relicus LLC
5 (20)
您购买了多少次交易指标,它们拥有 出色的回测, 真实账户表现证明 拥有惊人的数字和 各种统计数据, 但使用后您却 账户爆仓? 您不应该只相信一个信号本身,您需要知道它最初出现的原因,这正是 RelicusRoad Pro 的最佳之处! 用户手册 + 策略 + 培训视频 + 带 VIP 访问权限的私人群组 + 提供移动版本 观察市场的新方式 RelicusRoad 是 全球最强大、最好的交易指标 ,适用于外汇、期货、加密货币、股票和指数,为交易者提供发展账户所需的所有信息和工具。我们提供 技术分析 和 交易计划 ,帮助 每位交易者取得成功 ,无论是 初学者 还是 高级交易者 。 它是一个 关键交易指标 ,提供足够的信息来 预测 未来市场。我们相信一个 完整的解决方案 ,而不是图表上几个没有意义的不同指标。这是一个 一体化指标 ,显示 信号 、 箭头 + 价格行为 信息,这是 无与伦比 且 非常准确的 。   RelicusRoad 利用机器学习 (AI) 技术,为交易者提供必要的信息和工具,帮助他们成为成功的、知情的交易者。   通过领先指标预测未来价格 几乎 所有技术指标都滞后 ,
FX Volume MT5
Daniel Stein
4.84 (19)
FX Volume:从经纪商视角洞察真实市场情绪 简要概述 想要提升您的交易策略? FX Volume 可提供零售交易者和经纪商的持仓实时数据——远早于诸如 COT 之类的延迟报告。不论您希望获得持续稳定的收益,还是想在市场中多一分制胜的砝码, FX Volume 都能帮您识别重大失衡、确认突破以及完善风险管理。立即开启体验,让真实的成交量数据为您的交易决策带来革新! 1. 为什么 FX Volume 对交易者格外有用 极具准确度的早期预警 • 快速捕捉有多少交易者正在买入或卖出某个货币对——比大多数人提前一步。 • FX Volume 是 唯一 能够整合多家零售经纪商真实成交量数据并以简洁方式呈现的工具。 强力风险管理 • 及时识别多头或空头仓位的巨大不平衡,这往往预示着潜在的趋势反转,帮助您更自信地设置止损和目标位。 • 独家而真实的数据让每一次交易决策更具可靠性。 优化进场与出场点 • 发现“过度集中”的交易(大多数交易者都在同一方向),并通过真实成交量来确认突破。 • 避免依赖常见指标可能带来的误导信号,而是利用真实的实时成交量。 适配各种交易策略 • 将 FX
FX Power MT5 NG
Daniel Stein
5 (17)
FX Power:分析货币强度,助您做出更明智的交易决策 概述 FX Power 是一款专业工具,帮助您全面了解主要货币和黄金在任何市场条件下的真实强度。通过识别强势货币用于买入,弱势货币用于卖出, FX Power 简化了交易决策,并帮助您发现高概率的交易机会。不论您是想跟随趋势还是通过极端的 Delta 值预测反转,这款工具都能完美适应您的交易风格。别再盲目交易——用 FX Power 让您的交易更加智慧。 1. 为什么 FX Power 对交易者极具价值 实时货币和黄金强度分析 • FX Power 实时计算并显示主要货币和黄金的相对强度,助您全面了解市场动态。 • 监控领先或落后资产,轻松识别值得交易的货币对。 全面的多时间框架视图 • 跟踪短期、中期和长期时间框架的货币和黄金强度,以便将您的交易策略与市场趋势保持一致。 • 无论是快进快出的短线交易还是更长期的投资策略, FX Power 都能为您提供所需的信息。 Delta 动态分析用于趋势和反转 • 极端 Delta 值常常预示反转机会,而平缓的 Delta 变化则确认趋势延续。 • 使用 Delta 分析,轻
支撑和阻力筛选器是 MetaTrader 的一个级别指标,它在一个指标内提供多种工具。 可用的工具有: 1. 市场结构筛选器。 2. 看涨回调区。 3. 看跌回调区。 4.每日枢轴点 5.每周枢轴点 6. 每月枢轴点 7. 基于谐波形态和成交量的强大支撑和阻力。 8. 银行级区域。 限时优惠:HV 支撑和阻力指示器仅售 50 美元且终生可用。 (原价 125$) 通过访问我们的 MQL5 博客,您可以找到我们所有带有分析示例的高级指标: 单击此处 主要特点 基于谐波和音量算法的强大支撑和阻力区域。 基于谐波和成交量算法的看涨和看跌回调区域。 市场结构筛选器 每日、每周和每月的枢轴点。 文档 所有支持和阻力筛选器文档(说明)和策略详细信息均可在我们 MQL5 博客的这篇文章中找到: 单击此处。 接触 如果您有任何问题或需要帮助,请通过私信联系我。 作者 SAYADI ACHREF,金融科技软件工程师,Finansya 创始人。
Matrix Arrow Indicator MT5
Juvenille Emperor Limited
5 (14)
矩阵箭头指标 MT5   是一种独特的 10 合 1 趋势,遵循   100% 非重绘多时间框架指标 ,可用于所有符号/工具: 外汇 、 商品 、 加密货币 、 指数 、 股票 。 Matrix Arrow Indicator MT5 将在其早期阶段确定当前趋势,从多达 10 个标准指标中收集信息和数据,它们是: 平均定向运动指数 (ADX) 商品渠道指数 (CCI) 经典 Heiken Ashi 蜡烛 移动平均线 移动平均收敛散度 (MACD) 相对活力指数 (RVI) 相对强弱指数 (RSI) 抛物线SAR 随机振荡器 威廉姆斯的百分比范围 当所有指标给出有效的买入或卖出信号时,相应的箭头将打印在图表上,在下一根蜡烛/柱线开盘时,指示强劲的上升趋势/下降趋势。用户可以选择使用哪些指标,并可以单独调整每个指标的参数。 Matrix Arrow Indicator MT5 仅从选定的指标中收集信息,并仅根据其数据打印箭头。   Matrix Arrow Indicator MT5   还可以为所有新信号发送终端、推送通知或电子邮件警报。无论您是黄牛、日内交易者还是波段交易者, Mat
Trend Forecaster
Alexey Minkov
5 (7)
The Trend Forecaster indicator utilizes a unique proprietary algorithm to determine entry points for a breakout trading strategy. The indicator identifies price clusters, analyzes price movement near levels, and provides a signal when the price breaks through a level. The Trend Forecaster indicator is suitable for all financial assets, including currencies (Forex), metals, stocks, indices, and cryptocurrencies. You can also adjust the indicator to work on any time frames, although it is recommen
Transaction Speed MT5
Ivan Stefanov
5 (1)
当然,以下是翻译成中文(简体)的版本: 该指标标出市场中显现出 交易兴趣 的区域,并随后显示 订单积累区域 。它的工作方式类似于大规模的订单簿。 这是为 大资金 打造的指标,性能卓越。市场中有任何兴趣,你都能通过它清晰看到。 (这是一个 完全重写的自动化版本 —— 不再需要手动分析。) 交易速度 是一个全新的概念指标,它显示了市场上大订单 何时 、 何地 聚集,并揭示了其背后的意义。它可以在 非常早期 就检测到趋势的变化。 在外汇市场,所谓的“交易量”实际上是误导性的,因为那指的是价格在单位时间内的变化,因此真正的名称应是“交易速度”。 一切都取决于我们如何思考、如何行动、如何分析。 改变分析范式至关重要。 该指标完全重构了外汇市场上“交易量”的概念,用逻辑方式重新定义并应用,从而成为一个 独特而精准的工具 。 使用方法: 默认情况下,指标处于 自动模式 ,可独立用于任何时间周期。如果你希望切换到手动模式,只需点击 Auto / Manual Mode 按钮即可。 在 手动模式 下,所有计算从 2025年1月1日 开始。你可以根据需要更改该日期,以查看不同的分析结果。 最优数据周期
Quantum TrendPulse
Bogdan Ion Puscasu
5 (14)
介绍 Quantum TrendPulse   ,这是一款终极交易工具,它将 SuperTrend   、   RSI 和 Stochastic 的强大功能整合到一个综合指标中,以最大限度地发挥您的交易潜力。该指标专为追求精准和效率的交易者而设计,可帮助您自信地识别市场趋势、动量变化以及最佳进入和退出点。 主要特点: 超级趋势整合: 轻松跟随当前的市场趋势并乘上盈利浪潮。 RSI 精度: 检测超买和超卖水平,非常适合把握市场逆转时机,可用作 SuperTrend 的过滤器 随机精度: 利用随机振荡在波动的市场中寻找隐藏的机会, 用作超级趋势的过滤器 多时间范围分析: 从 M5 到 H1 或 H4,在不同时间范围内关注市场动态。 可定制的警报: 当您的自定义交易条件得到满足时收到通知,这样您就不会错过任何交易。 无论您是新手还是经验丰富的交易员,   Quantum TrendPulse 都能为您提供所需的优势,帮助您增强策略并自信地进行交易。借助这一强大的指标,将洞察力转化为利润 — 掌控您的交易! ***购买 Quantum TrendPulse,即可免费获得 Quantum Tr
Cycle Maestro MT5
Stefano Frisetti
5 (1)
NOTE: CYCLEMAESTRO is distributed only on this website, there are no other distributors. Demo version is for reference only and is not supported. Full versione is perfectly functional and it is supported. CYCLEMAESTRO , the first and only indicator of Cyclic Analysis, useful for giving signals of TRADING, BUY, SELL, STOP LOSS, ADDING. Created on the logic of   Serghei Istrati   and programmed by   Stefano Frisetti ;   CYCLEMAESTRO   is not an indicator like the others, the challenge was to inter
MonetTrend
Aliya Bolek
MonetTrend — Премиум-индикатор для торговли по тренду (M30, H1, H4) MonetTrend — это мощный и визуально понятный трендовый индикатор, созданный для торговли на таймфреймах M30, H1 и H4. Он идеально подходит для работы с волатильными инструментами, такими как: • Золото (XAUUSD) • Криптовалюты (BTCUSD) • Валютные пары (EURUSD, USDJPY и др.) Ключевые особенности MonetTrend: • Автоматическое отображение Take Profit 1 (TP1) и Stop Loss (SL): После появления сигнала индикатор сразу показывает: • TP
FX Levels MT5
Daniel Stein
5 (5)
FX Levels:适用于所有市场的高精度支撑与阻力 快速概览 想要精准确定适用于任何市场(外汇、指数、股票或大宗商品)的支撑与阻力吗? FX Levels 将传统的“Lighthouse”方法与前沿的动态分析相结合,实现近乎通用的准确性。依托真实经纪商经验和自动化的每日与实时更新, FX Levels 帮助您捕捉价格反转点、设置合理的盈利目标,并自信地管理交易。立即使用,体验更准确的支撑/阻力分析如何助力您的交易更上层楼! 1. 为什么 FX Levels 对交易者非常有利 极度精准的支撑 & 阻力区 • FX Levels 专为不同经纪商提供的行情源和时间设置而设计,可生成几乎相同的价位区,解决数据不一致的常见问题。 • 这意味着无论您在哪里交易,都能获得稳定一致的水平线,为策略打下更加牢固的基础。 结合传统与先进技术 • 通过将久经考验的“Lighthouse”方法与动态分析相融合, FX Levels 不仅限于每日刷新,还可针对新的价格波动进行即时更新。 • 您可以选择经典的静态方式,或实时捕捉新出现的水平,以贴近最新的市场行为。 识别清晰的反转点 • FX Lev
TPSpro RFI Levels MT5
Roman Podpora
4.55 (20)
反转区域 / 峰值交易量 / 主要参与者的活跃区域 =       TS TPSPRO系统 俄语使用说明     /       指示     英语     /           MT4版本      该指标的每位购买者还可免费获得: 6 个月内可访问 RFI SIGNALS 服务的交易信号 - 根据 TPSproSYSTEM 算法准备的切入点。 定期更新的培训材料 - 让您沉浸在策略中并提高您的专业水平。 工作日每天 24 小时提供支持,并可以访问封闭的交易者聊天室 - 沟通、协助和市场情况分析。 作者设定的文件——自动指标设置,无需额外努力即可实现最大效果。 主要功能: 显示卖家和买家的活跃区域! 指标显示所有正确的买入和卖出第一脉冲水平/区域。当这些水平/区域被激活时,即开始寻找切入点的地方,水平会改变颜色并填充特定颜色。还会出现箭头,以便更直观地了解情况。 LOGIC AI - 激活模板时显示用于搜索入口点的区域(圆圈) 为了提高视觉清晰度,添加了使用人工智能搜索入口点的显示区域的功能。 显示更高时间范围内的级别/区域(MTF 模式) 添加了使用更高时间间隔显示级别/区域
ACB Breakout Arrows MT5
KEENBASE SOFTWARE SOLUTIONS
5 (1)
ACB Breakout Arrows 指标通过检测特殊的突破形态,提供市场中的关键入场信号。该指标持续扫描图表中的价格动量,在价格出现重大变动前,提前提供精确的入场信号。 点击此处获取多品种多周期扫描器 - ACB Breakout Arrows MT5 扫描器 主要特点 指标自动提供止损和止盈价格。 内置多周期扫描仪仪表盘,可追踪所有时间周期的突破信号。 适用于日内交易者、波段交易者和剥头皮交易者。 优化算法提升信号精度。 特别设置的快速盈利线用于无亏损移动或短线目标。 支持胜率、盈亏比、平均利润等绩效分析指标。 无重绘,信号可靠。 交易确认 - 可使用 ACB Trade Filter 指标 来过滤低概率的交易信号。 强烈买入: 向上箭头 + 绿色柱状图 + 多头趋势。 强烈卖出: 向下箭头 + 红色柱状图 + 空头趋势。 当柱状图为灰色且趋势为震荡时,应避免交易。 (可选) -  使用  KT 支撑阻力水平指标  避免在重要支撑/阻力位附近入场。这类交易可能迅速变成亏损。 “一个成功交易者的目标是做出最好的交易。金钱只是附属。” —— 亚历山大·埃尔德 输入参数 历史
Kecia Footprint Orderflow
Niccolo Filippo Palombi
5 (2)
if you want to test it : private message me ( MT5 demo testing doesn't work ) Designed to help traders gain a deeper understanding of the market’s true order flow dynamics . By visualizing the “ footprints ” left by candles, this indicator reveals how the delta ( the difference between buying and selling pressure ) changes during the candle formation, as well as how volume fluctuates at different price levels. These insights are essential for traders seeking to identify reversals, breakouts, and
Entry Points Pro for MT5
Yury Orlov
4.47 (131)
这款指标用于 MT5,可提供准确的入场交易信号,且无重绘。 它可应用在任何金融资产:外汇、加密货币、贵金属、股票、指数。 它将提供极其精准的评估,并告诉您何时开仓和平仓的最佳时机。 观看 视频 (6:22),其中包含一个仅处理单一信号的示例,该信号即可值回指标购价! 大多数交易者在 Entry Points Pro 指标的帮助下,在第一个交易周内即改善了他们的交易结果。 订阅我们的 Telegram 群 ! Entry Points Pro 指标的益处。 入场信号无重绘 如果信号出现,并得到确认,则它不会再消失;不像是重绘指标,它会导致重大的财产损失,因为它们可以在显示信号后再将其删除。 无差错开仓 指标算法可令您找到入场交易(买入或卖出资产)的理想时机,从而提高每位交易者的成功率。 Entry Points Pro 可操作任何资产 它允许您在 MT5 平台上交易任何经纪商的加密货币、股票、贵金属、指数、大宗商品和货币。 提供任何方向的信号 Entry Points Pro 指标提供针对任意价格走势的入场交易信号 - 上涨、下跌或横盘(横向)。 最大盈利潜力 离场信号
IQ Gold Gann Levels a non-repainting, precision tool designed exclusively for XAUUSD/Gold intraday trading. It uses W.D. Gann’s square root method to plot real-time support and resistance levels, helping traders spot high-probability entries with confidence and clarity. William Delbert Gann (W.D. Gann) was an exceptional market analyst, whose trading technique was based on a complex blend of mathematics, geometry, astrology, and ancient mathematics which proved to be extremely accurate. Download
Blahtech Supply Demand MT5
Blahtech Limited
4.54 (13)
Was: $299  Now: $149  Supply Demand uses previous price action to identify potential imbalances between buyers and sellers. The key is to identify the better odds zones, not just the untouched ones. Blahtech Supply Demand indicator delivers functionality previously unavailable on any trading platform. This 4-in-1 indicator not only highlights the higher probability zones using a multi-criteria strength engine, but also combines it with multi-timeframe trend analysis, previously confirmed swings
介绍     Quantum Breakout PRO   ,突破性的 MQL5 指标,正在改变您交易突破区域的方式!由拥有超过13年交易经验的资深交易员团队开发,     量子突破 PRO     旨在通过其创新和动态的突破区域策略将您的交易之旅推向新的高度。 量子突破指标将为您提供带有 5 个利润目标区域的突破区域的信号箭头,以及基于突破框的止损建议。 它既适合新手交易者,也适合专业交易者。 量子 EA 通道:       点击这里 重要的!购买后请私信我领取安装手册。 建议: 时间范围:M15 货币对:GBPJPY、EURJPY、USDJPY、NZDUSD、XAUUSD 账户类型:ECN、Raw 或 Razor,点差极低 经纪商时间:GMT +3 经纪商:IC Markets、Pepperstone with Raw 和 Razor 的点差最低 规格: 不重漆! 最多 5 个建议利润目标区域 建议止损水平 可定制的盒子。您可以设置自己的 Box Time Start 和 Box Time End。 接触 如果您有任何疑问或需要帮助,请通过私人消息与我联系。
Gartley Hunter Multi
Siarhei Vashchylka
5 (10)
Gartley Hunter Multi - An indicator for searching for harmonic patterns simultaneously on dozens of trading instruments and on all possible timeframes. Manual (Be sure to read before purchasing) | Version for MT4 Advantages 1. Patterns: Gartley, Butterfly, Shark, Crab. Bat, Alternate Bat, Deep Crab, Cypher 2. Simultaneous search for patterns on dozens of trading instruments and on all possible timeframes 3. Search for patterns of all possible sizes. From the smallest to the largest 4. All fou
Atbot
Zaha Feiz
4.65 (49)
AtBot: 它是如何工作的以及如何使用它 ### 它是如何工作的 “AtBot”指标用于MT5平台,通过结合技术分析工具生成买入和卖出信号。它集成了简单移动平均线(SMA)、指数移动平均线(EMA)和平均真实波幅(ATR)指标,以识别交易机会。此外,它还可以利用Heikin Ashi蜡烛来增强信号的准确性。 购买后留下评论,您将获得特别的奖励礼物。 ### 主要特点: - 不重绘: 信号在绘制后不会改变。 - 不变动: 信号保持一致,不会被更改。 - 无延迟: 提供及时的信号,没有延迟。 - 多种时间框架: 可在任何时间框架上使用,以适应您的交易策略。 ### 操作步骤: #### 输入和设置: - firstkey (TrendValue): 调整趋势检测的灵敏度。 - Secondkey (SignalValue): 定义买入/卖出信号生成的灵敏度。 - masterkey (ExitValue): 控制信号的退出策略。 - h: 切换是否根据Heikin Ashi蜡烛生成信号(真/假)。 - notifications: 启用或禁用信号提醒。 #### ATR计算: ATR测
- Real price is 80$ - 50% Discount (It is 39$ now) Contact me for instruction, any questions! - Lifetime update free - Non-repaint - I just sell my products in Elif Kaya Profile, any other websites are stolen old versions, So no any new updates or support. Advantages of  M1 Scalper Pro  Profitability: M1 Scalper Pro is highly profitable with a strict exit strategy. Frequent Opportunities: M1 Scalper Pro  takes advantage of numerous small price changes. Minimal Market Risk: Limited exposure redu
Enigmera MT5
Ivan Stefanov
3.67 (3)
ENIGMERA:市场核心 引言 该指标及交易系统为金融市场提供了一种卓越的方法。ENIGMERA 利用分形周期精确计算支撑位和阻力位,展示真实的积累阶段,并给出方向和目标——无论处于趋势还是回调,系统均能正常运行。 如何工作 指标的大部分功能由图表左侧的按钮控制,可快速应对不同的市场状况。 按钮说明 ON/OFF – 显示或隐藏整个指标。 Support – 趋势的主支撑线。 Ch – 激活支撑通道,标示可接受的偏差范围。 Dev1(第一偏差) – 显示价格在支撑偏差范围内的运动,表明市场盘整或力量积累。 Dev2(第二偏差) – 显示价格在偏差之间的运动,表明趋势正在形成及其方向。 Dev3(第三偏差) – 指示趋势显著加速和高波动性。 45deg(45度) – 显示市场节奏和相对于45线的运动稳定性。 Tgt(目标) – 趋势目标线,标示可平仓的位置。 Tgt Dev – 目标可能波动的通道范围。 Vol(成交量) – 在K线图上显示成交量点,标示市场成交量的显著变化。 X – 当价格到达目标线时显示“X”标记。 RandC(随机颜色) – 将指标线条和标签随机着色,以便更好地
Multi Currency Multi Time Market Scan Signals It is an Advanced multi-utility dashboard which works with full customization of signal settings and graphical interface. It works with Multi Symbols and Multi-Time frames from 1 SINGLE CHART TEMPLATE. It will automatically open the charts where the latest signals had formed- showing the important levels (Entry, Targets, Stop Loss) Many types of sorting methods for the scanner. A robust ENTRY based on  TREND OF MULTI-TIME FRAMES ( Complex Signals
FX Dynamic MT5
Daniel Stein
5 (1)
FX Dynamic:借助可定制的 ATR 分析,追踪波动率与趋势 概述 FX Dynamic 是一款强大的工具,通过计算平均真实波幅(ATR)来为交易者提供日内和日间波动性方面的深度见解。通过设置 80%、100%、130% 等关键波动率阈值,您可以快速识别潜在的盈利机会,或者在市场超出常规范围时及时得到预警。 FX Dynamic 可根据您经纪商的时区进行调整,帮助您保持一致的波动率衡量标准,并能与 MetaTrader 平台完美结合,实现实时分析。 1. 为什么 FX Dynamic 对交易者极具价值 实时 ATR 洞察 • 仅需一眼便可了解日间与日内波动水平。当价格触及或突破 80%、100%、130% 的 ATR 阈值时,会发出提示,让您知道市场是否达到临界水平。 • 在波动完全爆发前预判可能的衰竭或突破走势。 多市场通用 • 适用于外汇、商品、指数等多种资产。 FX Dynamic 可以自动识别经纪商时区,也可手动进行调整。 • 您可选择只专注于某一特定品种,或在多市场保持一致的 ATR 标准。 更智能的风险管理 • 利用 ATR 门槛来优化止损或止盈位置。当市场
作者的更多信息
MFI Multi-Scanner Indicator for MT5  The MFI Multi-Scanner Indicator is designed for automatic scanning of multiple currency pairs and timeframes to detect overbought and oversold signals using the Money Flow Index (MFI). It displays MFI values, signal arrows, and an interactive on-chart table. Ideal for traders who want to see the full market picture without constantly switching between windows. Performance Recommendations For maximum speed and fast testing, it is recommended to: Run the i
筛选:
无评论
回复评论