Bull Bear Power Indicator
- 指标
- Hasan Aksoy
- 版本: 1.0
- 激活: 5
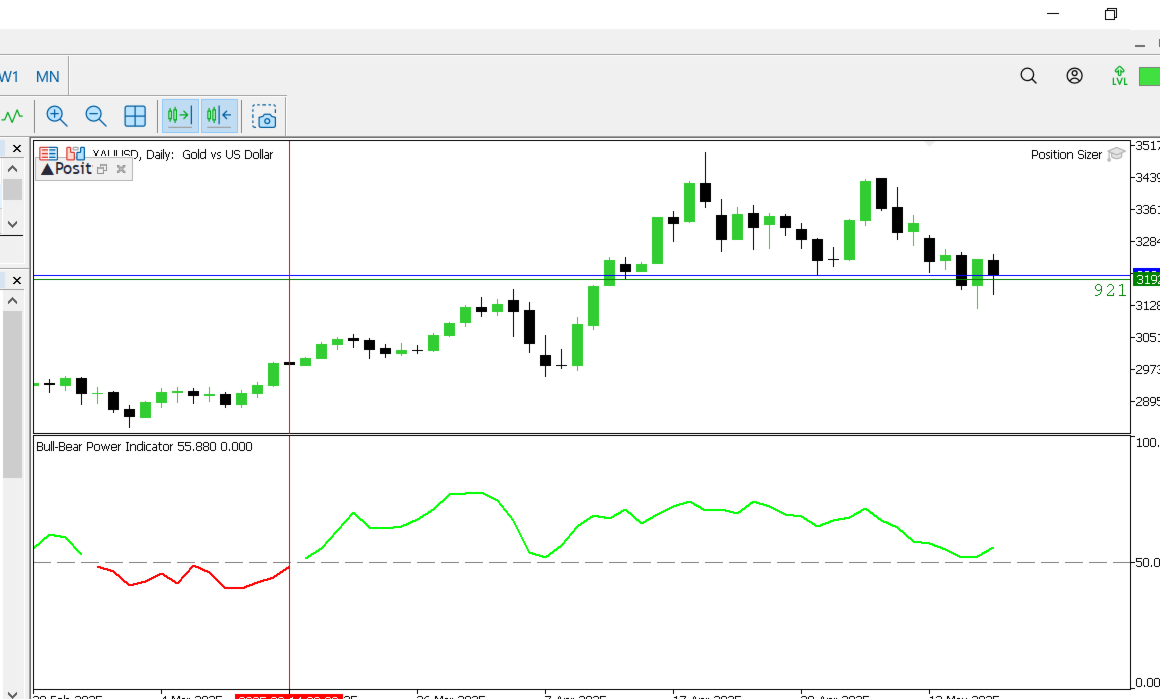
Enhanced Bull-Bear Power Indicator
Description
The Enhanced Bull-Bear Power Indicator is a custom technical analysis tool designed for MetaTrader 5. It provides a visual representation of the relative strength between bullish and bearish market forces over a user-defined period. By calculating the average percentage change for bullish and bearish bars, the indicator computes a strength ratio that helps traders identify prevailing market sentiment.
Features
User-adjustable period for calculations (default: 14 bars).
Visual distinction between bullish and bearish dominance using color-coded lines.
Reference line at 50 to indicate neutral market conditions.
Usage
Period: Adjust the period to change the number of bars used in the calculation. A longer period may smooth out the indicator, while a shorter period may make it more responsive.
Interpretation:
Above 50 (Lime): Indicates stronger bullish momentum.
Below 50 (Red): Indicates stronger bearish momentum.
The dashed gray line at 50 serves as a neutral reference point.
Lime line when the ratio is above 50.
Red line when the ratio is below 50.
This indicator is for informational purposes only and should not be used as the sole basis for trading decisions.
Ensure that the code is compiled successfully before attempting to use the indicator.