• 概述
  • 评论
  • 评论

Smart Market Flow Detector

Smart Currency Flow Detector (SCFD) - Professional V1.31

4 Advanced Algorithms Combined Into One Powerful Indicator

The Smart Market Flow Detector (SMFD) is a professional-grade Meta Trader 5 indicator that integrates four distinct analytical algorithms into a single comprehensive tool. By combining Volume Weighted Average Price (VWAP) deviation analysis, hidden flow detection, order flow imbalance calculations, and volume absorption detection, SMFD provides multi-dimensional insights into institutional order flow patterns in currency markets.

Four Integrated Algorithms Working in Harmony

SMFD combines four distinct analytical engines into a single powerful indicator, each contributing unique insights that are synthesized into actionable signals:

1. VWAP Deviation Analysis

Calculates Volume Weighted Average Price over a configurable period and measures current price deviation as a percentage. Statistical research shows that price tends to revert to VWAP, making deviations significant for identifying potential institutional entry points.

Formula: Deviation = (Current Price - VWAP) / VWAP × 100

2. Hidden Flow Detection

Analyses the relationship between volume spikes and price range compression. When volume exceeds threshold parameters while price range contracts relative to historical averages, this indicates potential absorption activity.

Key Metrics:

  • Close position within daily range
  • Volume ratio vs. moving average
  • Price range compression analysis

3. Order Flow Imbalance Calculation

Estimates buying vs. selling pressure by analysing  close position within the high-low range, weighted by volume. Enhanced with tick volume momentum analysis to identify divergences between price movement and volume patterns.

Calculation: Imbalance = (Buying Pressure - Selling Pressure) / Total Pressure × 100

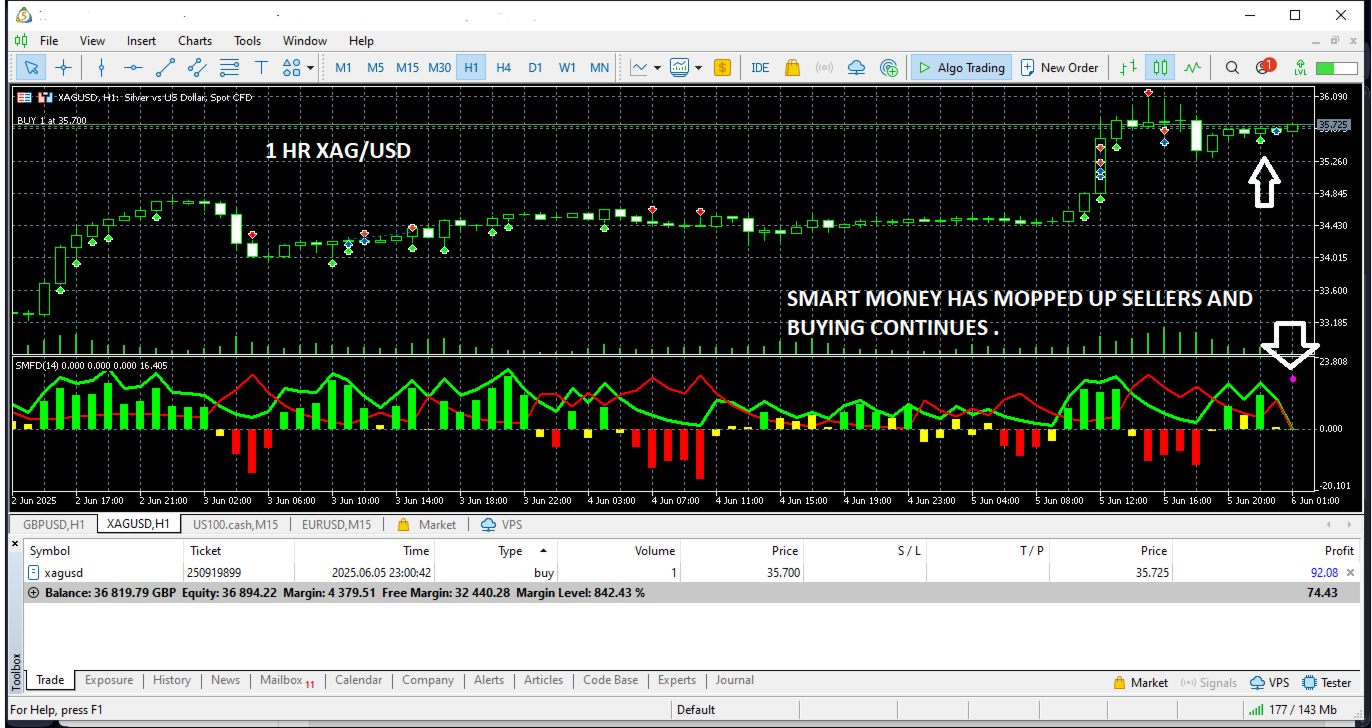
4. Volume Absorption Detection

Identifies periods where volume exceeds 150% of the moving average while price movement remains below 50% of historical average movement. This pattern typically precedes significant price movements.

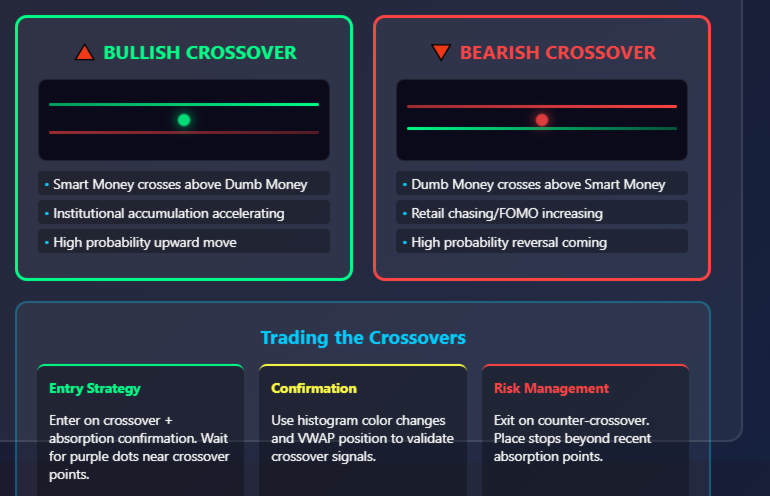
Algorithmic Synthesis

The power of SMFD lies not in any single algorithm, but in how these four analytical engines work together:

  • Algorithm Cross-Validation: Signals are only generated when multiple algorithms confirm the same market condition
  • Weighted Scoring System: Each algorithm contributes to a composite score that determines final signal strength
  • Divergence Detection: When algorithms disagree, it often signals market transition points
  • Noise Reduction: Four-algorithm confirmation significantly reduces false signals compared to single-method indicators

Technical Features

Non-Repainting Architecture

All calculations are performed on completed bars only (pos > 0 validation), ensuring signal reliability and preventing look-ahead bias. This professional implementation guarantees that historical back-testing results accurately reflect live trading performance.

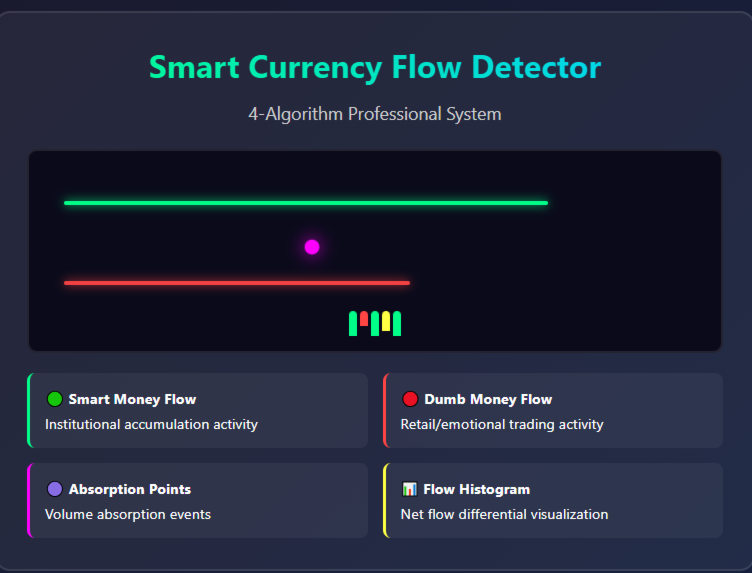
Multi-Buffer Output System

  • Smart Flow Buffer: Quantified institutional flow strength
  • Retail Flow Buffer: Counter-institutional activity measurement
  • Flow Signal Histogram: Net flow differential with colour coding
  • Absorption Markers: Volume absorption event identification

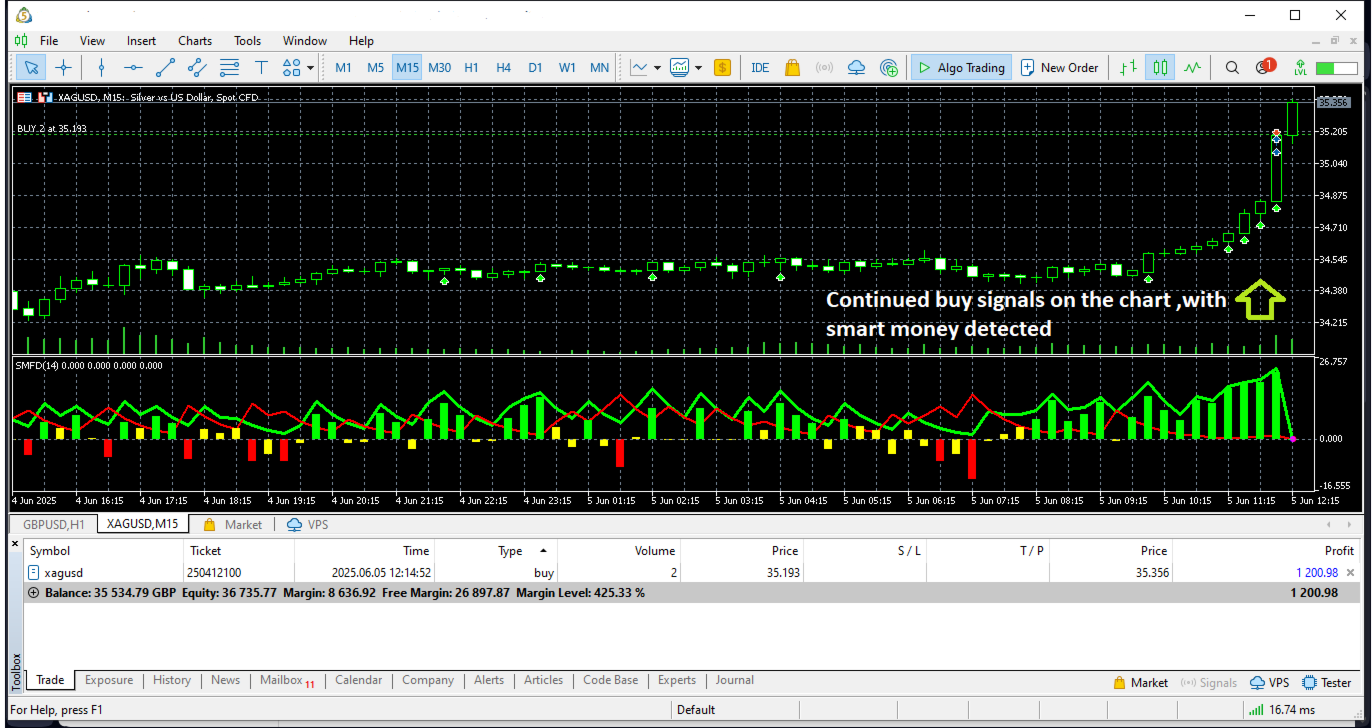
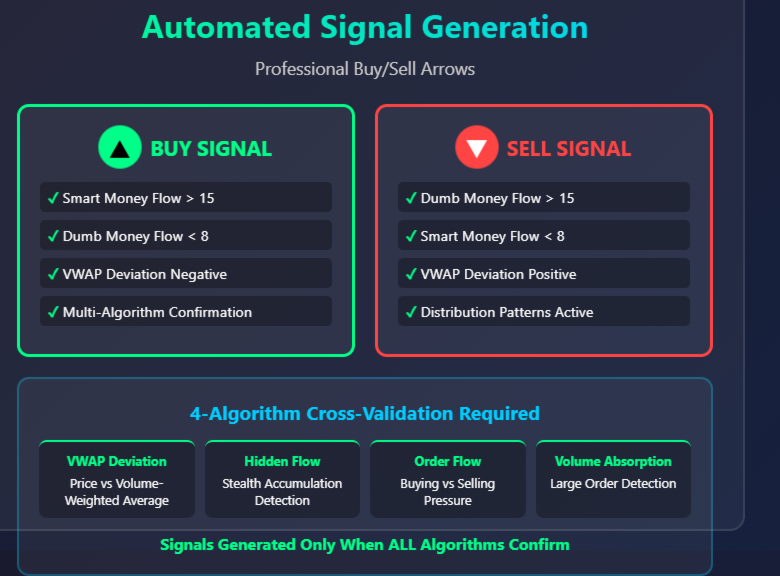
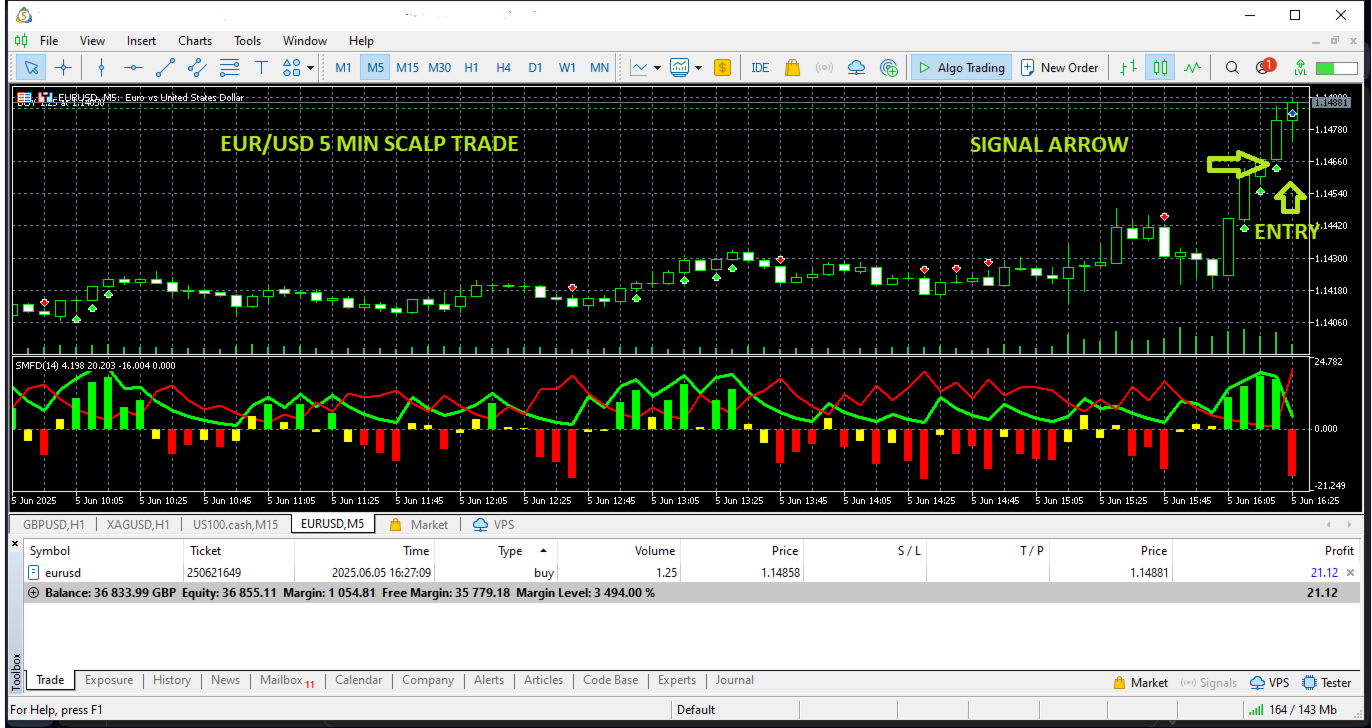
Automated Chart Signal System

Precision Buy/Sell Arrows

SMFD automatically places buy and sell arrows directly on your price chart when specific algorithmic conditions are met:

 Buy Signal Criteria:

  • Smart Money Flow > 15 (strong institutional accumulation detected)
  • Retail Money Flow < 8 (minimal retail participation)
  • Multi-algorithm confirmation across all 4 analytical engines

 Sell Signal Criteria:

  • Retail Money Flow > 15 (excessive retail participation/chasing)
  • Smart Money Flow < 8 (institutional distribution detected)
  • Cross-algorithm validation for signal reliability

Signal Features:

  • Exact Positioning: Arrows placed at optimal entry levels relative to price action
  • Detailed Tooltips: Hover over arrows to see exact flow scores and algorithm readings
  • Smart Chart Management: Automatic clean up prevents visual clutter (manages 200+ arrow limit)
  • Non-Repainting Guarantee: Signals only appear after bar completion - what you see in back-testing is what you get in live trading
  • Color-Coded Clarity: Green arrows (buy) positioned below price, red arrows (sell) positioned above price

Integrated Alert Framework

Real-time notifications with built-in spam protection (5-minute cooldown) to prevent alert fatigue while maintaining responsiveness to significant market events.

Configuration Parameters

Analysis Period (Default: 14)

Defines the lookback period for VWAP calculations and flow analysis. Shorter periods increase sensitivity to recent price action, while longer periods provide more stable trend identification.

Volume Analysis Period (Default: 20)

Sets the moving average period for volume normalization. Used to identify volume spikes relative to historical volume patterns.

Volume Threshold Multiplier (Default: 1.5)

Minimum volume spike ratio required to trigger absorption detection. Higher values reduce false positives but may miss subtle institutional activity.

Display Options

  • Absorption point visualization toggle
  • Chart arrow annotation control
  • Alert system enable/disable
  • Custom colour schemes for flow lines

Multi-Timeframe Strategy Applications

Scalping (M1-M5 Timeframes)

Strategy: Use rapid order flow imbalance signals for quick 5-15 pip moves

  • Setup: Wait for absorption arrows + immediate buy/sell signal confirmation
  • Entry: Enter on signal arrow with tight 3-5 pip stops
  • Target: Quick 1:1 or 1:2 risk/reward ratios
  • Best Sessions: London/New York overlap for maximum volume flow

Day Trading (M15-H1 Timeframes)

Strategy: Capture intraday momentum shifts and VWAP deviations

  • Setup: Combine signal arrows with VWAP deviation extremes (>2% deviation)
  • Entry: Signal confirmation at key support/resistance levels
  • Management: Trail stops using flow histogram colour changes
  • Best Pairs: Major USD pairs during high-volume sessions

Swing Trading (H4-D1 Timeframes)

Strategy: Multi-day position holding using institutional accumulation patterns

  • Setup: Wait for absorption clusters + signal arrow confirmation
  • Entry: Enter on pullbacks to VWAP after initial signal
  • Target: 50-200 pip moves over 2-7 days
  • Confirmation: Use higher timeframe flow alignment

Position Trading (Daily-Weekly Timeframes)

Strategy: Long-term trend identification using smart money accumulation

  • Setup: Monthly/weekly absorption patterns + consistent flow direction
  • Entry: Scale into positions during accumulation phases
  • Management: Hold until flow reversal signals appear
  • Portfolio: Suitable for portfolio managers and fund strategies

Multi-Timeframe Confluence

Professional Approach: Stack multiple timeframes for highest probability setups

  • Higher TF: Identify trend direction (D1/W1)
  • Entry TF: Time precise entries (H1/H4)
  • Confirmation TF: Validate momentum (M15/M30)
  • Risk Management: Exit when any timeframe shows flow reversal

Statistical Foundation & Multi-Algorithm Advantage

The indicator's four-algorithm approach is based on empirical market microstructure research:

  • VWAP Mean Reversion: Statistical tendency for price to revert to volume-weighted average over time
  • Volume-Price Relationships: Correlation analysis between volume spikes and subsequent price movements
  • Order Flow Theory: Academic research on buying/selling pressure estimation through intrabar analysis
  • Absorption Patterns: Quantitative identification of large order execution through volume/range analysis

Multi-Algorithm Statistical Edge: By requiring confirmation across multiple analytical methods, SCFD achieves significantly higher signal reliability than single-algorithm indicators. Research shows that multi-factor models reduce false positive rates by up to 60% while maintaining signal sensitivity.

Installation & Implementation

System Requirements

  • Meta Trader 5 build 2515 or higher
  • Minimum 4GB RAM recommended for optimal performance
  • Compatible with all MT5 brokers and account types

Setup Process

  1. Place SMFD.mq5 file in /MQL5/Indicators/ directory
  2. Restart Meta Trader 5 platform
  3. Attach indicator to chart via Navigator panel
  4. Configure parameters according to trading strategy
  5. Enable alerts if desired for real-time notifications

Performance Notes: Optimized for minimal CPU usage. Suitable for multiple chart deployment without system impact.

Package Contents

  • SMFD.mq5 - Complete indicator source code with full algorithm implementation
  • Technical Documentation - Detailed explanation of calculation methods and parameters
  • Implementation Guide - Step-by-step configuration instructions
  • Parameter Optimization Guide - Timeframe-specific recommended settings
  • Update Access - All future algorithm improvements and bug fixes included
  • Technical Support - Direct developer contact for implementation assistance

Technical Specifications

  • Signal Generation: Automated buy/sell arrows with algorithmic validation
  • Signal Reliability: Zero repainting through completed bar analysis only
  • Chart Integration: Direct price chart annotation with smart clean up system
  • Timeframe Compatibility: M1 through MN1 with automatic parameter scaling for all strategies
  • Resource Efficiency: Optimized algorithms with minimal CPU overhead
  • Instrument Support: All Meta Trader 5 supported symbols including forex, indices, commodities
  • Data Requirements: Minimum 50 bars for accurate calculations
  • Memory Usage: Efficient buffer management prevents memory leaks
  • Signal Frequency: Adaptive - more signals on lower timeframes, selective on higher timeframes .

User Feedback

"The non-repainting architecture is essential ." 

"Volume absorption detection has improved my entry timing significantly. The algorithm correctly identifies institutional activity patterns."

"Clean implementation with efficient resource usage. Suitable for algorithmic trading system integration." 


Feel free to contact me before or after your purchase if you have any questions regarding the Smart Market Flow Detector, or to request your PDF manual. Thank you." 


推荐产品
Blahtech Market Profile MT5
Blahtech Limited
5 (10)
Was: $249  Now: $149   Market Profile defines a number of day types that can help the trader to determine market behaviour. A key feature is the Value Area, representing the range of price action where 70% of trading took place. Understanding the Value Area can give traders valuable insight into market direction and establish the higher odds trade. It is an excellent addition to any system you may be using. Inspired by Jim Dalton’s book “Mind Over Markets”, this indicator is designed to suit the
SMC Venom 模型 BPR 指標是針對在智慧貨幣 (SMC) 概念內工作的交易者的專業工具。它會自動辨識價格圖表上的兩種關鍵模式: FVG (公平價值缺口)是三根蠟燭的組合,其中第一根和第三根蠟燭之間存在缺口。它在水平之間形成一個沒有成交量支撐的區域,這通常會導致價格調整。 BPR (平衡價格區間)是兩種 FVG 模式的組合,形成一個「橋樑」 - 當價格以低成交量活動移動時,突破並返回到水平的區域,從而在蠟燭之間產生間隙。 這些模式可協助交易者透過分析圖表上的交易量和價格動態(大型市場參與者和普通參與者之間的互動)來識別關鍵的支撐/阻力位、突破區域和切入點。 此指標以矩形和箭頭的形式可視化模式,也支援靈活的警報設定。 主要特點: 模式顯示模式:選擇顯示 BPR 模式(看漲和看跌)或 FVG 模式(看漲和看跌)。 可以隱藏所有圖表分析模式。 以條數過濾:BPR 結構中 FVG 之間的最小/最大距離。 訊號的附加視覺化: 箭頭有 9 種類型可供選擇(標準、細、分形等)或手動輸入 Wingdings 代碼,其表格可以選擇性地顯示在圖表上。 設定顏色、尺寸及其縮放時相對於價格的動態
Owl Smart Levels MT5
Sergey Ermolov
4 (29)
MT4版本  |   FAQ Owl Smart Levels Indicator 是一個完整的交易系統,包含 Bill Williams 的高級分形、構建正確的市場波浪結構的 Valable ZigZag 以及標記準確入場水平的斐波那契水平等流行的市場分析工具 進入市場和地方獲利。 策略的详细说明 指示灯使用说明 顾问-贸易猫头鹰助手助理 私人用户聊天 ->购买后写信给我,我会将您添加到私人聊天中,您可以在那里下载所有奖金 力量在於簡單! Owl Smart Levels 交易系統非常易於使用,因此適合專業人士和剛開始研究市場並為自己選擇交易策略的人。 策略和指標中沒有隱藏的秘密公式和計算方法,所有策略指標都是公開的。 Owl Smart Levels 允許您快速查看進入交易的信號,突出顯示下訂單的水平並向您發送有關已出現信號的通知。 優點很明顯: 清楚地顯示主要和更高時間框架的趨勢方向。 指示儀器信號的出現。 標記開單、止損設置和固定利潤的水平。 沒有多餘的,只有必要的結構! ZigZag 表示全球趨勢的方向,因此也表示貿易方向。 市場反轉點的短線清楚地表明在什麼水平上構建斐波那
How to use Pair Trading Station Pair Trading Station is recommended for H1 time frame and you can use it for any currency pairs. To generate buy and sell signal, follow few steps below to apply Pair Trading Station to your MetaTrader terminal. When you load Pair Trading Station on your chart, Pair Trading station will assess available historical data in your MetaTrader platforms for each currency pair. On your chart, the amount of historical data available will be displayed for each currency pai
Noize Absorption Index
Ekaterina Saltykova
Noize Absorption Index - is the manual trading system that measures the difference of pressure between bears forces and bulls forces. Green line - is a noize free index that showing curent situation. Zero value of index shows totally choppy/flat market.Values above zero level shows how powerfull bullish wave is and values below zero measures bearish forces.Up arrow appears on bearish market when it's ready to reverse, dn arrow appears on weak bullish market, as a result of reverse expectation.
可以说,这是您可以为MetaTrader平台找到的最完整的谐波价格形成自动识别指标。它检测19种不同的模式,像您一样认真对待斐波那契投影,显示潜在的反转区域(PRZ),并找到合适的止损和获利水平。 [ 安装指南 | 更新指南 | 故障排除 | 常见问题 | 所有产品 ] 它检测19种不同的谐波价格形态 它绘制了主要,衍生和互补的斐波那契投影(PRZ) 它评估过去的价格走势并显示每个过去的形态 该指标分析其自身的质量和性能 它显示合适的止损和获利水平 它使用突破来表明合适的交易 它在图表上绘制所有样式比率 它实现了电子邮件/声音/视觉警报 受斯科特·M·卡尼(Scott M. Carney)的书的启发,该指标旨在满足最纯粹和最熟练的交易者的需求。但是,它采取了一种使交易更容易的方式:在向交易发出信号之前,它会等待Donchian朝正确方向突破,从而使交易信号非常可靠。 斐波那契投影与向量无关 它实现了电子邮件/声音/推送警报 它绘制了ABCD投影 重要提示: 为了符合 Scott M. Carney先生 的商标申诉,某些图案名称已重命名为不言自明的替代方式, Scott M.
Your Trend Friend
Luigi Nunes Labigalini
5 (1)
The trend is your friend! Look at the color of the indicator and trade on that direction. It does not  repaint. After each candle is closed, that's the color of the trend. You can focus on shorter faster trends or major trends, just test what's most suitable for the symbol and timeframe you trade. Simply change the "Length" parameter and the indicator will automatically adapt. You can also change the color, thickness and style of the lines. Download and give it a try! There are big movements w
Maximum Trend Arrows OT MT5
Mulweli Valdaz Makulana
STRICTLY FOR BOOM INDEX ONLY!!!!! Here I bring the Maximum Trend Arrows OT1.0 MT5 indicator. This indicator is made up of a combination of different trend indicators for entries and exits, for entries an orange arrow will paint on the chart below the current market and a red flag for closing of trades and it produces buy arrows only. When the orange arrow appears, it will appear along with it's sound to notify you. The 1H timeframe is recommended, don't use it anywhere else than on the 1H timefr
To download MT4 version please click here . - This is the exact conversion from TradingView: "Trend Direction Force Index - TDFI [wm]" By "causecelebre". - The screenshot shows similar results from tradingview and Metatrader when tested on ICMarkets on both platforms. - This indicator uses multiple levels of averaging to detect trend strength. - You can optimize filter low and filter high levels to achieve best results. - You have access to buffers to use in EAs. - This is a light-load processin
关于指标 该指标基于金融工具收盘价的蒙特卡罗模拟。按照定义,蒙特卡罗是一种统计技术,用于通过基于之前观察的结果的随机数来模拟不同结果的概率。 它是如何工作的? 该指标通过基于历史数据模拟随时间变化的随机价格变动,为证券生成多个价格情景。每次模拟试验使用随机变量来有效地模拟未来在给定时间范围内的市场波动,重点在 收盘价 的波动。 蒙特卡罗模拟的优势 - 蒙特卡罗模拟通过在多种可能的未来情景下进行测试,有助于分析不同交易策略的风险。 - 它有助于确定策略在不同市场条件下的表现,包括罕见的极端事件(尾部风险)。 - 与依赖单点预测不同,蒙特卡罗提供了具有相关概率的潜在结果范围。这有助于理解盈利或亏损的可能性。 对于希望基于不同结果的概率而不是绝对预测来管理风险的交易者来说,蒙特卡罗是一个有用的工具。
该指标建立当前报价,可以与历史报价进行比较,并在此基础上进行价格走势预测。指示器有一个文本字段,用于快速导航到所需日期。 选项: 符号 - 选择指标将显示的符号; SymbolPeriod - 选择指标从中获取数据的时段; IndicatorColor - 指示器颜色; HorisontalShift - 由指标绘制的报价移动指定的柱数; Inverse - true 反转引号,false - 原始视图; ChartVerticalShiftStep - 图表垂直移动(键盘上的向上/向下箭头); 接下来是文本字段的设置,您可以在其中输入日期,您可以通过按“回车”立即跳转到该日期。 接下来是文本字段的设置,您可以在其中输入日期,您可以通过按“回车”立即跳转到该日期。
Introduction to Chart Pattern MT Chart Pattern MT is a chart pattern scanner to detect the triangle pattern, falling wedge pattern, rising wedge pattern, channel pattern and so on. Chart Pattern MT uses highly sophisticated chart pattern detection algorithm. However, we have designed it in the easy to use with intuitive user interface. Chart Pattern MT will show all the patterns in your chart in the most efficient format for your trading. You do not have to do tedious manual pattern detection an
HMA Trend Professional MT5
Pavel Zamoshnikov
4.25 (4)
Improved version of the free HMA Trend indicator (for MetaTrader 4) with statistical analysis. HMA Trend is a trend indicator based on the Hull Moving Average (HMA) with two periods. HMA with a slow period identifies the trend, while HMA with a fast period determines the short-term movements and signals in the trend direction. The main differences from the free version: Ability to predict the probability of a trend reversal using analysis of history data. Plotting statistical charts for analyzi
Rainbow EA MT5
Jamal El Alama
Description : Rainbow EA MT5 is a simple Expert advisor based on   Rainbow MT5 indicator witch is based on Moving average with period 34. The indicator is incorporated in the EA, therefore, it is not required for the EA to operate, but if you wish, you can download it from   my product page . The Expert Advisor settings are as follows : Suitable for Timeframes up to H1 The parameters below can be set according to your trading rules. StopLoss ( Stop Loss in pips) TakeProfit ( Take Profit in pips
Banana Binary MT5 Signal
Nirundorn Promphao
1 (1)
Promotion $66 lifetime for you. The principle of this indicator is very simple: detecting the trend with Moving Average, then monitoring the return point of graph by using the crossing of Stochastic Oscillator and finally predicting BUY and SELL signal with arrows, alerts and notifications. The parameters are fixed and automatically calculated on each time frame. Example: If you install indicator on EURUSD, timeframe M5: the indicator will detect the main trend with the Moving Average on this ti
SolarTrade Suite 金融指标:木星市场指标 - 您在金融市场世界中的可靠指南! 这是一个趋势指标,使用特殊的创新和高级算法来计算其值,并且具有令人赏心悦目的设计。 很容易理解此指标的读数:蓝色 - 买入,红色 - 卖出。 在说明底部查看我们来自 SolarTrade Suite 系列的其他产品。 您想自信地驾驭投资和金融市场的世界吗? SolarTrade Suite 金融指标:木星市场指标是一款创新软件,旨在帮助您做出明智的投资决策并增加您的利润。 SolarTrade Suite 金融指标:木星市场指标的优势: - 准确预测:我们的指标使用先进的算法和分析方法来准确预测市场走势。 接收有关买卖资产最佳时机的信号。 - 用户友好界面:直观的界面将使您能够轻松掌握该程序并在安装后立即开始享受其好处。 您可以从设置中更改点的大小和颜色、灵敏度和速度,所有其他设置都是自动完成的。 - 专家支持:我们的专业团队随时准备为您解答任何问题并提供有关使用该程序的建议。 为什么选择 SolarTrade Suite 财务指标:木星市场指标? - 可靠性和准确性:该
Orbit Rage Final 2
BILLY ARANDUQUE ABCEDE
Note : i only sell this EA on MQL5, any other sellers is fake. Orbit Rage Final, a cutting-edge trading strategy meticulously designed around the bull/bear candle approach and divergence analysis. This powerful tool is engineered to empower you to shape the life you desire. To embark on this transformative journey, simply download and seamlessly integrate it into your MetaTrader 4 platform by placing it in the experts advisors folder. Orbit Rage Final revolutionizes trading by offering a risk-f
Fibo Channels
Jeffrey Quiatchon
Fibo Daily Channel Indicator The  Indicator is a powerful tool for traders, providing precise daily support and resistance levels based on Fibonacci retracement and extension calculations. This indicator automatically draws key pivot points (PP, R1, R2, S1, S2) as well as additional extension levels (R3, R4, S3, S4), helping traders identify potential reversal and breakout zones with ease. It includes customizable alerts and push notifications, allowing traders to receive updates whenever the pr
ATrend
Zaha Feiz
4.77 (13)
ATREND: 工作原理及使用方法 工作原理 “ATREND”指标针对MT5平台设计,旨在通过结合多种技术分析方法为交易者提供强有力的买卖信号。该指标主要利用平均真实波幅(ATR)来测量波动性,并结合趋势检测算法来识别潜在的市场动向。 购买后请留言,您将获得特别的赠品。 主要特点: - 动态趋势检测:该指标评估市场趋势并相应调整信号,帮助交易者与当前市场条件对齐策略。 - 波动性测量:通过使用ATR,该指标衡量市场波动性,这对于确定最佳止损(SL)和止盈(TP)水平至关重要。 - 信号可视化:该指标在图表上直观地表示买卖信号,增强交易者的决策能力。 操作步骤 输入和设置: - 时间框架:此输入允许您设置指标计算的主要时间框架,默认值为15分钟。 - 时间框架2:此输入可用于定义额外分析的辅助时间框架,默认值为1分钟。 - 移动:此参数允许您将指标的计算向回移动,默认值为0。 - SLATR:此输入定义用于根据ATR计算止损水平的乘数,默认值为2.56。 - TPATR:此输入定义用于根据ATR计算止盈水平的乘数,默认值也为2.56。 - AlertsOn:启用或禁用交易信号的警报,
Introducing "X Marks the Spot" – Your Ultimate MetaTrader 5 Indicator for Perfect Trades! Are you tired of the guesswork in trading? Ready to take your MetaTrader 5 experience to a whole new level? Look no further – "X Marks the Spot" is here to revolutionize your trading strategy! What is "X Marks the Spot"? "X Marks the Spot" is not just another indicator – it's your personal trading compass that works seamlessly on all timeframes . Whether you're a beginner or an experienced trader,
Trade Path MT5
Tuomas Tirroniemi
交易路径指标——算法价格行为的可视化框架 Trade Path 是一种专业级指标,旨在揭示算法交易策略的决策点。 它映射了算法最活跃的区域——进入区域、停止水平和可能的反转点——为手动交易者提供了市场动态的结构化视图。 核心组件说明: 信号线(主动分析) 显示当前算法策略产生信号的确切技术分析水平 代表目前算法所遵循的主导技术偏见 触发价格(黄线) 临界价格水平: 主动算法策略发起仓位(突破单) 同时作为对立算法策略的止损水平 这创建了一个流动性区域,竞争算法可以在其中进行交互 止损水平(静态和动态) 代表: 当前算法策略的止损点 如果价格逆转,可能会触发相反算法 随着市场条件的变化而动态调整 关键市场机制 该指标突出显示了两个关键的算法交互水平: 触发水平 (黄色)和 止损水平 (红色)。它们共同定义了算法策略主动使用的 动态价格范围 。 算法范围结构 触发水平 和 止损水平 构成算法交易区间的 上限和下限 。 在此范围内: 算法寻求 在底部附近积累多头头寸 ,并 在顶部附近卖出 该区间既是 均值回归区域 ,也是 突破交易的启动板 突破动态 突破触发水平 将激活买入止损订单,因为
PipFinite Exit EDGE MT5
Karlo Wilson Vendiola
4.86 (29)
Did You Have A Profitable Trade But Suddenly Reversed? In a solid strategy, exiting a trade is equally important as entering. Exit EDGE helps maximize your current trade profit and avoid turning winning trades to losers. Never Miss An Exit Signal Again Monitor all pairs and timeframes in just 1 chart www.mql5.com/en/blogs/post/726558 How To Trade You can close your open trades as soon as you receive a signal Close your Buy orders if you receive an Exit Buy Signal. Close your Sell orders if
This indicator uses a mathematical calculation algorithm . This algorithm calculates the remainder between the updated model and the actual values and produces the possible progress of the graph on the graph. It is not a super prophet in trading, but it is very good for the trader when entering the market and to analyze it before entering. Applicable for all currencies. Данный индикатор использует алгоритм математических вычислений . Данный алгоритм вычисляет остаток между обновленной моделью и
Magic Finger 能帮助你清晰的发现趋势及交易机会。此系统根据经典策略加上个人交易经验制作。您也可以根据此指标加上您的交易风格去编写EA。 手指指向为开仓信号,变色线为趋势确认。如果您是日内交易者,可以选择在交易活跃的时间段内交易,参考变色线作为下单方向依据,手指信号作为过滤器。 如果你是趋势交易者,可以选择在H1以上的周期,在关键价格区域等待手指信号的出现,并入市交易,然后以变色线作为趋势的确认。 止损可以止损圆点作为依据。 RS为重要的多空分水岭 输入参数如下: RISK 5 MONEY RISK 2.0 AlertOption ********************************* Local Alert true TimesOfAlerts 2 E-Mail Alert false App PUSH Notification  false  Display_Option    *********************************  Barclor_Display  true  RS_Display   true  L
KT Renko Patterns MT5
KEENBASE SOFTWARE SOLUTIONS
KT Renko Patterns 会逐砖扫描整个 Renko 图表,寻找那些在各种金融市场中被交易者频繁使用的著名图表形态。 与基于时间的图表相比,Renko 图由于其简洁清晰的特性,更容易识别图表形态,尤其适合基于形态的交易策略。 KT Renko Patterns 包含多种常见的 Renko 图形模式,其中许多都在 Prashant Shah 所著的《用 Renko 图表实现盈利交易》一书中有详细说明。 基于 KT Renko Patterns 指标开发的 100% 自动交易EA已发布,点击这里了解 - KT Renko Patterns EA 。 特点 可交易多达八种清晰明确的 Renko 图形模式,无任何模糊。 每种模式都配有止损位和斐波那契目标位,确保交易策略客观明确。 KT Renko Patterns 实时监测每种模式的准确率,并将关键统计信息显示在图表上。 当 Renko 砖块发生反转时会自动标记并提醒,有助于在行情突变时提前计划退出。 已识别的图形不会重绘或重新绘制,信号稳定可靠。 包含的图形模式 W-M 形态 强势旗形 AB=CD 形态 三顶/三底 双顶
我们的   Basic Support and Resistance   指示器是提高技术分析所需的解决方案。该指标允许您在图表/ MT4版本 功能 斐波那契水平的集成: 可以选择显示斐波那契水平以及支持和阻力水平,我们的指标使您对市场行为和可能的逆转区域有更深入的了解。 性能优化: 只能在每个栏的打开时更新扩展线,我们的指标可确保最佳性能,而无需牺牲支持和阻力级别的准确性。 输入 主设置 Timeframe:   通过此输入,您可以选择在图表上显示较高时间范围的支撑线和阻力线。 Support/Resistance Strength [Number of Bars]:   使用此输入,您可以确定支撑和电阻的强度。数量越高,支持/阻力越强。 Price mode:  此参数允许您选择哪种价格将用于计算支持和电阻水平。它可以是收盘价,最高价格,最低价格等。取决于您的策略和偏好,您可以选择最适合您需求的价格。 显示设置 Display Fibonacci levels:   此参数确定是否将显示斐波那契水平以及图表上的支持和电阻级别。斐波那契水平是技术分析中使用的关键水平,并使用斐
The new update makes this indicator a complete tool for studying, analyzing and operating probabilistic patterns. It includes: On-chart Multi-asset percentage monitor. Configurable martingales. Twenty-one pre-configured patterns, including Mhi patterns and C3. An advanced pattern editor to store up to 5 custom patterns. Backtest mode to test results with loss reports. Trend filter. Hit operational filter. Martingale Cycles option. Various types of strategies and alerts. Confluence between patter
GoldTrader
Yashar Seyyedin
Please backtest with the exact balance of your live account before applying to real money. ==> If account balance is too low it may not trade at all! For MT4 version please contact via private message. martingale version is available here . Strategy description - Detect trend based on EMA18-EMA50-SMA200 alignment in three time frames: M15, H1, H4 - Trade in trend direction and exit when above alignment is broken. - The bot is tuned to trade XAUUSD(Gold). - The bot output is break even in rangin
FREE
这个指标用于比较图表上的交易品种与其他几个所选交易品种之间的强弱相对关系。 根据每个交易品种基于相同基准日的价格走势进行比较,可以看到几条不同走向的趋势线,反映出几个不同交易品种之间的强弱关系,这样可以更清楚地了解市场的趋势。 例如,你可以在EURUSD图表上应用这个指标,将其与货币对EURJPY和EURGBP进行比较,看看哪个更强。 你需要为指标输入参数: 需要比较的几个交易品种的名称 您需要选择比较基准日期。 请注意,使用指标前应确保相关交易品种的历史数据已经下载。 免费模拟版本是: https://www.mql5.com/zh/market/product/63921 .............................................
该产品的买家也购买
Enigmera MT5
Ivan Stefanov
5 (1)
ENIGMERA:市场核心 引言 该指标及交易系统为金融市场提供了一种卓越的方法。ENIGMERA 利用分形周期精确计算支撑位和阻力位,展示真实的积累阶段,并给出方向和目标——无论处于趋势还是回调,系统均能正常运行。 如何工作 指标的大部分功能由图表左侧的按钮控制,可快速应对不同的市场状况。 按钮说明 ON/OFF – 显示或隐藏整个指标。 Support – 趋势的主支撑线。 Ch – 激活支撑通道,标示可接受的偏差范围。 Dev1(第一偏差) – 显示价格在支撑偏差范围内的运动,表明市场盘整或力量积累。 Dev2(第二偏差) – 显示价格在偏差之间的运动,表明趋势正在形成及其方向。 Dev3(第三偏差) – 指示趋势显著加速和高波动性。 45deg(45度) – 显示市场节奏和相对于45线的运动稳定性。 Tgt(目标) – 趋势目标线,标示可平仓的位置。 Tgt Dev – 目标可能波动的通道范围。 Vol(成交量) – 在K线图上显示成交量点,标示市场成交量的显著变化。 X – 当价格到达目标线时显示“X”标记。 RandC(随机颜色) – 将指标线条和标签随机着色,以便更好地
This indicator is based on the mathematics of the great trader W.D. Ganna. With its help, you can easily find strong levels by analyzing swings to find the optimal entry point. The indicator works on all instruments and all timeframes. The indicator is fully manual and has control buttons. All you need to do is press the NEW button, a segment will appear, which you can place on any movement, swing or even 1 candle that you want to analyze. By placing the segment, press the OK button. A grid (th
The indicator is designed to work on any trading platform. The program is based on proprietary algorithms and W.D.Ganna's mathematics, allowing you to calculate target levels of price movement based on three points with the highest degree of certainty. It is a great tool for stock trading. The indicator has three buttons: NEW - call up a triangle for calculation. DEL - delete the selected triangle. DELS - completely remove all constructions. The probability of achieving the goals is more than 80
Cycle Maestro MT5
Stefano Frisetti
5 (1)
NOTE: CYCLEMAESTRO is distributed only on this website, there are no other distributors. Demo version is for reference only and is not supported. Full versione is perfectly functional and it is supported. CYCLEMAESTRO , the first and only indicator of Cyclic Analysis, useful for giving signals of TRADING, BUY, SELL, STOP LOSS, ADDING. Created on the logic of   Serghei Istrati   and programmed by   Stefano Frisetti ;   CYCLEMAESTRO   is not an indicator like the others, the challenge was to inter
IVISTscalp5
Vadym Zhukovskyi
5 (6)
我们向您介绍iVISTscalp5指标,它不仅独特,而且在交易操作中也非常有效。该指标基于时间数据,是多年金融市场经验和深入分析的结果。iVISTscalp5指标是手动交易的优秀工具。便利性、简单性和可视化 - 所有的复杂性都隐藏在内部。我们将iVISTscalp5指标的设置和使用简化到了最大程度。该指标适用于MT5终端中您所拥有的所有金融工具。 操作时间为UTC+3的早上4点到晚上8点。 iVISTscalp5指标菜单(见截图1): History - 计算行情的周数 dT_min - 选择时间间隔的时间(分钟) TFline - 绘制水平成交量(时间帧) BARSline - 绘制水平成交量(条数) TFtrend1 - 绘制日线通道(时间帧) BARStrend1 - 绘制日线通道(条数) TFtrend2 - 绘制周线通道(时间帧) BARStrend2 - 绘制周线通道(条数) ALERT_TIMER - 设置闹钟 ALERT - 开启/关闭闹钟 Save - 开启/关闭将时间记录到文本文件。 图表上的红色和蓝色旗帜表示时间(VIST智能剃须系统的信号)。卖出信号为红旗,买入
TrendMaestro5
Stefano Frisetti
note: this indicator is for METATRADER4, if you want the version for METATRADER5 this is the link:  https://www.mql5.com/it/market/product/108106 TRENDMAESTRO ver 2.4 TRENDMAESTRO recognizes a new TREND in the bud, he never makes mistakes. The certainty of identifying a new TREND is priceless. DESCRIPTION TRENDMAESTRO identifies a new TREND in the bud, this indicator examines the volatility, volumes and momentum to identify the moment in which there is an explosion of one or more of these data a
CBT Quantum Maverick
Arpit Sharma
1 (1)
CBT Quantum Maverick 高效的二元期权交易系统 CBT Quantum Maverick 是一款精心设计的高性能二元期权交易系统,专为追求精准、简单和纪律的交易者打造。无需自定义,该系统经过优化,可直接使用并产生高效结果。只需遵循信号操作,稍加练习即可掌握。 主要特点: 信号精准度: 基于当前K线生成下根K线交易信号,无频繁重绘。 市场多样性: 专为二元期权交易设计,兼容多种经纪商和资产类别,适应不同交易偏好。 兼容性: Deriv Synthetic Charts :适用于任何时间框架。 OTC Charts :来自如 Quotex、PocketOption、Binomo、Stockity、IQOption、Exnova、OlympTrade、Deriv、Binolla 和 Homebroker 的经纪商,可导入 MT5(一周内提供免费导入支持,之后需支付服务费用)。 外汇、加密货币和商品市场 :扩展资产利用。 高收益二元资产 :建议使用90%以上的高回报率资产。 额外优势: 全面的交易计划: 提供系统化和纪律性交易的分步支持计划。 高效时间利用: 每天仅需一
“这个被道具公司禁止使用的秘密交易工具(他们不想让你知道!)” 发现终极交易优势--无需 EA!(由交易者为交易者打造,不是机器人,而是纯粹的交易力量!) 在假突破、突然反转或市场操纵中挣扎?这款功能强大的交易工具即使在市场快速波动时也能为您提供激光般精确的信号--帮助您像专业人士一样发现高概率入口! --------------------------------------------------------------------------------------------------- 我的推荐:- 最佳信号强度设置 适用于所有类型(外汇对/黄金/指数/加密货币)等... 选择您想要的 TF 并在返回测试前从输入选项卡更改信号值 >> ( 4 或 5 ) >> 1m / 5m / 15m / 30m / 1H / 4H >> (2 或 3) >> 用于日线/周线/月线 ---------------------------------------------------------------------------------------------------
FxaccurateLS
Shiv Raj Kumawat
WHY IS OUR FXACCCURATE LS MT5 THE PROFITABLE ? PROTECT YOUR CAPITAL WITH RISK MANAGEMENT Gives entry, stop and target levels from time to time. It finds Trading opportunities by analyzing what the price is doing during established trends. POWERFUL INDICATOR FOR A RELIABLE STRATEGIES We have made these indicators with a lot of years of hard work. It is made at a very advanced level. Established trends provide dozens of trading opportunities, but most trend indicators completely ignore them! The
发现趋势。读取模式。把握入场时机。 三步只需30秒!轻松交易 — 无需分析,您的智能助手已准备好简化您的工作流程 不再因图表信息过载而困扰。 通过智能趋势偏向检测自信交易。 兼容所有货币、加密货币、股票、贵金属、指数及任意时间框架。 只需点击并执行 — 就这么简单。 非常适合希望快速清晰交易的忙碌交易者。 TPTSyncX 是一款强大的全能 MetaTrader 5 指标,可无缝同步 趋势、图形模式 与 K线触发 分析,并以清晰智能的可视化系统呈现。专为追求清晰度、精确性和速度的交易者设计,它通过结合价格行为、结构模式和市场时机工具,帮助识别高概率交易机会。 主要功能: 智能可视化显示: 自动绘制价格结构模式,并清晰标注高点高 (HH)、低点高 (HL)、高点低 (LH) 与低点低 (LL) 于图表上 — 实时展现市场结构变化与潜在反转区域,对识别趋势转换与价格突破至关重要。 订单区块 & 公允价值缺口自动识别: 只需在图表上双击,即可自动检测订单区块与公允价值缺口,突显潜在机构痕迹与失衡区域。 动态移动平均线: 根据所选目标K线范围自动调整周期,适用于短线剥头皮或长线波段交易的动态
Gann Zone Pro MT5
Kirill Borovskii
This indicator identifies and displays zones, as it were areas of strength, where the price will unfold. The indicator can work on any chart, any instrument, at any timeframe. The indicator has two modes. The indicator is equipped with a control panel with buttons for convenience and split into two modes. Manual mode: To work with manual mode, you need to press the NEW button, a segment will appear. This segment is stretched over the movement and the LVL button is pressed. The level is displayed
The   Time_Price_SQ9_Degree   indicator is based on the 9 Gann square. Using this indicator, you can identify strong time and price zones. The indicator displays the levels as a degree value. The degrees can be set in the settings. After launching, the MENU button appears. If it is highlighted, it can be moved to any point on the graph, and after double-clicking on it, it stops being highlighted and menu buttons appear. To hide the menu, just double-click on the button, it will become highlight
Viking Strategy Signal Indicator
E Bahamlong Bagoudjare
5 (1)
Viking_Strategy_Signal Indicator is a solution I offer to beginner, amateur, and professional traders. My scalping robot :  https://www.mql5.com/fr/market/product/133191  4 copies left the next price 699.99$ Final price 999.99$ By purchasing this indicator, you will first save time because it automatically analyzes the market based on Dow Theory and the Smart Money Concept (High (H), Low (L), Higher High (HH), Lower Low (LL), Break of Structure (BOS) to determine market structure and trend). It
Hello I Want to introduce The Forex Buy Sell Arrow Premium MT5 i recently release this premium indicator! its 1000% Non Repaint Indicator, It Work Perfectly Well,, i tested it day by day, Just mind blowing Result,  Including Powerful trend Algorithm! How It Work? well, it work market trend formula, when trend Bullish Or when trend Bearish,  Recommend Timeframe M30, H1 it work all timeframe, and all currency pair, 100% non repaint, How to take signal From Forex Buy Sell Arrow Premium Ind
Naveen Dynamic Square MT5
Satya Prakash Mishra
The Naveen Dynamic Square  MT5  is one of the best known  technical analysis tools  inspired  by WD Gann along with the Gann Fan and Gann Box. It is considered a cornerstone of his trading technique that is based on time and price symmetry. The Naveen Dynamic Square MT5   is a powerful tool in finance for determining support and resistance levels based on a stock's extreme price points. It works by extrapolating probable price levels from a central value, typically an all-time or cyclical high o
Reversal ALGO
Muhammad Abdullah Bhatti
Reversal Algo 是一款精心设计的技术指标,旨在帮助交易者识别市场趋势的潜在转折点。通过深入分析历史价格数据,它能够检测可能预示市场动能即将转变的重要高点和低点。该指标在您的图表上提供清晰且明确的视觉信号,使您能够精准定位趋势可能反转的关键区域。Reversal Algo 遵循严格的行业标准,提供客观且可靠的信息,而不做夸大的声明或保证。 主要特点 重要价格检测: Reversal Algo 系统地扫描历史价格数据,以识别标志潜在反转区域的显著峰值和谷值。它优先考虑统计上显著的水平,而非短暂的市场噪音,确保信号既有意义又可靠。 高级噪音过滤: 该指标采用复杂的波动性过滤器,最小化次要价格波动的影响。这种高级噪音过滤机制确保只有重要的价格运动会触发警报,从而减少误报的发生。 可定制参数: 通过广泛的可配置设置,交易者可以调整灵敏度和阈值水平,以根据特定的交易风格和市场条件定制该指标。无论您偏好保守的方法还是激进的策略,Reversal Algo 都可以根据您的个人需求进行微调。 稳健的数据分析: 通过检查广泛的历史价格数据,Reversal Algo 识别出重复的模式和关键水平
Multi Currency Multi Time Market Scan Signals It is an Advanced multi-utility dashboard which works with full customization of signal settings and graphical interface. It works with Multi Symbols and Multi-Time frames from 1 SINGLE CHART TEMPLATE. It will automatically open the charts where the latest signals had formed- showing the important levels (Entry, Targets, Stop Loss) Many types of sorting methods for the scanner. A robust ENTRY based on  TREND OF MULTI-TIME FRAMES ( Complex Signals
Crash500 Spike Detector v1.0 Crash500 spike detector prints Down non repaint Arrow for catching crash spikes. It is suitable for 1M time frame for majorly crash500  When the Red arrow prints, it indicates high probability of crash spikes downwards. Its pretty straight forward since I designed it to follow strong trends.  Use default settings, however, you can change the color of your chart background as may be appropriate. The system uses mathematical approach in to display statistical data inf
Super Zone indicator
Dmitriy Sotnikov
5 (1)
Super Zone   For several years of observing the principles of the market, Super Zone worked, both then and now, because the indicator  allows you to see the trading range of the  week and even the month that major market participants use. It’s very easy to use, we work on H4 in the weekly range (  in the tester it doesn’t work in the demo mode  ) - we sell from the upper zones, we buy from the lower ones. It marks the zones from the beginning of the week (month) that are  not redrawn  , works on
TMA Channel 是在传统的TMA基础之上 , 通过特殊的计算方法得到一个价格通道 . 通道具有上轨 , 中轨 , 下轨 . 当价格接近或者高于上轨时 , 已经处于超买状态 , 这时要注意反转下跌的情况 ; 当价格接近或低于下轨时 , 已经处于超卖状态 , 这时要注意反转上涨的情况 . 指标会根据中轨的坡度 , 来显示出上涨趋势或者下跌趋势 . 当没有明确趋势显示时 , 说明处于宽幅震荡的行情 . 中轨的上升趋势和下降趋势的颜色 , 通过指标的属性里面来设置 , TMA_mid , 第一个颜色是上升趋势的颜色 , 第二个颜色是没有趋势时的颜色 , 第三个颜色是下降趋势的颜色 .  优势 :  对于趋势有很好的跟踪 , 并且能明显的展示出超买和超卖的区域 . 输入参数 :  ATR multiple   :  ATR 的倍数 , 默认是40 , 修改这个会影响上下轨的位置 , 数值越大 , 上下轨距离中轨越远 .  slope of trend in the middle track   :  根据中轨斜率来判断是否是趋势 color of upper track   : 
Happy entries
Godwill Fortune Otieno Juma
The  product gives optimized entries for 3min ,1 hr and day timeframes  Does well with indices  ASIAN- HK50 AND CHINA A50 USA-US30,US100,US500 GER40 ,UK100 For stocks trade with the day timeframes Happy Entry employs advanced algorithms and real-time data analysis to identify optimal entry points with unprecedented accuracy. Its adaptive nature allows it to seamlessly adjust to changing market conditions, ensuring you never miss out on profitable opportunities. Whether you're a beginner or seas
God line
Hong Tao Ren
这个指标采用一种特殊的思路来指示市场方向,指标加载在一小时和15分钟图表效果最好。 当指标显示红色时,表明市场趋势为多头,绿色表明市场趋势为空头,黄色为不明确,此时应避免开单。 我们需要达成共识的一点是:市场行情是随机发展的,无法完全准确预测,我们能做的只有跟随,不和市场趋势对着干,才能做到顺势而为。 本指标就是在这个思路下研发的,紧紧跟随市场行情发展,确认行情展开了才会显示对应的颜色。跟随本指标,只需要按照指示操作即可。 长期跟随的情况下,交易绩效是很不错的。 另外一点:本指标更适合趋势性较强的品种,比如镑日,美日,黄金等。 依据本指标交易镑日的话,可以用在5分钟或15分钟周期,获利30个点离场是比较可行的。
VTrende Pro
Andrii Diachenko
5 (1)
VTrende Pro - MTF indicator for trend trading with a display panel for MT5 *** Videos can be translated into any language using subtitles (video language - Russian) Although the signals of the VTrende Pro indicator can be used as signals of a full-fledged trading system, it is recommended to use them in conjunction with the Bill Williams TS. VTrende Pro is an extended version of the VTrende indicator. Difference between Pro version and VTrende: - Time zones - Signal V - signal 1-2 waves -    S
XCalper TFO
Aecio de Feo Flora Neto
This oscillator was developed exclusively by xCalper in 2015 based on moving averages calculations to indicate and try predicting oversold and overbought levels. The fast line (white, by default) oscillates basically between values -0.5 (oversold) and +0.5 (overbought). Whenever this line crosses upward value -0.5, it means an oversold price level. When it crosses downward value +0.5, it means an overbought price level. When fast line crosses value 0.0 and returns, it is a strong pull-back indic
Smooth price for Monarch
Konstantin Gruzdev
5 (1)
The Smooth Price technical indicator is used for plotting a smoothed line as close to the price of the financial instrument as possible, and serves to eliminate its noise components. The indicator is part of the Monarch trading system, but here it is presented as an independent technical analysis tool. The indicator is based on the cluster digital filter , which, unlike the ClusterSMA , is applied directly to the price time series. Smooth Price does not redraw (except the very last, zero bar) an
Pan PrizMA CD Phase
Aleksey Panfilov
The Expert Advisor and the video are attached in the Discussion tab . The robot applies only one order and strictly follows the signals to evaluate the indicator efficiency. Pan PrizMA CD Phase is an option based on the Pan PrizMA indicator. Details (in Russian). Averaging by a quadric-quartic polynomial increases the smoothness of lines, adds momentum and rhythm. Extrapolation by the sinusoid function near a constant allows adjusting the delay or lead of signals. The value of the phase - wave s
Классификатор силы тренда. Показания на истории не меняет. Изменяется классификация только незакрытого бара. По идее подобен полной системе ASCTrend, сигнальный модуль которой, точнее его аппроксимация в несколько "урезанном" виде, есть в свободном доступе, а также в терминале как сигнальный индикатор SilverTrend . Точной копией системы ASCTrend не является. Работает на всех инструментах и всех временных диапазонах. Индикатор использует несколько некоррелируемых между собой алгоритмов для класси
Currency Index Watcher is a simple and user-friendly tool for whoever wish to trade Forex using currencies indexes. Currency Index Watcher is configurable and usable directly from the panel. Indexes of 8 custom currencies EUR, USD, GBP, JPY, CHF, AUD, CAD, NZD (default) Any 3-chars symbol from your market watch could be used (BTC = bitcoin, RUB = ruble, CNH = yuan etc ...) : double click the symbol label  Ability to select which currencies and made-of pairs will be analyzed : check/uncheck wante
Forex Relative Performance indicator This indicator calculates the relative strength of major currencies against the US dollar. The basic idea behind this indicator is "to buy strong currency and to sell weak currency". This indicator allows you to quickly identify the best forex pair to trade according to your trading style (Intraday, Scalping, Swing, or Long Term)
Powerful Hidden Cross Signal
Ellan Dirgantara Tholkhah
The latest most requested Binary Options arrow indicator in the Garuda Signals product line is now on MT5! Binary options signal based on multiple time frame cross over analysis. Gets confirmation from the most consistent signals known to man; Ichimoku, SMA, Bollinger Bands; and also uses the 1 Hour time frame as trend confirmation , so you don't have to open up multiple chart and waste time. - Can be used for all time frames up to 1 hour, but is most POWERFUL for 1 and 5 min options. - Place yo
作者的更多信息
Forex Wheel EA
Victor Paul Hamilton
5 (1)
外汇之轮 由 Victorious Creations Labs 开发 趋势市场 ,区间市场 .有谁在乎 ! . 不相关的随机货币对能错多少次? .   摆脱分析瘫痪,通过非常规手段开始看到积极成果。95%的交易者失败是因为95%的交易者按照他们教你他们想要你做的去做 ! . 用你自己的方式玩这个游戏 . 早期适配者价格:$59.99 外汇之轮是一种混合手动/自动交易系统,旨在通过实用的市场方法帮助交易者发展必要的技能。该系统专注于仓位大小、风险管理和退出策略——这些真正决定长期盈利能力的组成部分。 核心交易理念 外汇之轮建立在盈利交易的数学原理之上: 以2:1的回报风险比,你只需要在33%的时间内正确就能获利 以3:1的比率,你可以在75%的时间内出错,但仍然能赚钱 我们默认的2.5:1比率仅需29%的胜率就能达到盈亏平衡点 该系统将焦点从入场信号转移到对持续盈利最重要的技能上。 主要特点 用于选择货币对的交互式界面 同时交易1-20个货币对(取决于经纪商允许) 基于经验证的数学比率自动设置盈利/亏损阈值 奖励盈利头寸的额外交易功能 相关性分析以分散交易组合 用户友好的图表控制界
Breakout Londres
Victor Paul Hamilton
你敢用经过时间检验的方法交易而不是马丁格尔式的幻想 ? . 这个EA实际上迫使用户进行交互和理解——需要正确设置交易时段时间,了解经纪商的要求,并为不同的交易品种调整参数。这不是一个"一键设置后遗忘"的黑盒系统,这就是为什么有些人觉得它"复杂"的原因。 讽刺的是,理解这些基础知识会让交易者比盲目运行任何自动化系统更加成功。 可悲的事实是,最赚钱的策略在回测中往往看起来最无聊,但零售交易者想要刺激和兴奋 - 这正是为什么95%的人亏钱的原因。 突破伦敦 通用交易时段突破系统 Victorious Creations Labs 功能介绍 突破伦敦是一个专业的交易时段突破系统,灵感来源于经过时间检验的伦敦突破策略。它不仅能够出色地捕捉伦敦市场的爆发性行情,其通用框架还适用于任何交易时段转换期间,当价格从盘整突破进入趋势性行情时。 核心策略: 在市场平静时段识别盘整区间 放置智能挂单捕捉突破 使用专业风险参数管理交易 可应用于您定义的任何交易时段转换 工作原理 区间识别:在您定义的平静时段内,EA追踪每个15分钟蜡烛图以建立真实的高/低区间。这种多蜡烛图方法能捕捉真正的极值,而非瞬时
FREE
筛选:
无评论
回复评论