Equity Curve MT5 Indicator by PipTick
- 实用工具
- Michal Jurnik
- 版本: 1.2
- 更新: 1 十二月 2021
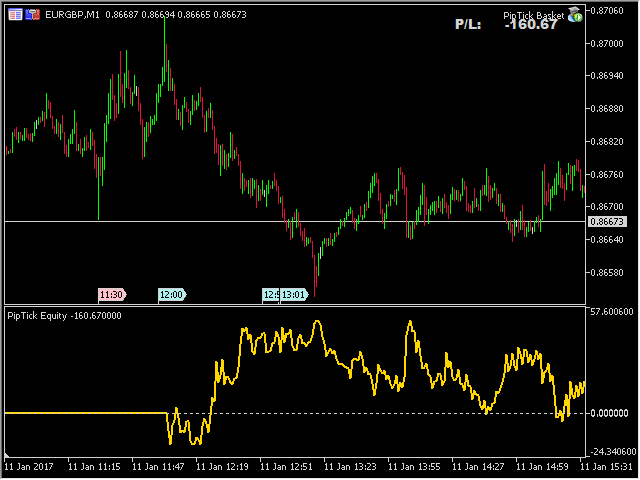
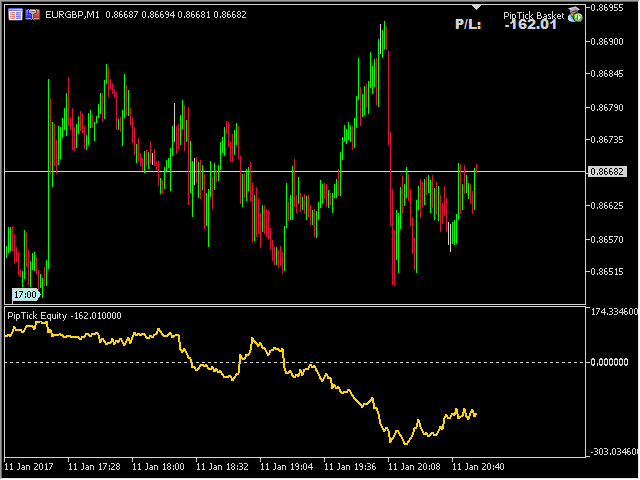
The Equity Curve indicator is a simple and helpful tool that shows the development of the equity curve in real time.
For precision measurement, it should be used in a separate window with a period of M1.
Main features
- The indicator shows the development of the equity curve in real time.
- High precision on the minute chart.
- High-speed calculation.
- Available for MT4 and MT5.

用户没有留下任何评级信息