• 概述
  • 评论 (1)
  • 评论 (4)
  • 新特性

Length Movement MT5

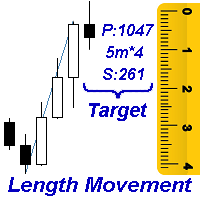
Measures the length of the selected movement in points, shows the duration of the movement, as well as the speed of movement. Outputs the average value of each dimension.
It is designed to calculate the expected target based on typical market movements.
The intended goal will provide information about the ratio of the stop size to the possible profit and will allow you not to open positions with a small expected profit.
It will also help you determine the point at which it is more logical to close a position. 

Note: the MT5 tester is not designed for full-fledged work with graphic objects, so drawing in the tester is slower than in the real situation.
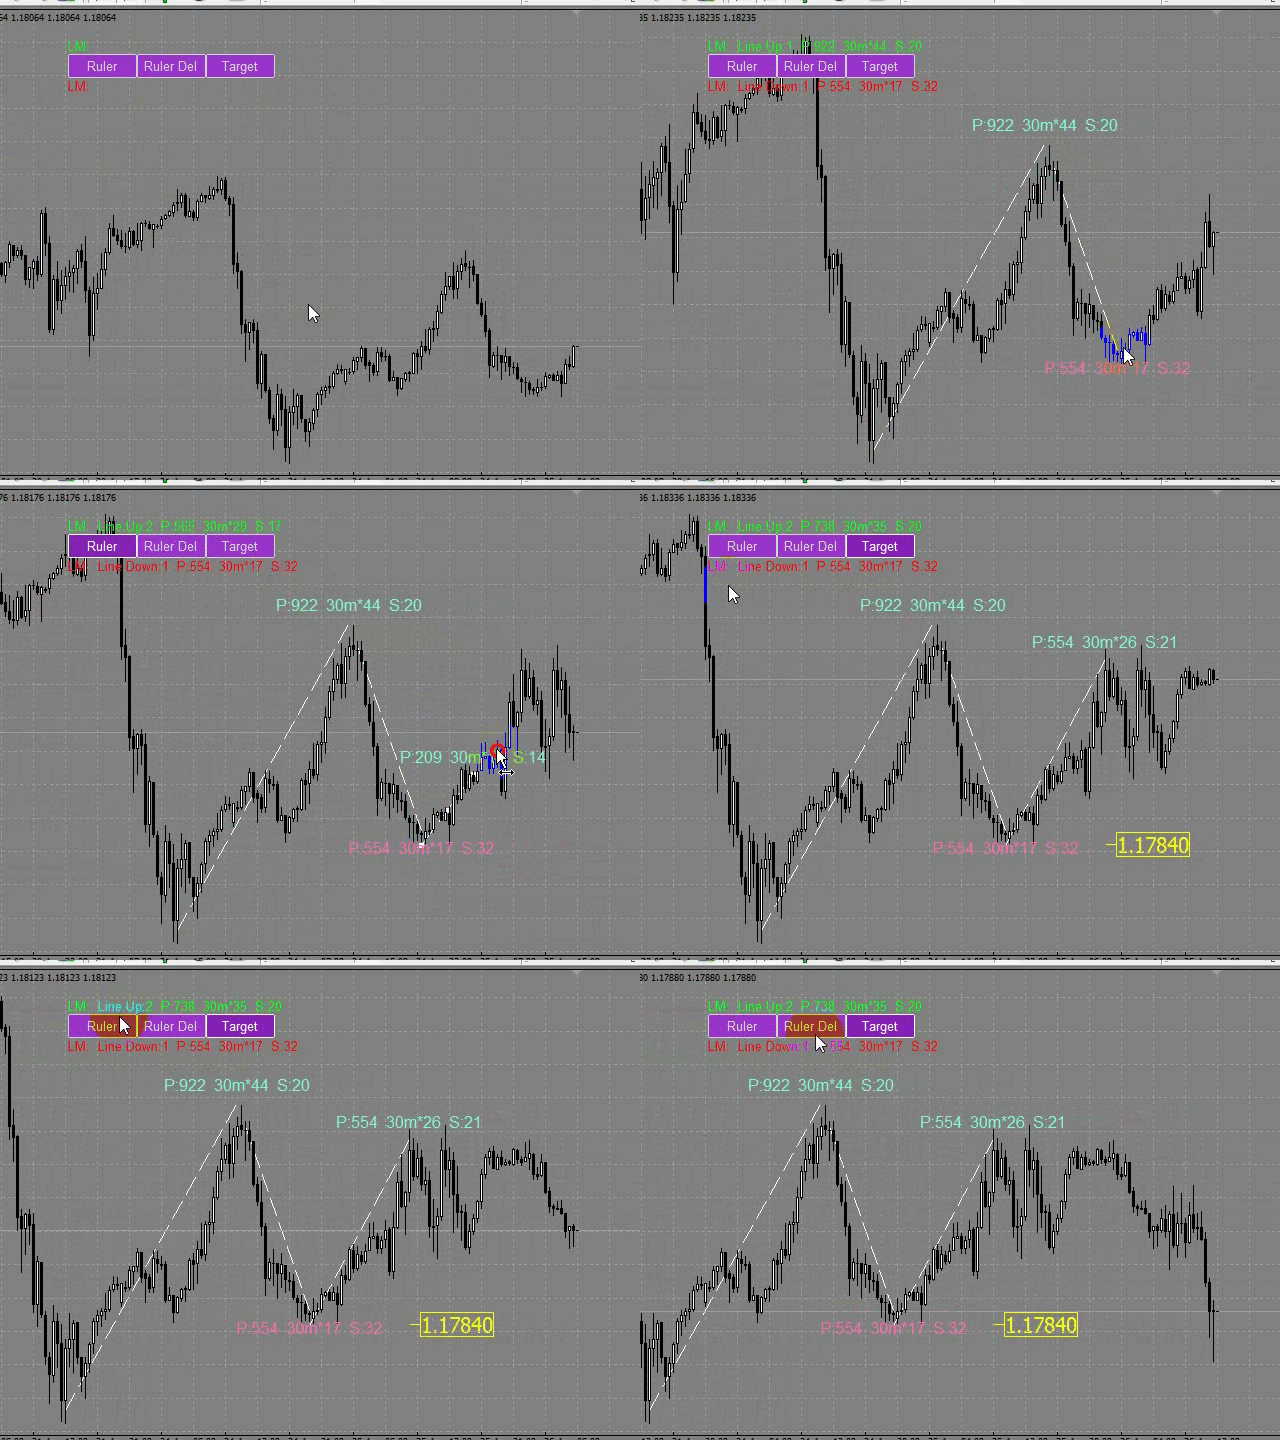
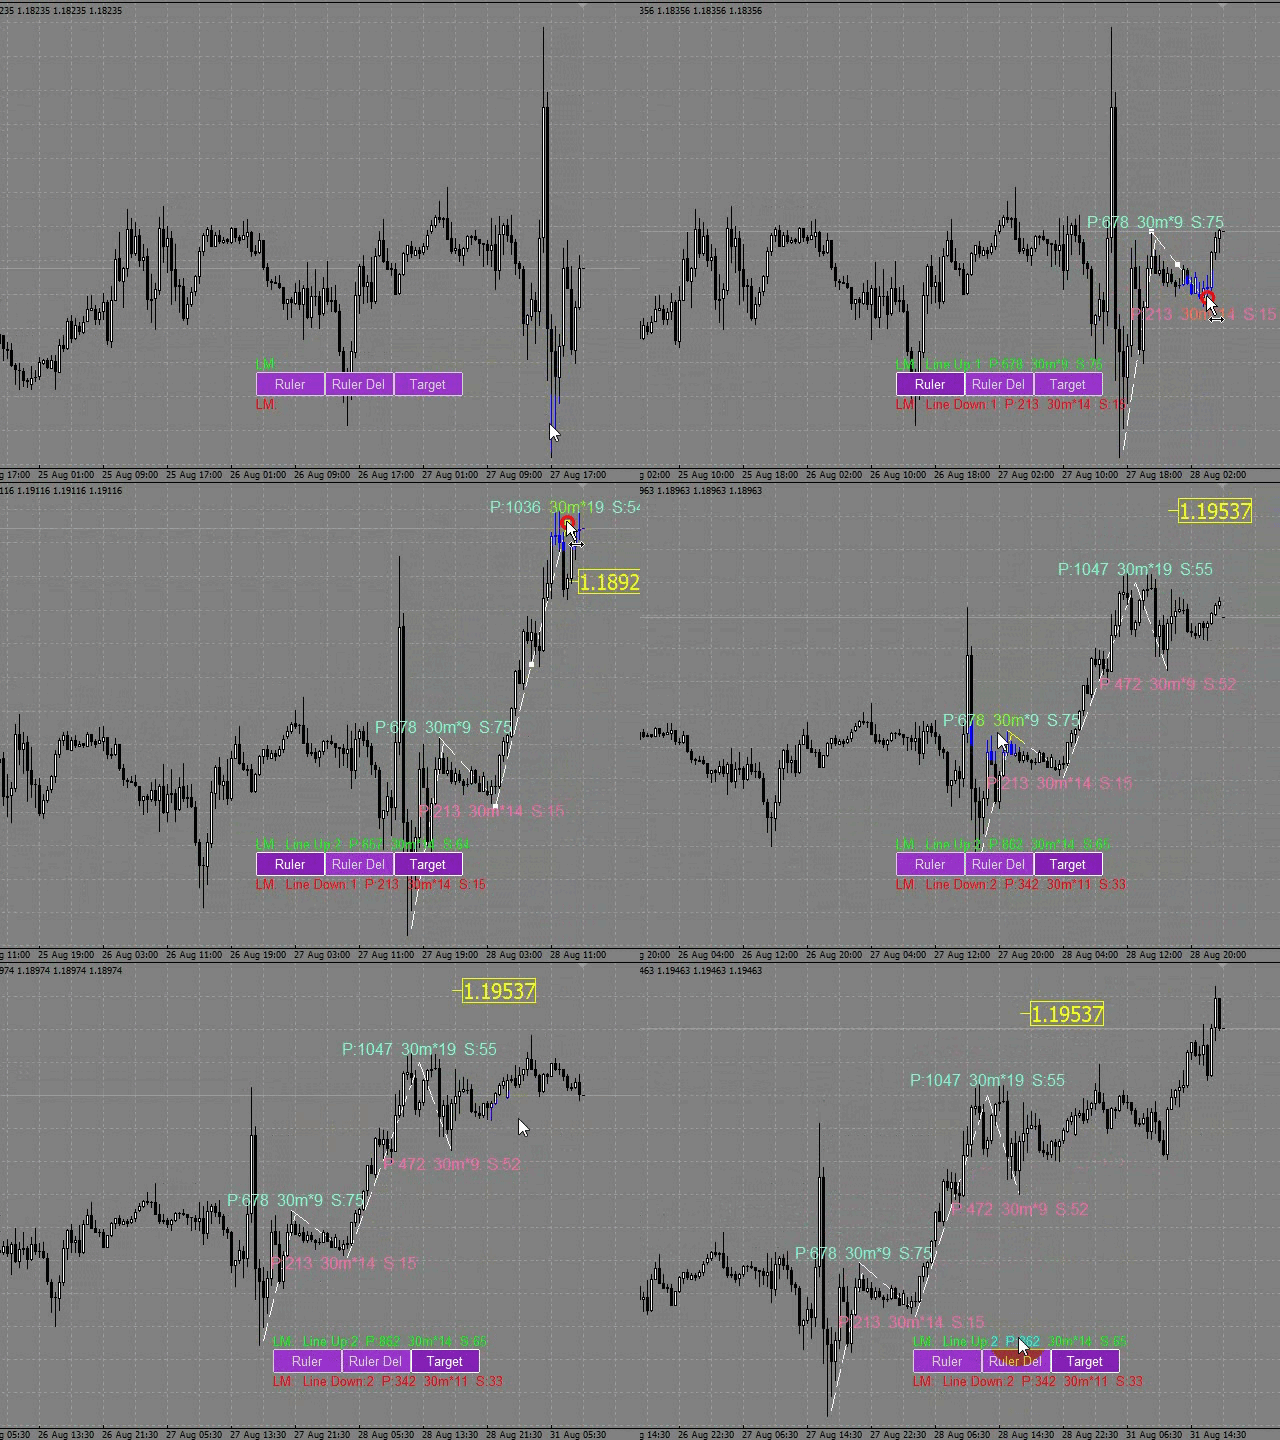
Lines are selected with 1 mouse click.


Building a line
: click the "Ruler" button and draw a line (clicking the mouse - the first point of the line, where the mouse is released - the second point of the line).
(Lines, text placemarks, and the goal are only visible on the time graph where they were drawn.)

Line changes: select a line and drag it with the mouse.
When you rebuild a line, the value of the text label and the goal (if the goal is enabled) will change immediately.

Delete all measurement lines: click "Ruler_Del". During the number of seconds selected in the "Ruler_Del_Cancel" setting, the "Ruler_Del" button can be clicked to cancel, and the "Ruler_Del" command will be canceled.

Delete the selected measurement lines: select the measurement line and press "delete" on the keyboard. The text label from the measurement line will also be removed, and the goal will change.

Building a goal: the "Target" button sets/deletes a goal. To calculate the goal, you need at least two lines in different directions.

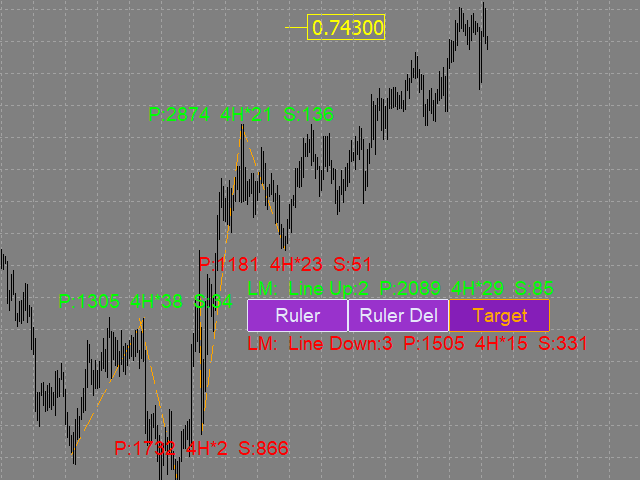
Line_Metrics - Text label of the line.
For example, we have an ascending line with the parameters: P:817 4H*10 S: 81. the line Length is 817 points, the line is drawn on a 4-hour chart, based on 10 candles, (that is, the time of the movement(line) is 40 hours).
The speed of the motion in paragraphs 81. This means that on average, each candle participating in the line construction passed 81 points.

Average_Lines_Metrics - Text label for "average values". LM: Line Up:3 P:1586 4H*40 S: 39 means that the text label of the average value is calculated based on 3 ascending measuring lines Line Up: 3 (measuring lines of 0 points, lines of other time periods and tools are not taken into account in the calculations).
The average line length in points is 1586 points P:1586.
The graph where the lines are counted is 4-hour 4H*40. On average, the line consists of 40 4h*40 candles.
On average, the price passes 39 points S:39 per candle.

The size of buttons and text labels for "average values" depends on the font in the Button_Font setting and its size in the Button_FontSize setting.
On-screen buttons can be dragged with the mouse.
You can assign keyboard shortcuts to on-screen buttons (a-Z, 0-9).

Settings

  • Ruler_key - hotkey for drawing a measuring line (you can assign (a-Z, 0-9)) .
  • Ruler_Del_key - hotkey for deleting all measuring lines (you can assign (a-Z, 0-9)) 
    (measurement lines are deleted after the pause selected in the Ruler_Del_Cancel setting).
  • Target_or_Target_Del_key - hotkey for setting / deleting a goal (a-Z, 0-9)
  • (you need at least two lines in different directions to set a goal).
  • Ruler_Del_Cancel - time to cancel the Ruler_Del_key command (in seconds).
  • Button_Background_Color - buttons background color (if Button_Background_Color=clrNONE, the buttons background is the same as the graph background color).
  • Button_Pressed_Color - color of the text and border of the Ruler button when pressed.
  • Line_Metrics_Indent - indent of the text label from the measuring line (in points).
  • Line_Metrics_Orientation - displays the labels of measuring lines vertically / horizontally / diagonally.
  • Target_Orientation - left-hand / right-hand placemark of the goal.
  • Here are the most important settings. You can also change the following characteristics for measuring lines, buttons, and text labels: color, thickness, font, and font size.
    推荐产品
    A Média Móvel é um indicador que faz parte da Análise Técnica. Com ela, é possível identificar o equilíbrio dos preços no mercado, observando tendências de alta, neutra ou baixa. Este indicador customizado traz opções extras pera definir o método de cálculo podendo-se esclolher entre SMA,EMA,SSMA,LWMA,JJMA,JurX,ParMA,T3,Vidya,AMA,HULL MA. Também conta com varias opções para escolher o método de cálculo para o preço base a ser usado no cáculo da média.
    ClusterSecondForex
    Rafil Nurmukhametov
    4.67 (3)
    该工具允许绘制不同类型的图表。 秒图从1秒到86400秒 从1滴答开始的滴答图 成交量图 三角洲图 仁科图 范围图 用于体积分析的内置指标。 产品演示 https://www.mql5.com/ru/channels/clustersecondforex 每日市场概况和所选时间框架的市场概况。 集群搜索。 不平衡。 VWAP。 动态POC、VAH、VAL 价格窗口简介 具有不同表现形式的垂直体积。 δ,有不同的可视化选项。 当前的和高的时间框架极 地下室蜡烛图指标 为了控制该图表,我们使用了 鼠标左键--移动图表,在设置中选择不同模式,调用位于屏幕左下角螺丝刀键图标下的主设置窗口。 鼠标右键 - 用于输入位于屏幕左上角图标下的图形结构的设置,以及绘制垂直、水平、趋势线和矩形的个别设置。 在图表区域旋转鼠标滚轮--左右移动图表,按住Ctrl键--上下移动图表,在价格比例区域--按价格比例,在时间轴区域--按时间比例。 H键--在图表上或体积区建立一条水平线(必须启用 "画水平线 "图标),Shift+H键--删除所有水平线。 V键 - 设置垂直线(必须启用 "画垂直线 "图标),S
    SolarTrade Suite 金融机器人:LaunchPad 市场专家 - 专为开启交易而设计! 这是一个使用特殊创新和先进算法来计算其价值的交易机器人,是您在金融市场世界中的助手。 使用我们来自 SolarTrade Suite 系列的指标集来更好地选择启动此机器人的时机。 在描述底部查看我们来自 SolarTrade Suite 系列的其他产品。 您想自信地驾驭投资和金融市场的世界吗? SolarTrade Suite 金融机器人:LaunchPad 市场专家是一款创新软件,旨在帮助您做出明智的投资决策并增加您的利润。 SolarTrade Suite 金融机器人的优势:LaunchPad 市场专家: - 准确计算:我们的机器人使用先进的算法和分析方法来准确预测市场走势。 计算购买和出售资产的最佳时机。 - 用户友好界面:直观的界面将使您能够轻松掌握程序并在安装后立即开始享受其好处。 - 专家支持:我们的专业团队随时准备为您解答任何问题,并为您提供有关使用该程序的建议。 立即试用 SolarTrade Suite 金融机器人:LaunchPad Market
    Mine Farm
    Maryna Kauzova
    Mine Farm is one of the most classic and time-tested scalping strategies based on the breakdown of strong price levels. Mine Farm is the author's modification of the system for determining entry and exit points into the market... Mine Farm - is the combination of great potential with reliability and safety. Why Mine Farm?! - each order has a short dynamic Stop Loss - the advisor does not use any risky methods (averaging, martingale, grid, locking, etc.) - the advisor tries to get the most
    VR Grid Mt5
    Vladimir Pastushak
    3.25 (8)
    VR 网格指示器 设计 用于创建具有用户定义设置的图形网格。与 标准网格 不同,VR 网格用于构建 圆形关卡 。根据用户的选择,轮次级别之间的步长可以是任意的。此外,与其他指标和实用程序不同,即使时间段发生变化或终端重新启动,VR Grid 也能保持网格的位置 。 设置、设置文件、演示版本、说明、问题解决,可以从以下位置获取 [博客] 您可以在以下位置阅读或撰写评论 [关联] 版本为 [MetaTrader 4] 垂直级别 基于实际时间间隔并 忽略缺失 或不存在的周期。因此,级别之间的步长严格对应于用户选择的值。 使用 VR 网格指标时,交易者 可以更改任何级别的垂直线和水平线的样式 、颜色和粗细。这使您可以控制金融工具的 回合水平 。 整数位是 以两个或多个零结尾 的价格(例如:1.23500、5.65900、1923.200)。人们相信,这样的水平 经常充当 作为支撑或阻力的强点。 Horizontal line settings Horizontal line step Horizontal line color Horizontal line style Horizonta
    FREE
    Arrow Micro Scalper 是一款专为剥头皮和短期交易而设计的指标,可集成到任何图表和金融工具(货币、加密货币、股票、金属)中。 在她的工作中,她使用波浪分析和趋势方向过滤器。建议在从 M1 到 H4 的时间范围内使用。 如何使用指标。 该指标包含 2 个用于更改设置的外部参数,其余参数已默认配置。 大箭头表示趋势方向的变化,蓝色箭头表示下降趋势的开始,粉红色箭头表示上升趋势的开始。 “ Only trending direction ”参数启用和禁用使用内部趋势的模式,提供使用您自己的趋势或不使用趋势的机会,并且还启用/禁用仅根据趋势显示趋势箭头和信号箭头。 小信号箭头,该指标最重要的对象,粉色代表“买入”交易,蓝色代表“卖出”交易。 “ Smoothing ”参数决定信号箭头出现的时间,操作范围为 7 到 25,为时间范围 M1-M5 选择大值,为 M15-H1 选择中值,为 H4 - D1 选择小值。 趋势箭头和开始信号箭头有警报。 指标不会重新绘制。
    Gold Zenix
    Md Billal Hossain
    隆重推出 ZENIX EA — 您的黄金市场精英伴侣 欢迎使用 ZENIX — 专为 XAU/USD(黄金)打造的新一代 EA。ZENIX 不仅仅是一个自动交易系统,更是一个精准的引擎,其使命只有一个: 凭借智能、灵活和强大的功能,主宰黄金市场。 ***限时特惠 - 即将结束*** 下次价格上涨至 200.46 美元 切勿错过以优惠价购买“Zenix”的机会。 每购买 5 次,价格将上涨 100 美元。 无论您是专业的散户交易者、信号提供商还是投资组合经理,ZENIX 都将彻底改变您的黄金交易方式——将波动转化为机遇,将风险转化为可衡量的控制。 第一阶段:核心理念——智能与黄金的碰撞 ZENIX 的核心是一个多层决策引擎,它: 像经验丰富的交易员一样,利用价格行为、波动性和动量动态解读市场。 从市场背景中学习,过滤噪音,避免假突破。 在统计上有利的区域以外科手术般的精准度执行。 这不是一个静态网格或随机入场机器人。这就是 ZENIX: ️ 为黄金而设计。由数据训练。为胜利而部署。 第二阶段:值得信赖的技术 自适应算法逻辑 ZENIX
    Advanced Trading Chaos
    Sergei Gurov
    5 (1)
    Advanced Trading Chaos  The main purpose of the indicator is to help the trader detect the signals described by Bill Williams in his books to make a quick and correct trading decision. 1)Bullish/Bearish Reversal Bar(BDB) 2) Divergent Bar(DB) 3) Second Sage Signal — the third consecutive Awesome Oscillator bar  4) Working fractals (Fractals that worked above/below the red forehead  5) Three bar coloring modes 5.1) Coloring of bars according to the AO indicator (Including the squatting bar) 5.2
    ICT Kill zone and Macros Indicator mark and display the following zone times on the chart: Kill zones   Kill zone Forex Asian London Open New York Open London Close Central Bank Dealing range Kill zone Indices Asian London Open New York AM New York Lunch New York PM Power Hour Macros London 1 London 2 New York Am 1 New York AM 2 New York Lunch New York PM 1 New York PM 2 Silver bullet London Open New York AM New York PM Sessions Asian London New York Chart The display of  Kill zone , Macro ,
    ClusterSecond
    Rafil Nurmukhametov
    4.78 (32)
    该工具允许绘制不同类型的图表。 秒图从1秒到86400秒 从1滴答开始的滴答图 成交量图 三角洲图 仁科图 范围图 用于体积分析的内置指标。 该工具的演示版 https://www.mql5.com/ru/channels/clustersecond 每日市场概况和所选时间框架的市场概况。 集群搜索。 不平衡。 VWAP。 动态POC、VAH、VAL 价格窗口简介 具有不同表现形式的垂直体积。 δ,有不同的可视化选项。 当前的和高的时间框架极 地下室指标烛台显示 也可以从图表中进行交易。 注意:该工具是为具有真实(交换)量的市场设计的。 它不适合外汇市场。它在VPS上不起作用。它在策略测试器中不起作用。 为了控制该图表,我们使用了 鼠标左键 - 移动图表,在设置中选择不同的模式,调用位于屏幕左下角带螺丝刀的钥匙图标下的主设置窗口。 鼠标右键 - 用于输入位于屏幕左上角图标下的图形结构的设置,以及绘制垂直、水平、趋势线和矩形的单独设置。 在图表区域旋转鼠标滚轮--左右移动图表,按住Ctrl键--上下移动图表,在价格比例区域--按价格比例,在时间轴区域--按时间比例。 H键--在
    Pro Experience Only 4 copies available for $99.00. Next price 199 USD ECN Pro Experience is a scalping strategy based on breaking through strong price levels. One of the oldest and most reliable strategies with the author's modernization for the current market. The strategy does not require any optimizations. We installed it on the chart according to the recommendation and enjoy trading!!! Advantages of ECN Pro Experience: - optimal SL/TP ratio - low SL, which makes the system as safe as possi
    ScalperGun
    Mikhail Nazarenko
    Scalper gun  - главное оружие для торговли скальпингом и свингом, с визуализацией и алертом точек входа. Индикатор работает как в трендовых, так и в нетрендовых рыночных условиях. Подходит начинающим и опытным трейдерам.  SCALPER GUN превосходит по скорости, качеству визуализации и точности входа популярные топовые индикаторы этого сайта!!! Перед покупкой скачайте демо Scalper gun и сравните с аналогичными индикаторами для скальпинга в тестере MT4. Особенности Это готовая торговая система с визу
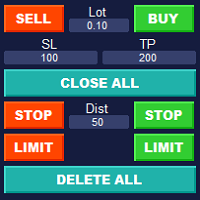
    Simple Customizable Trade Panel — Fast and Easy One-Click Trading This lightweight and powerful panel is built for traders who value   speed ,   simplicity , and   full customization . With just one click, you can: Buy or Sell instantly Close all open positions Place pending orders with custom distance Delete all pending orders Adjustable parameters: • Lot size • Stop Loss (in points) • Take Profit (in points) • Distance to price for pending orders The panel is fully responsive and ad
    Trade Manager DaneTrades
    Levi Dane Benjamin
    4.31 (26)
    交易管理器可帮助您快速进入和退出交易,同时自动计算风险。 包括帮助您防止过度交易、报复性交易和情绪化交易的功能。 交易可以自动管理,账户绩效指标可以在图表中可视化。 这些功能使该面板成为所有手动交易者的理想选择,并有助于增强 MetaTrader 5 平台。多语言支持。 MT4版本  |  用户指南+演示 交易经理在策略测试器中不起作用。 如需演示,请参阅用户指南 风险管理 根据%或$自动调整风险 可选择使用固定手数或根据交易量和点自动计算手数 使用 RR、点数或价格设置盈亏平衡止损 追踪止损设置 最大每日损失百分比,在达到目标时自动平仓所有交易。 保护账户免遭过多提款并阻止您过度交易 最大每日损失(以美元为单位)在达到目标时自动关闭所有交易。 保护账户免遭过多提款并阻止您过度交易 一键实现所有交易的盈亏平衡 自动计算从手机/电话发送的交易的风险 OCO 在设置中可用 交易和头寸管理 通过设置每月、每周、每天、每小时或每分钟的最大交易次数,停止过度交易和报复性交易。 高级挂单管理。 调整何时关闭挂单的规则 追踪挂单 支持市价订单和挂单 每日最大利润目标(以美元为单位)以确保头寸并停止
    DYJ MOBILE GAMING TRADING WINNER 可以使用您的各种终端(移动电话、浏览器、TRADINGVIEW、MT5)进行手动交易,然后由EA自动处理。 移动交易可以使用EA的各种网格模式、剥头皮模式、对冲套利模式和独立下单模式手动开仓, EA可以自动设置移动开仓的止损。并用手机开格、剥头皮、对冲订单。 EA可以设置全自动交易,设置自动和手机手动混合交易,或者设置独立的手机手动交易。 当订单方向正确时,TP 离场。 当订单方向错误时,EA可以将其从亏损转为盈利。 EA 适用于任何外汇经纪商和任何种类的交易。它与 Deriv 经纪商 Syntheic 账户品种兼容 EA不限制入金和杠杆大小,账户杠杆建议500或更高,建议入金5美元至10000或更高,建议使用最低交易量交易 推荐交易Boom 1000 Index趋势强,风险很低的品种 Input InpMagicNumber = 1935  InpPairs  = "GBPUSD,EURUSD"  -- comma-separated list of symbols to be traded. In
    Exp Tick Hamster MT5
    Vladislav Andruschenko
    3.59 (17)
    为 MetaTrader 5 的任何交易品种自动优化所有参数的专家。 无需设置的交易EA! 打钩 Hamster   - 这是一个 自动交易专家,适合不想设置顾问的新手和用户! 该交易顾问的交易策略已经测试了 7 年。 使用我们专为初学者设计的自动交易专家,让交易变得前所未有的简单。 告别设置交易顾问的麻烦,向无压力交易问好。 今天就开始使用,迈出成功交易的第一步。 MT4版本 详细描述   +DEMO +PDF 如何购买 如何安装     如何获取日志文件     如何测试和优化     Expforex 的所有产品 这个怎么运作? 下载; 安装在图表上; 顾问将自动交易; 留下评论。 如何设置专家? 您不需要自定义任何东西!我们为您准备好了一切! 1 设置参数 = Trading Lot 手数。 魔法       - 使用具有唯一职位编号的顾问。 (想定制还是购买?   TickSniper - 自动剥头皮 ,可以微调参数)! EA 算法与 ticksniper 相同,但删除所有设置以进行操作。一切都是自动配置的。 推荐交易账户: 推荐存款 低风险     1,000
    QQE Strike EP2
    Jakrawut Pratoom
    ️   QQE Strike EP2 “Smooth Momentum. Sharp Execution.”   Overview: Meet   QQE Strike EP2   — a powerful expert advisor built on the   Quantitative Qualitative Estimation (QQE)   indicator, tailored for traders who want clean momentum signals without the noise. QQE Strike is your smart execution partner: it detects trend momentum, filters out market chop, and strikes only when the odds are clearly in your favor. Whether you're a momentum rider or a reversal tactician, this EA provides acc

    QQE Strike EP3
    Jakrawut Pratoom
    ️   QQE Strike EP3 “Smooth Momentum. Sharp Execution.”   Overview: Meet   QQE Strike EP3   — a powerful expert advisor built on the   Quantitative Qualitative Estimation (QQE)   indicator, tailored for traders who want clean momentum signals without the noise. QQE Strike is your smart execution partner: it detects trend momentum, filters out market chop, and strikes only when the odds are clearly in your favor. Whether you're a momentum rider or a reversal tactician, this EA provides acc
    QQE Strike EP4
    Jakrawut Pratoom
    ️   QQE Strike EP4 “Smooth Momentum. Sharp Execution.”   Overview: Meet   QQE Strike EP4   — a powerful expert advisor built on the   Quantitative Qualitative Estimation (QQE)   indicator, tailored for traders who want clean momentum signals without the noise. QQE Strike is your smart execution partner: it detects trend momentum, filters out market chop, and strikes only when the odds are clearly in your favor. Whether you're a momentum rider or a reversal tactician, this EA provides acc
    QQE Strike EP1
    Jakrawut Pratoom
    ️ QQE Strike EP1 “Smooth Momentum. Sharp Execution.” Overview: Meet QQE Strike EP1 — a powerful expert advisor built on the Quantitative Qualitative Estimation (QQE) indicator, tailored for traders who want clean momentum signals without the noise. QQE Strike is your smart execution partner: it detects trend momentum, filters out market chop, and strikes only when the odds are clearly in your favor. Whether you're a momentum rider or a reversal tactician, this EA provides accurate entrie
    Blahtech Market Profile MT5
    Blahtech Limited
    5 (10)
    Was: $249  Now: $149   Market Profile defines a number of day types that can help the trader to determine market behaviour. A key feature is the Value Area, representing the range of price action where 70% of trading took place. Understanding the Value Area can give traders valuable insight into market direction and establish the higher odds trade. It is an excellent addition to any system you may be using. Inspired by Jim Dalton’s book “Mind Over Markets”, this indicator is designed to suit the
    TickData Recorder (v1.3): Real Ticks Recording for Reliable Backtesting in MT5 Elevate the accuracy of your strategy testing significantly! Tired of unrealistic backtest results on standard MetaTrader 5 data that don't match your broker's conditions? "TickData Recorder" is your tool to solve this problem. This Expert Advisor meticulously records   every single tick price change   (time with milliseconds, Bid, Ask, Last, Volume) directly from   your broker's   server (FTMO, RoboForex, IC Markets,
    VisualVol
    Maxim Kuznetsov
    The indicator highlights the points that a professional trader sees in ordinary indicators. VisualVol visually displays different volatility indicators on a single scale and a common align. Highlights the excess of volume indicators in color. At the same time, Tick and Real Volume, Actual range, ATR, candle size and return (open-close difference) can be displayed. Thanks to VisualVol, you will see the market periods and the right time for different trading operations. The indicator displays: T
    King Sniper EA
    Ivan Bebikov
    5 (9)
    Monitoring of real trading Advisor -  https://www.mql5.com/en/signals/2264971 My other products    -      click here Keep in mind that the results on different brokers may differ, I recommend testing on your broker before using it (you can ask me for a list of recommended brokers in the PM). Read the blog post with the description of the adviser before starting work and if you have any additional questions, write to me in the PM. A fully automatic Expert Advisor that does not require additional
    该指标的独特之处在于交易量核算算法:在所选时段内直接进行累积,而无需参考当天的开始。可以从计算中排除最后的柱线,那么当前数据对之前形成的显着水平(交易量)的影响较小。 为了更精确的计算,默认使用 M1 图表中的数据。规范了价格量的分配步骤。默认情况下,显示的右边框设置为用于分析的数据开头对应的栏,但如果需要,可以设置为您需要的栏。显示的音量带的长度(右边界)由系数调节,也可以向左或向右移动到 0(当前)条或参照当前条进行镜像。 参数: Accumulation period -  累积量计算周期 Number of excluded last bars - 从计算中排除的最后一根柱线的数量   Accumulation price step - 按价格参数的成交量总和步骤 Graph length multiplier -  显示数据的长度比例 Use data from timeframe - 用于分析的图表(时间范围) Graph show shift - 开始显示数据的移位,如果留为0,则数据将从分析数据周期开始时间对应的条开始显示; “-1”——显示在左侧; “-2” - 显示
    Supply Demand areas
    Makarii Gubaydullin
    供需区域:价格过去多次接近的可观察区域。 多功能工具:  66+ 功能 ,包括此指标  |   联系我  如有任何问题  |  MT4版本 该指标显示价格可能再次反转的区域。 通常,价格从某一水平被拒绝的次数越多,该水平就越重要。 在输入设置中   您可以调整: 启用或禁用   弱势区域; 显示或隐藏   区域描述; 字体大小; 设置   基本颜色:   分别针对支撑和阻力: 选定的颜色对弱势区域将较不强烈,助于您视觉上分析图表; 计算区域的时间框架; 多功能工具:  66+   功能 ,包括此指标  |   联系我  如有任何问题  |    MT4版本 多功能工具:  66+   功能 ,包括此指标  |   联系我  如有任何问题  |    MT4版本 多功能工具:  66+   功能 ,包括此指标  |   联系我  如有任何问题  |    MT4版本 //-----------
    WanaScalper
    Isaac Wanasolo
    1 (1)
    A scalping indicator based on mathematical patterns, which on average gives signals with relatively small SL, and also occasionally helps to catch big moves in the markets (more information in the video) This indicator has three main types of notifications: The first type warns of a possible/upcoming signal on the next bar The second type indicates the presence of a ready signal to enter the market/open a position The third type is for SL and TP levels - you will be notified every time price re
    Gold Venamax MT5
    Sergei Linskii
    2.67 (3)
    Gold Venamax - 這是最好的股票技術指標。 此指標演算法分析資產的價格變動並反映波動性和潛在的進入區域。 指標特點: 這是一個帶有 Magic 和兩個趨勢箭頭塊的超級指標,可實現舒適且有利可圖的交易。 圖表上顯示用於切換方塊的紅色按鈕。 Magic 在指標設定中進行設置,以便您可以將指標安裝在顯示不同區塊的兩個圖表上。 Gold Venamax 可以放置在具有不同箭頭緩衝區(GV 和 SD)的兩個圖表上。 為此,您需要在設定中選擇不同的 Magic,例如,一個具有 Magic = 999,另一個具有 Magic = 666。接下來,您可以使用圖表上的紅色按鈕選擇箭頭緩衝區。 指標設定中的每個箭頭緩衝區(GV и SD)都有一個單獨的箭頭過濾器,以實現舒適且有利可圖的交易(UseFiltrGV = true; 和 UseFiltrSD = true;)。 進入的最佳訊號 = 遵循兩個緩衝區的訊號箭頭(GV 和 SD)+ 所有三個 MA 線(紅色或藍色)的方向 + TMA 通道邊界(下或上)。 TMA 通道邊界(下限或上限)也可用於鎖定利潤和/或以較短的停損位進行逆勢風險交
    Multi Symbol Trailing
    Vladimir Karputov
    5 (1)
    “ 多交易品种尾随 ”实用程序为所有当前未平仓头寸移动止损(多交易品种尾随)。它主要用于协助手动交易。实用程序没有货币对名称或个人标识符(幻数)的限制 - 该实用程序绝对处理所有当前未平仓头寸。 “   Trailing Stop   ”和“   Trailing Step   ”参数的计量单位是点(1.00055 的价格与 1.00045 的价格之间的差值为 10 点)。 使用该实用程序的典型场景(观看视频): 起初,市场上没有未平仓头寸。该实用程序附加到最活跃的图表(例如,“EURUSD”)。然后用户手动开仓(视频中的示例:在“GBPUSD”、“XAUUSD”、“NZDUSD”和“AUDCAD”上开仓)。一旦开仓,“ 多品种尾随 ”实用程序会立即设置止损。 注意 :止损是从距离“ 经典追踪止损” 的头寸开盘价开始设置的! 随着价格朝着有利的方向移动,实用程序会移动该位置的止损。 额外: * 现在在策略测试器中(仅在策略测试器中),以最小手数开立“买入”仓位。这允许用户测试该实用程序。 * 现在提供一种新的追踪类型:“盈亏平衡追踪”。如果仓位已达到盈利,则第一次将止损移至“盈亏平
    Maximum Trend Arrows OT MT5
    Mulweli Valdaz Makulana
    STRICTLY FOR BOOM INDEX ONLY!!!!! Here I bring the Maximum Trend Arrows OT1.0 MT5 indicator. This indicator is made up of a combination of different trend indicators for entries and exits, for entries an orange arrow will paint on the chart below the current market and a red flag for closing of trades and it produces buy arrows only. When the orange arrow appears, it will appear along with it's sound to notify you. The 1H timeframe is recommended, don't use it anywhere else than on the 1H timefr
    该产品的买家也购买
    Trade Assistant MT5
    Evgeniy Kravchenko
    4.42 (185)
    它有助于计算每笔交易的风险,容易安装新的订单,具有部分关闭功能的订单管理, 7 种类型的追踪止损和其他有用的功能。   附加材料和说明 安装说明   -   应用程序说明   -   模拟账户应用程序的试用版 线条功能  - 在图表上显示开仓线、止损线、止盈线。 有了这个功能,就可以很容易地设置一个新的订单,并在开仓前看到它的附加特性。   风险管理  - 风险计算功能在考虑到设定的风险和止损单的大小的情况下,计算新订单的成交量。它允许你设置任何大小的止损,同时观察设定的风险。 批量计算按钮 - 启用 / 禁用风险计算。 在 " 风险 " 一栏中设置必要的风险值,从 0 到 100 的百分比或存款的货币。 在 " 设置 " 选项卡上选择风险计算的变量: $ 货币, % 余额, % 资产, % 自由保证金, % 自定义, %AB 前一天, %AB 前一周, %AB 前一个月。   R/TP 和 R/SL - 设置止盈和止损的关系。 这允许你设置相对于损失的利润大小。 例如, 1 : 1 - 这决定了 TP = SL 的大小。 2 : 1 - 这意味着 TP 是 SL 的两倍。 RR -
    欢迎来到 Trade Manager EA——这是一个终极风险管理工具,旨在使交易变得更直观、精准和高效。它不仅仅是一个下单工具,而是一个用于无缝交易计划、仓位管理和风险控制的全面解决方案。不论您是新手交易员、资深交易员,还是需要快速执行的剥头皮交易员,Trade Manager EA 都可以满足您的需求,适用于外汇、指数、大宗商品、加密货币等各种市场。 借助 Trade Manager EA,复杂的计算已成过去。只需分析市场,在图表上用水平线标记入场、止损和止盈,设置您的风险水平,Trade Manager 就会立即计算出理想的头寸规模,并实时显示以点、账户货币计价的止损和止盈。每笔交易都得以轻松管理。 主要功能: 头寸规模计算器 :根据定义的风险瞬间确定交易规模。 简单的交易计划 :在图表上用可拖动的水平线直接计划交易,设置入场、止损和止盈。 实时显示 SL 和 TP :以账户货币、点或分显示止损和止盈,便于分析。 高级保护工具 盈亏平衡选项 : 基本盈亏平衡 :当您的交易达到设定水平时自动保护利润。 多级盈亏平衡 :设置多达 4 个级别以逐步保护利润。 尾随止损选项 : 基本尾随
    EasyInsight AIO MT5
    Alain Verleyen
    5 (5)
    EASY Insight AIO – 全能智能交易一站式解决方案 概述 想象一下,您可以在几秒钟内扫描整个市场——外汇、黄金、加密货币、指数,甚至股票——无需手动筛选图表、繁琐安装或配置指标。 EASY Insight AIO 是您专为 AI 交易打造的即装即用数据导出工具。它将整个市场快照一次性输出为简洁的 CSV 文件,直接支持 ChatGPT、Claude、Gemini、Perplexity 等各类 AI 平台的即时分析。 无需窗口切换,无需图表叠加,也没有任何杂乱。只需纯净、结构化的数据自动导出,让您专注于基于数据的高效决策,无需再盯盘耗时。 为什么选择 EASY Insight AIO? 真正的一体化 • 无需设置,无需安装指标,无图表叠加。只需安装、运行并导出——就是这么简单。 多资产全覆盖 • 扫描分析外汇、金属、加密货币、指数、股票——您的券商所能提供的一切市场。 AI 专属数据导出 • 高度结构化、针对 AI 优化的 CSV 文件,直接适配主流智能工具和平台。 完整导出内容: • 三个可选周期的货币强度分析 • 净多头头寸变化体现市场情绪 • 成交量变化、
    TradePanel MT5
    Alfiya Fazylova
    4.84 (134)
    交易面板是一个多功能的交易助手。该应用程序包含超过 50 个用于手动交易的交易功能,并允许您自动化大多数交易操作。 注意,该应用程序在策略测试器中不起作用。购买之前,您可以在模拟帐户上测试演示版本。演示版 这里 。 完整说明 这里 。 贸易。 让您一键执行交易操作: 通过自动风险计算打开挂单和仓位。 一键打开多个订单和仓位。 打开订单网格。 按组关闭挂单和持仓。 头寸反转(关闭买入并打开卖出或关闭卖出并打开买入)。 锁定头寸(开立额外头寸,以平衡买入和卖出头寸的交易量)。 一键部分平仓所有仓位。 为同一价格水平的所有头寸设置止盈和止损。 将所有头寸的止损设置为该头寸的盈亏平衡水平。 开单建仓时,您可以应用以下功能: 计算交易量的多个订单或仓位之间的分布(一键开仓多个订单或仓位时)。 图表上未来订单交易水平的可视化。 设置开仓时允许的最大点差大小。 止盈和止损之间的自动比率。 虚拟止损和止盈。 根据当前点差的大小自动增加止损和止盈的大小。 根据 ATR 指标的读数计算止盈和止损。 设置挂单的到期日期。 挂单设置为“追踪”(挂单自动跟随当前价格移动指定距离)。 管理通过移动终端(手机)开立
    Telegram To MT5 Receiver
    Levi Dane Benjamin
    4.77 (13)
    将信号从您所属的任何渠道(包括私人和受限渠道)直接复制到您的 MT5。 该工具在设计时充分考虑了用户的需求,同时提供了管理和监控交易所需的许多功能。 该产品采用易于使用且具有视觉吸引力的图形界面。 自定义您的设置并在几分钟内开始使用该产品! 用户指南 + 演示  |   MT4版本  |   不和谐版本 如果您想尝试演示,请参阅用户指南。 Telegram To MT5 接收器在策略测试器中不起作用! Telegram 至 MT5 功能 一次复制多个通道的信号 从私人和受限频道复制信号 不需要机器人令牌或聊天 ID(如果出于某种原因需要,您仍然可以使用这些) 使用风险百分比或固定手数进行交易 排除特定符号 选择复制所有信号或自定义要复制的信号 配置单词和短语以识别所有信号(默认值应适用于 99% 的信号提供商) 配置时间和日期设置以仅在需要时复制信号 设置一次打开的最大交易量 交易和头寸管理 使用信号或自动设置的管理 通过设置每月、每周、每天、每小时或每分钟的最大交易次数,停止过度交易和报复性交易。 支持市价订单和挂单 每日最大利润目标(以美元为单位)以确保头寸并停止过度交易 确
    The product will copy all telegram signal to MT5 ( which you are member) , also it can work as remote copier.  Easy to set up, copy order instant, can work with almost signal formats, image signal,  s upport to translate other language to English Work with all type of channel or group, even channel have "Restrict Saving Content", work with  multi channel, multi MT5 Work as remote copier: with signal have ticket number, it will copy exactly via ticket number. Support to backtest signal. How to s
    All in one Keylevel
    Trinh Minh Tung
    5 (1)
    Instead of sticking to the Charts,let's use ALL IN ONE KEYLEVEL Announcement: We are pleased to announce the latest version 14.02 of the One In One Keylevel product. This is a reliable product that has been upgraded with many new features and improvements to make your work easier and more efficient. Currently, we have a special promotion for this new version. The current discounted price is $500, and there are only 32 units left. After that, the price will increase to $1000, and will continue to
    Trade Assistant 38 in 1
    Makarii Gubaydullin
    4.9 (21)
    多功能工具:超过65个功能,其中包括:手数计算,价格行为,盈亏比,交易管理,供需区域。 演示版   |   用户手册   |  MT4版 任何问题 / 改进意见 / 如果发生了故障或错误    都可以联系我 该实用程序在策略测试器中不起作用:您可以在此处下载 演示版来测 试产品。 交易功能需要允许自动交易(包括经纪商方面) 简化,加快并且自动化你的交易过程。利用这款工具的控制功能就能增强普通交易端的执行力。 建立一笔新的交易:手数 / 风险 / 盈亏计算 1. 手数计算工具 (基于风险规模的交易量计算) 2. 风险计算工具 (基于手数大小的风险额计算) 3. 盈亏比 4. 订单的激活和触发,买入或卖出限价/买入或卖出止损 5. 虚拟的止损/止盈 (隐藏的止损,止盈:交易商不可见) 6.  智能的止损/入场点:当价格柱在收盘时已超越了才入场 (避免无效触发) 7. 隐藏掉挂单 (虚拟的订单) 8. 预订挂单:在市场关闭的时候你也可以下挂单 (适合周末做计划的交易者) 9. 额外的多级止盈 (一笔订单同时有多个止盈) 10. OCO(二择一委托)订单,拥有不同的订单号 11. 在图表上的
    Advanced trading tool: One click smart orders that execute under your conditions Developed by trader for trading community:  position size calculator (lot size), open position after price action, strategy builder, set and forget trading, mobile notifications... Risk Management -  Risk percentage position size calculator, gain percentage, target risk reward ratio, spread and commissions are included in calculations 7 Advanced order types  - Set and forget trading with price action automation (OC
    ******************************* ***************** ********************** ***************** ********************** ************************* GoldMine Train 是一款针对黄金的趋势交易策略 EA。 操作员确定主要趋势方向并指示Train前进。 Train 将在该方向连续买入/卖出, 手数取决于账户余额和预设的杠杆比率。 当操作员改变趋势方向时,Train将停止并锁定利润。 用户可以使用图表上的按钮轻松选择趋势方向。 ******************************* ***************** ********************** ***************** ********************** *************************
    Remote Trade Copier is an advanced tool designed for efficiently copying trades between accounts in both local and remote modes. It allows for lightning-fast order replication from a master account to a slave account. In local mode, trades are copied instantly, while in remote mode, the copying process takes less than 1 second. Local mode refers to both MetaTrader platforms being installed on the same system, whereas remote mode enables copying between MetaTrader installations on separate syste
    RiskGuard Management
    MONTORIO MICHELE
    5 (22)
    注意 :该智能交易系统无法在策略测试器中运行。若需试用版本,请访问我的个人资料。 用户手册 要下载自动日志,请访问我的个人资料 RiskGuard Management – 专业交易,无需妥协 RiskGuard Management 是每位希望通过高级风险管理实现利润最大化、亏损最小化的交易者的终极助手。它不仅仅是一个工具,更是一个智能系统,帮助你严格执行交易计划,避免情绪化错误,以最高效率进行操作。 全面资金保护 动态计算手数的高级风险管理 自动平仓功能,确保遵守每日交易计划 Quantum 技术优化每一笔交易的风险 专业级分析和报告,包含数据导出与自动日志功能 Quantum:改变游戏规则的创新功能 Quantum 是一项革命性功能,通过分析你的交易数据和当前回撤,为每笔交易计算最优风险。效果如何?在相同回撤条件下,利润最多可提升至传统风险管理的 4 倍。 不再是固定风险,而是智能风险。Quantum 会根据你的交易风格自动调整,始终为你提供最佳设置。 高级功能,打造可控且安全的交易体验 自动手数计算 — 设置百分比或固定金额的风险,RiskGuard 自动帮你计算 止损锁定
    Features   With MT5 to Interactive Brokers(IB) Trader, you can: 1. Load chart data from IB to MT5, and Analyze with all standard or customer Indicators. 2. Place Orders to IB Account Directly in MT5. 3. Make your Own EAs upon IB Securities by only making minus changes of the trading function. Usage 1) Installation Copy the "Mt5ToIBTraderEn.ex4" and sample files to [MT5 Data Folder]->MQL5->Experts.  2)  MT5 Settings Add the IP Address to the MT5 Allowed URLs in 'Tools->Options->Expert Adviso
    HINN Lazy Trader
    ALGOFLOW OÜ
    5 (2)
    Community, update news, feature discussions, complaints, suggestions, and first-line support are organized in a free Discord server . Use  Webmoney  to pay in crypto. Lazy Trader is your personal risk management assistant that independently finds the best market entries, manages positions, and helps you extract maximum profit from every trading idea! It monitors charts from M1 to W1 , finds optimal entry points based on your parameters, and manages trades without your involvement: -   Got an
    YuClusters
    Yury Kulikov
    4.93 (41)
    Attention: You can view the program operation in the free version  YuClusters DEMO .  YuClusters is a professional market analysis system. The trader has unique opportunities to analyze the flow of orders, trade volumes, price movements using various charts, profiles, indicators, and graphical objects. YuClusters operates on data based on Time&Sales or ticks information, depending on what is available in the quotes of a financial instrument. YuClusters allows you to build graphs by combining da
    Ultimate Trade Copier MT5
    BLAKE STEVEN RODGER
    5 (2)
    This trade copy utility allows you to instantly and seamlessly replicate and synchronize unlimited orders from multiple master accounts to multiple slave accounts on your local machine. You can create custom channels (or portfolios) with advanced filtering capabilities to copy from multiple master accounts to multiple slave accounts. Moreover, you can tailor these channels with a range of lot sizing and trade condition options to ensure that copied trades outperform the original source. You can
    The product will copy all  Discord  signal   to MT5   ( which you are member  ) , also it can work as remote copier.  Easy to set up. Work with almost signal formats, support to translate other language to English Work with multi channel, multi MT5. Work with Image signal. Copy order instant, auto detect symbol. Work as remote copier: with signal have ticket number, it will copy exactly via ticket number. How to setup and guide: Let read all details about setup and download Discord To MetaTrader
    Ultimate Trailing Stop EA MT5
    BLAKE STEVEN RODGER
    4.13 (8)
    This EA Utility allows you to manage (with advanced filtering) unlimited open orders (manual or EA) with 16 trailing stop methods: fixed, percent, ATR Exit, Chandelier Exit, Moving Average, Candle High Low Exit, Bollinger Bands, Parabolic, Envelope, Fractal, Ichimoku Kijun-Sen, Alligator, Exit After X Minutes or Bars, RSI and Stochastic. The trailing stop can be either real or virtual, and you can exit fully or with a partial close percent on touch or bar close.  Moreover, you can add (override
    Crypto Charting
    Rajesh Kumar Nait
    5 (3)
    Crypto Charting for MT5 – MetaTrader 5 加密货币图表集成工具 概述 Crypto Charting for MT5 通过 WebSocket 提供实时 OHLC 图表数据。支持多家交易所,并可在 MT5 中自动更新历史数据。 功能 实时 WebSocket 数据传输 自动历史数据同步 网络中断后的计划更新 兼容所有 MT5 时间周期 支持 OHLCV 数据格式 支持策略测试器 自动重新连接 支持的交易所 Binance, Bybit, OKX, KuCoin, MEXC, Gate.io, Bitget, XT.com 补充说明 如需获取 Tick 数据和深度数据,可查看名为 Crypto Ticks 的相关产品。 注意事项 不使用 DLL,适用于 VPS 环境。 Strategy Tester 不支持 WebRequest 功能。 如需试用版本,请通过 MQL5 私信联系作者。 Full Documentation & Setup Guide : Click Here
    This Expert Advisor waits a position to be opened, no matter if you open manually or with the EA buttons or eventually via mobile: it creates a Grid in Anti Martingale with pending stop orders in the same direction of the first position. You can specify the number of orders, the size and the distance between the orders. You can also adjust the Monetary Target of the Grid, the monetary Stop Loss, the Intermediate Target (when reached the EA insert an order with opposite direction of the total pos
    Wouldn't it be great if AI had a second look at your trading data — graphics, indicators, and beyond? Introducing AI Trading Station , a revolutionary utility seamlessly integrated with the MetaTrader platform. Powered by the advanced intelligence of OpenAI's ChatGPT, this complete solution covers every step of your trading journey, from data gathering to trade execution. The Complete Trading Process. Reinvented Data Gathering & Visualization: Collect and display vital market data on intuitive
    Trade Copy is an EA-shaped tool that replicates the trades done on a Meta Trader 5 to all Meta Traders 5 opened on same computer. Is useful if you want to trade more than once account yours or if you want to work with third party account management. Demo version:  https://www.mql5.com/pt/market/product/40906 MT4 version:  https://www.mql5.com/pt/market/product/40902/ Configurations: MAIN OPTIONS Idiom - change to English or Portuguese. Copy trades from - specify if the trades will be copied fro
    Bots Builder Pro MT5
    Andrey Barinov
    4.29 (7)
    This is exactly what the name says. Visual strategy builder . One of a kind. Turn your trading strategies and ideas into Expert Advisors without writing single line of code. Generate mql source code files with a few clicks and get your fully functional Expert Advisors, which are ready for live execution, strategy tester and cloud optimization. There are very few options for those who have no programming skills and can not create their trading solutions in the MQL language. Now, with Bots Builde
    The program is use to copy trading from MT5 to MT4 and MT5 on local PC or copy  over the Internet .  Now you can easy copy trades to any where or share to friends. Only run one Flash Server on VPS, also need allow the apps if you turn on Windows Firewall. Can not add more than 20 account copier to server at same time,  include both  MT4 and MT5 Get free Copier EA  for MT4 and MT5 (only  receive signal), download here Instants copy, speed smaller 0.1 seconds, easy to setup How to setup and guide
    Comprehensive on chart trade panel with the unique ability to be controllable from mobile as well. Plus has a library of downloadable configuration, e.g. exit rules, extra panel buttons, pending order setup and more. Please see our product video. Works with all symbols not just currency pairs. Features On chart panel plus controllable from free app for Windows, iPhone and Android Built-in script engine with library of downloadable configuration, e.g. add 'Close All Trades in Profit' button, exit
    Live Forex Signals 专为现场信号交易而设计   https://live-forex-signals.com/en 和  https://foresignal.com/en . Live Forex Signal for MetaTrader 4   https://www.mql5.com/en/market/product/81445 参数 如果您已订阅网站,则用户名和密码live-forex-signals.com/foresignal.com ,然后您应该使用您的凭据填写这些参数;如果没有订阅,则将字段留空; 评论对正在开启的交易的评论 风险风险作为交易存款的百分比,如果风险=0,则使用价值地段 固定交易量 使用获利使用从网站获利 UseStopLoss从网站使用止损 FrequencySignalUpdateInMinute顾问访问网站的频率 交易的最大点差交易的最大允许点差,如果点差较高,则设置的挂单被取消 使用追踪止损 TrailingStop跟踪止损的值以点为单位 为了使实时外汇信号正常工作,您需要放置网站地址 https://live-forex
    Active Lines
    Yury Kulikov
    5 (2)
    Attention: Demo version for review and testing can be downloaded here . It does not allow trading and can only be run on one chart. Active Lines - a powerful professional tool for operations with lines on charts. Active Lines provides a wide range of actions for events when the price crosses lines. For example: notify, open/modify/close a position, place/remove pending orders. With Active Lines you can assign several tasks to one line, for each of which you can set individual trigger conditions
    What Exactly Is A Smart Trading Tool? Smart Trading Tool   was developed for fast and comfortable trading of the financial markets especially for   ORDER BLOCKS TRADERS .   It provides traders functionalities, such as: A Drawing Tool One-Click Trading Panel Automated Lot Sizes Calculation   based on your risk appetite & Money Management ( Watch this video , how this tool can help manage your risk per trade better!) Built in PRICE LEVELS (Fibonacci, Round Numbers, Daily hi-low, etc) Shows Trading
    Mentfx Mmanage mt5
    Anton Jere Calmes
    4.25 (8)
    The added video will showcase all functionality, effectiveness, and uses of the trade manager. Drag and Drop Trade Manager. Draw your entry and have the tool calculate the rest. Advanced targeting and close portions of a trade directly available in tool (manage trades while you sleep). Market order or limit order on either side with factored spread. Just draw the entry, the tool does the rest. Hotkey setup to make it simple. Draw where you want to enter, and the stop loss, the tool calculates al
    Patrex pro
    Chioma Obunadike
    5 (1)
    Patrex Pro: Maximize Your Trading Potential Patrex Pro is an advanced trading bot designed to help traders optimize their trading strategies and maximize their potential returns. With its cutting-edge technology and user-friendly interface, Patrex Pro is the ultimate tool for traders seeking to elevate their trading game. Get MT4 Version Key Features: 1. Position Hedging: Patrex Pro allows users to hedge their positions based on their individual risk tolerance and market analysis. 2. Advanced R
    作者的更多信息
    Trend Sync MT5
    Pavel Verveyko
    The indicator shows the trend of 3 timeframes: higher timeframe; medium timeframe; smaller (current) timeframe, where the indicator is running. The indicator should be launched on a chart with a timeframe smaller than the higher and medium ones. The idea is to use the trend strength when opening positions. Combination of 3 timeframes (smaller, medium, higher) allows the trend to be followed at all levels of the instrument. The higher timeframes are used for calculations. Therefore, sudden change
    Turn
    Pavel Verveyko
    The indicator shows the market turning points (entry points). Reversals allow you to track rebound/breakout/testing from the reverse side of the lines of graphical analysis or indicators. Reversals can be an independent signal. The indicator allows you to determine reversals taking into account the trend and without it. You can choose a different period for the movement preceding the reversal, as well as the volatility coefficient. When plotting reversals, the indicator takes into account volati
    Length Movement
    Pavel Verveyko
    5 (1)
    Measures the length of the selected movement in points, shows the duration of the movement, as well as the speed of movement.   Outputs the average value of each dimension. It is designed to calculate the expected target based on typical market movements. The intended goal will provide information about the ratio of the stop size to the possible profit and will allow you not to open positions with a small expected profit. It will also help you determine the point at which it is more logical to c
    The indicator allows you to quickly switch from one instrument to another, from one time period to another using the keyboard or buttons on the monitor. Each command can be assigned a hot key from 0-9, a-Z (case-insensitive) and VK_OEM_COMMA ("<" on the keyboard) and VK_OEM_PERIOD (">" on the keyboard). This can help you to operate the maximum number of instruments that are available at your broker, analyze more instruments/periods in less time. This product cannot be tested in the tester , beca
    Ratio TP SL
    Pavel Verveyko
    5 (1)
    This indicator allows you to measure the profitability of each specific transaction (the ratio of Stop and Profit). The indicator allows you to adjust the ratio by step size and number of steps. You can build an unlimited number of ratios to compare the risks from different movements. Note: in MT4, the number of horizontal lines in a single ratio cannot exceed 32. Building a line : click the " Ratio " button and draw a line (mouse click - the first point of the line, where the mouse is release
    Corporate Report
    Pavel Verveyko
    5 (1)
    The script displays info about the share's corporate reports and dividends. The data is downloaded from   investing.com : Report date Profit per share (EPS) Revenue Market capitalization Amount of dividends Date of payment of dividends Dividend income The product cannot be tested in the tester (since it is not possible to receive data from the Internet). Before launching:  Add 2   URL   https://ru.investing.com/earnings-calendar/Service/getCalendarFilteredData  and   https://ru.investing.com/di
    Channel FTF
    Pavel Verveyko
    The Envelopes indicator determines the presence of a trend or flat. It has 3 types of signals, shows the probable retracement levels and levels of the possible targets. The Fibonacci coefficients are used in the indicator's calculations. Signals (generated when touching the lines or rebounding from lines): Trend - the middle line of the Envelopes has a distinct inclination; the lines below the channel's middle line are used for buy trades, the lines above the middle line and the middle line itse
    Mr Big
    Pavel Verveyko
    The indicator shows and highlights the chart candles, which are formed as a result of large players entering the market in large volumes. Such candles can also be formed after achieving a certainty on the market, when most of the participants hold positions in the same direction. The movement is likely to continue in that direction after such candles. The indicator highlights the significant candles from the existing ones on the chart; The indicator allows identifying the trends based on candles
    Splash
    Pavel Verveyko
    The indicator identifies the most suitable moment for entering the market in terms of market volatility, when the market has the strength to move (the signal is indicated by an arrow under the candle). For each of the signals, the presence of trends on the current and higher timeframes is determined, so that the signal is in the direction of the majority of positions opened on the market (denoted near the signal by abbreviations of timeframes with a trend present). The signal appears after the c
    The indicator displays the key support and resistance levels on the chart. The significance of these levels lies in that the price may reverse or strengthen the movement when passing such levels, since they are formed as a consequence of the natural reaction of market participants to the price movement, depending on which positions they occupied or did not have time to occupy. The psychology of the level occurrence: there always those who bought, sold, hesitated to enter or exited early. If the
    This indicator is a multitimeframe trading strategy. It has the levels for stop loss, take profit and entry point. The order level can also be set manually. The indicator uses the regularity of the market, which manifests itself on all instruments, and does not require adjustment of the parameters. The strategy uses a proprietary approach to determining: trend, volatility, hierarchy of timeframe significance, the size of the history period (the number of candles), which is important for making a
    Trend Sync
    Pavel Verveyko
    5 (1)
    The indicator shows the trend of 3 timeframes: higher timeframe; medium timeframe; smaller (current) timeframe, where the indicator is running. The indicator should be launched on a chart with a timeframe smaller than the higher and medium ones. The idea is to use the trend strength when opening positions. Combination of 3 timeframes (smaller, medium, higher) allows the trend to be followed at all levels of the instrument. The higher timeframes are used for calculations. Therefore, sudden change
    The indicator detects important peaks and troughs (extremes) on the chart. These points can be used to plot support/resistance levels and trend lines, as well as any other graphical analysis. These points can serve as reference points for setting trading orders. The indicator does not redraw . Settings: Size_History  - the size of the calculated history. Num_Candles_Right  - number of candles to the right of the peak or trough. Num_Candles_Left  - number of candles to the left of the peak or
    Running along Lines
    Pavel Verveyko
    3 (2)
    The indicator draws support and resistance lines on an important part of the chart for making decisions. After the trend line appears, you can trade for a breakout or rebound from it, as well as place orders near it. Outdated trend lines are deleted automatically. Thus, we always deal with the most up-to-date lines. The indicator is not redrawn . Settings: Size_History  - the size of the calculated history. Num_Candles_extremum  - the number of candles on each side of the extremum. Type_Arrow
    Key Volumes
    Pavel Verveyko
    1 (1)
    The indicator shows key volumes confirmed by the price movement. The indicator allows you to analyze volumes in the direction, frequency of occurrence, and their value. There are 2 modes of operation: taking into account the trend and not taking into account the trend (if the parameter Period_Trend = 0, then the trend is not taken into account; if the parameter Period_Trend is greater than zero, then the trend is taken into account in volumes). The indicator does not redraw . Settings History_S
    Catch Impulse
    Pavel Verveyko
    This trading system is based on market impulses of varying complexity.   To generate a signal, the indicator uses the moments when the direction of the pulse and the necessary section of the trend coincide. The indicator also takes into account the current market volatility. Stop_loss tags can be set with the parameter "0" or "1", then Stop_Loss will take into account market volatility.   Take_Profit tags can be set with the parameter "0", then Take_Profit will take into account market volatil
    Indexes
    Pavel Verveyko
    The stocks that make up the index are one of the drivers of the movement. Analyzing the financial performance of all elements of the index, we can assume further development of the situation. The program (script) displays corporate reports of shares that are part of the index selected in the settings.   "Indexes" cannot be tested in the tester (since there is no way to get information from the Internet). Information is downloaded from the site investing.com: Report Date Earnings per share (E
    Fibo World
    Pavel Verveyko
    The indicator builds a graphical analysis based on the Fibonacci theory. Fibo Fan is used for the analysis of the impulses and corrections of the movement. Reversal lines (2 lines at the base of the Fibonacci fan) are used to analyze the direction of movements. The indicator displays the of 4 the target line in each direction. The indicator takes into account market volatility. If the price is above the reversal lines, it makes sense to consider buying, if lower, then selling. You can open posi
    The indicator determines the state of the market: trend or flat. The state of the market is determined by taking into account volatility. The flat (trading corridor)is displayed in yellow. The green color shows the upward trend. The red color shows the downward trend. The height of the label corresponds to the volatility in the market. The indicator does not redraw . Settings History_Size   - the amount of history for calculation. Period_Candles  - the number of candles to calculate the indicat
    The indicator plots flexible support and resistance levels (dots). A special phase of movement is used for construction. Levels are formed dynamically, that is, each new candle can continue the level or complete it. The level can provide resistance or support to the price even where it is no longer there. Also, support and resistance levels can change roles. The importance of levels is affected by: the amount of time the level is formed and the number of touches. The significance of these lev
    The indicator is a trading system for short-term trading. Scalper Assistant helps to determine the direction of the transaction, and also shows the entry and exit points. The indicator draws two lines (possible points for opening positions). At the moment of the breakdown of the upper line up (and when all trading conditions are met), an up arrow appears (a buy signal), as well as 2 goals. At the moment of the breakdown of the lower line down (and when all trading conditions are met), a down ar
    Gold n XAU
    Pavel Verveyko
    The trading system is designed to work with gold on time periods: 30M, 1H. The indicator allows you to adjust to the market situation. Parameters for 1H :   PERIOD=9F ,   FILTER=300 .   Parameters for  30M :   PERIOD=22B ,   FILTER=450 .   A small adjustment to a specific broker is allowed .   If you change the amount of history displayed, you may also need to adjust the parameters. The indicator is not redrawn.     "Gold n XAU" uses different rules for entering a trade and different rules fo
    The indicator builds "psychological levels": levels of round numbers and intermediate levels of round numbers. Round numbers play an important role in forming support and resistance levels. There is a pattern in which the decline or growth of the price can stop at round numbers. The level whose price ends at 0 is the level of a round number of the first order. Intermediate level, this is the level between two round levels, for example, between 10 and 20 this is level 15. In the " Num_Zeros "
    Ichimoku Map
    Pavel Verveyko
    Ichimoku Map (instant look at the markets) - built on the basis of the legendary Ichimoku Kinko Hyo indicator. The task of the Ichimoku Map is to provide information about the market strength on the selected time periods and instruments, from the point of view of the Ichimoku indicator. The indicator displays 7 degrees of buy signal strength and 7 degrees of sell signal strength. The stronger the trend, the brighter the signal rectangle in the table. The table can be dragged with the mouse. The
    The indicator displays a stock chart of a non-standard type, in which the price and time have the same value. The usual chart of Japanese candlesticks does not take into account all the information that the time analysis can give. Renko charts do not use all the information that price can give in relation to time. The "Chart Price and Time" indicator takes into account price and time equally and shows the predominance of price or time. Taking into account price and time equally gives an idea
    The indicator tracks sharp volatility (moments when the market has shown increased activity and movement may occur), on the selected instruments and time periods. The information is displayed as colored rectangles. Thus, it is possible to assess at a glance which tool should be given priority attention. The indicator will be useful for scalpers when they need a quick reaction or for traders working with a large number of instruments. The indicator does not redraw. The indicator displays 8 degree
    Alert Creator
    Pavel Verveyko
    The Alert Creator indicator is designed to create alerts for selected conditions. You can select one or several indicators for the notification. If several conditions are selected, the alert is triggered when all the selected conditions are met. The signals can be configured separately for buying and separately for selling. Example, a buy alert: the closing price is above the moving average, the RSI is below 20. (In this example, 2 indicators are used to generate an alert: MA and RSI) At the
    Trend Arithmetic
    Pavel Verveyko
    The indicator determines the strength of the trend and its possible reversal points, based on the author's arithmetic approach . Each new peak or trough is a trend development. Such peaks and troughs are numbered so that the strength of the trend development can be seen. Attempts to change the trend are also numbered. This gives an understanding of a possible change in the direction of the trend. Indicator signals are generated when trying to change the trend . In the settings, it is possible
    Level Predictor
    Pavel Verveyko
    该指标绘制可能成为未来显着支撑位和阻力位的潜在水平。 该线越长,在该水平击穿后价格反转或价格变动增加的可能性就越高。 随着电平形成概率的降低,线的长度减小。 该指标不需要调整。 在设置中,您可以更改指示器的设计。 " Line_Length "按钮放置在图表上以调整线的长度(为了便于感知指标)。 所选的" Line_Length "设置将为每个时间段和仪器保存。 " Line_Length "按钮可以用鼠标拖动。 当悬停在按钮的左边缘时,它会用选定的颜色突出显示,按下时,数字会减少,指示线会缩短。 当您将鼠标悬停在按钮的右边缘时,它会以选定的颜色突出显示,按下时,数字会增加,指示线会延长。 _________________
    Flat Control
    Pavel Verveyko
    The indicator defines a trading corridor, a flat market, and corrections. Allows you to compare the significance of different flat and trend areas (by time of existence and by volatility). This makes it possible to assess the market cycle and its mood at a glance. That is, how long does the flat last on average, and how long is the trend and what kind of volatility they have in points. As a rule, the longer the flat lasts, the more likely it is to accumulate the potential for a strong movem
    筛选:
    krisnara123
    2103
    krisnara123 2020.12.11 14:22 
     

    用户没有留下任何评级信息

    回复评论
    版本 1.5 2020.12.08
    Added a goal label - the goal is set automatically if the "goal" button is enabled.
    (to set a goal, you need at least two lines in different directions).

    Added text placemark orientation (right/left).

    Added the ability to cancel the "delete all measuring lines" command
    (you can select the desired number of seconds in the settings).

    Average time indicators have been added to the "average values" text labels. And the number of measurement lines.
    版本 1.4 2020.12.02
    Added text labels for "average values".
    "Average values" are calculated along the lines of the time period of the open chart.
    The "measuring line" drawn on the H4 graph is visible and is taken into account in calculations only on the H4 graph.
    版本 1.3 2020.12.01
    1 Added new information about the line: time (now you can see the time period on which the line is drawn, and the number of candles in the line of this time period).
    2 Added new information about the line: speed (average size of candlesticks in the line).
    3 Improved drawing mechanism: you need to click the "Pips" button and draw on the graph (clicking the mouse is the first point of the line, where the mouse is released - the second point of the line).
    4 Now you can drag the buttons with the mouse.
    5 Keyboard shortcuts (you can assign keyboard shortcuts (A-Z) to on-screen buttons).
    6 When you rebuild a line, the value of the text label changes immediately.
    版本 1.2 2020.06.09
    Recompilation.
    版本 1.1 2019.06.18
    Added settings:
    1) indentation of the price tag.
    2) option for calculating points (standard, fractional, rounded).