• 概述
  • 评论 (2)
  • 评论
  • 新特性

Pnitrol Levels

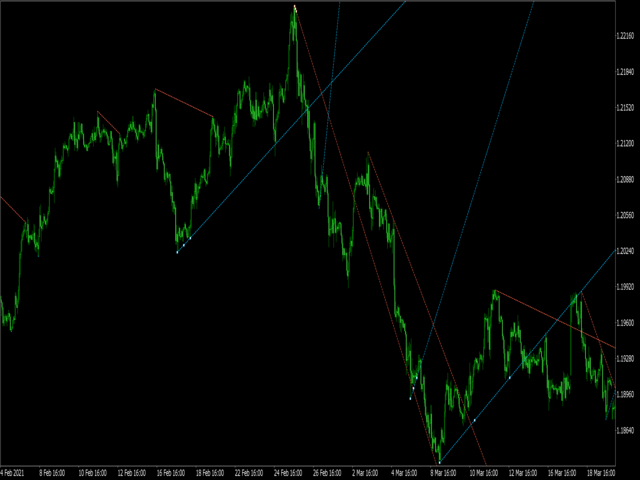
Draws trend lines from the high and / or low values ​​of the week.

The color and thickness of the levels are customizable.

All trend lines can be edited.

Suitable levels of the past can be renamed and other properties changed.

Levels are re-read only on the H1 timeframe once an hour.


...

⣿⣿⣿⣿⣿⣿⣿⣿⣿⣿⣿⣿⣿⣿⣿⣿⣿⣿⣿⣿⣿⣿⣿⣿⡟⣫⣿⣿⣿⣿

⣿⣿⣿⣿⣿⣿⣿⣿⣿⣿⣿⣿⣿⣿⣿⣿⣿⣿⣿⣿⣿⢿⠛⣩⣾⣿⣿⣿⣿⣿

⣿⣿⣿⣿⣿⣿⣿⣿⡛⠛⠛⠛⠛⠛⠛⢿⢻⣿⡿⠟⠋⣴⣾⣿⣿⣿⣿⣿⣿⣿

⣿⣿⣿⣿⡿⢛⣋⠉⠁⠄⢀⠠⠄⠄⠄⠈⠄⠋⡂⠠⣿⣿⣿⣿⣿⣿⣿⣿⣿⣿

⣿⣿⣿⣛⣛⣉⠄⢀⡤⠊⠁⠄⠄⠄⢀⠄⠄⠄⠄⠲⣾⣿⣿⣿⣿⣿⣿⣿⣿⣿

⣿⡿⠟⠋⠄⠄⡠⠊⠄⠄⠄⠄⠄⣀⣼⣤⣤⣤⣀⠄⠸⣿⣿⣿⣿⣿⣿⣿⣿⣿

⣿⠛⣁⡀⠄⡠⠄⠄⠄⠄⠄⠄⢠⣿⣿⣿⣿⣿⣿⣷⣶⣿⣿⣿⣿⣿⣿⣿⣿⣿

⣿⠿⢟⡉⠰⠁⠄⠄⠄⠄⠄⠄⠄⠙⠿⠿⢿⣿⣿⣿⣿⣿⣿⣿⣿⣿⣿⣿⣿⣿

⡇⠄⠄⠙⠃⠄⠄⠄⠄⠄⠄⠄⠄⠄⠄⠄⠄⠄⠈⠉⠉⠛⠛⠛⠻⢿⣿⣿⣿⣿

⣇⠄⢰⣄⠄⠄⠄⠄⠄⠄⠄⠄⠄⠄⠄⠄⠄⠄⠄⠄⠄⠄⠄⠄⠄⠄⠉⠻⣿⣿

⣿⠄⠈⠻⣦⣤⡀⠄⠄⠄⠄⠄⠄⠄⠄⠄⠄⠄⠄⠄⠄⠄⠄⠄⠄⠄⠄⣦⠙⣿

⣿⣄⠄⠚⢿⣿⡟⠄⠄⠄⢀⡀⠄⠄⠄⠄⠄⠄⠄⠄⠄⠄⠄⠄⠄⠄⢀⣿⣧⠸

⣿⣿⣆⠄⢸⡿⠄⠄⢀⣴⣿⣿⣿⣿⣷⣶⣶⣶⣶⠄⠄⠄⠄⠄⠄⢀⣾⣿⣿⠄

⣿⣿⣿⣷⡞⠁⢀⣴⣿⣿⣿⣿⣿⣿⣿⣿⣿⣿⣿⣧⡀⠄⠄⣠⣾⣿⣿⣿⣿⢀

⣿⣿⣿⡿⠁⢠⣿⣿⣿⣿⣿⣿⣿⣿⣿⣿⣿⣿⣿⣿⡿⠄⠄⠘⣿⣿⡿⠟⢃⣼

⣿⣿⠏⠄⠠⣿⣿⣿⣿⣿⣿⣿⣿⣿⣿⣿⣿⠿⠛⠉⢀⡠⢄⡠⡭⠄⣠⢠⣾⣿

⠏⠄⠄⣸⣾⣿⣿⣿⣿⣿⣿⣿⣿⣿⡟⠁⠄⢀⣦⣒⣁⣒⣩⣄⣃⢀⣮⣥⣼⣿

⣿⣿⣿⣿⣿⣿⣿⣿⣿⣿⣿⣿⣿⣿⣿⣿⣿⣿⣿⣿⣿⣿⣿⣿⣿⣿⣿⣿⣿⣿

推荐产品
Free automatic Fibonacci is an indicator that automatically plots a Fibonacci retracement based on the number of bars you select on the BarsToScan setting in the indicator. The Fibonacci is automatically updated in real time as new highest and lowest values appears amongst the selected bars. You can select which level values to be displayed in the indicator settings. You can also select the color of the levels thus enabling the trader to be able to attach the indicator several times with differe
FREE
Important Lines
Terence Gronowski
4.86 (21)
This indicator displays Pivot-Lines, preday high and low, preday close and the minimum and maximum of the previous hour. You just have to put this single indicator to the chart to have all these important lines, no need to setup many single indicators. Why certain lines are important Preday high and low : These are watched by traders who trade in a daily chart. Very often, if price climbs over or falls under a preday low/high there is an acceleration in buying/selling. It is a breakout out of a
FREE
PZ Penta O MT5
PZ TRADING SLU
3.5 (4)
The Penta-O is a 6-point retracement harmonacci pattern which usually precedes big market movements. Penta-O patterns can expand and repaint quite a bit. To make things easier this indicator implements a twist: it waits for a donchian breakout in the right direction before signaling the trade. The end result is an otherwise repainting indicator with a very reliable trading signal. The donchian breakout period is entered as an input. [ Installation Guide | Update Guide | Troubleshooting | FAQ | A
FREE
Statistical Arbitrage Spread Generator for Cointegration [MT5] What is Pair Trading? Pair trading is a market-neutral strategy that looks to exploit the relative price movement between two correlated assets — instead of betting on the direction of the market. The idea? When two assets that usually move together diverge beyond a statistically significant threshold, one is likely mispriced. You sell the expensive one, buy the cheap one , and profit when they converge again. It’s a statistica
FREE
Follow The Line MT5
Oliver Gideon Amofa Appiah
4.52 (29)
This indicator obeys the popular maxim that: "THE TREND IS YOUR FRIEND" It paints a GREEN line for BUY and also paints a RED line for SELL. (you can change the colors). It gives alarms and alerts of all kinds. IT DOES NOT REPAINT and can be used for all currency pairs and timeframes. Yes, as easy and simple as that. Even a newbie can use it to make great and reliable trades. NB: For best results, get my other premium indicators for more powerful and reliable signals. Get them here: https://www.m
FREE
LT Donchian Channel
Thiago Duarte
4.83 (6)
Donchian Channel is an indicator created by Richard Donchian. It is formed by taking the highest high and the lowest low of the last specified period in candles. The area between high and low is the channel for the chosen period. Its configuration is simple. It is possible to have the average between the upper and lower lines, plus you have alerts when price hits one side. If you have any questions or find any bugs, please contact me. Enjoy!
FREE
Haven Key Levels PDH PDL
Maksim Tarutin
5 (5)
"Haven Key Levels PDH PDL"   指标可帮助交易者在图表上将关键水平可视化。它会自动标记以下水平: DO (Daily Open)   — 每日开盘价。 NYM (New York Midnight)   — 纽约午夜价。 PDH (Previous Day High)   — 前一日最高价。 PDL (Previous Day Low)   — 前一日最低价。 WO (Weekly Open)   — 每周开盘价。 MO (Monthly Open)   — 每月开盘价。 PWH (Previous Week High)   — 前一周最高价。 PWL (Previous Week Low)   — 前一周最低价。 CMH (Current Month High)   — 当月最高价。 CML (Current Month Low)   — 当月最低价。 PMH (Previous Month High)   — 上一月最高价。 PML (Previous Month Low)   — 上一月最低价。 其他产品 ->  点击这里 。 自定义功能: 选择线条颜
FREE
Trendline mt5 indicator
David Muriithi
3 (1)
Are you tired of drawing trendlines every time you're analyzing charts? Or perhaps you would like more consistency in your technical analysis. Then this is for you. This indicator will draw trend lines automatically when dropped on a chart. How it works Works similar to standard deviation channel found on mt4 and mt5. It has 2 parameters: 1. Starting Bar 2. Number of bars for calculation The   starting bar   is the bar which drawing of the trend lines will begin, while the   number of bars for c
FREE
Pivot Point Fibo RSJ
JETINVEST
4.33 (18)
枢轴点斐波那契 RSJ 是一个指标,它使用斐波那契汇率追踪当天的支撑线和阻力线。 这个壮观的指标使用斐波那契汇率通过枢轴点创建多达 7 个支撑位和阻力位。 价格如何尊重该支撑和阻力的每个水平真是太棒了,在那里可以感知操作的可能进入/退出点。 特征 多达 7 个支撑位和 7 个阻力位 单独设置级别的颜色 输入 枢轴类型 Pivot Fibo RSJ1 = Fibo ratio 1 计算 Pivot Fibo RSJ2 = Fibo ratio 2 计算 Pivot Fibo RSJ3 = Fibo ratio 3 计算 Pivot Fibo Classic = 经典枢轴计算 最低枢轴级别 旋转 3 个级别 旋转 4 个级别 旋转 5 个级别 枢轴 6 个级别 旋转 7 个级别 如果您仍有疑问,请通过直接消息与我联系: https://www.mql5.com/zh/users/robsjunqueira/
FREE
FREE
Second Level Candles And Alligator Indicators 每12秒产生一个K线,而且自带Alligator指标,对超短线选手交易非常有帮助。程序启动时可能不成功,是因为MT5 MqlTick 数据加载少的原因。可以通过修改显示的数据参数避免,比如display=100,程序正常之后再将参数调大 display=300 。如果数据不正常,也可以采用重新加载的方式解决。 如果您对这个指标有任何建议,请联系作者。  Second Level Candles And Alligator Indicators  produced a candle per 12 seconds,include Alligator, it's helpful to Short-Term Trading。You'd better reload the indicator every start MT5 or change display parameter to reslove data bug. Please attach author when  you had some su
FREE
Heiken Ashi fxam
Ely Alsedy
5 (1)
海肯阿什MT5指标 提升您的交易分析能力,使用海肯阿什MT5指标。 这款强大的工具将标准价格数据转化为更平滑、 趋势化的烛形图, 让您更轻松地识别市场趋势和潜在的逆转点。 主要特点: 清晰的趋势识别: 通过不同的烛身颜色, 直观区分上升和下降趋势。 降低噪音: 过滤价格波动, 更清晰地呈现市场主要走势。 提前发现趋势: 在标准图表上显示趋势变化之前, 提前预测潜在趋势变化。 多功能应用: 可独立使用或与其他技术指标结合进行综合分析。 自定义设置: 根据您的具体交易偏好和策略调整指标。 优势: 提高您识别趋势和潜在进出场点的能力。 减少市场噪音的影响, 专注于重要的价格变动。 基于对市场动态的更清晰理解, 做出更明智的交易决策。 利用经过验证的技术分析工具, 获得竞争优势。 适合人群: 希望提升技术分析能力的各级交易者。 偏好更平滑、 趋势导向的市场视图的交易者。 寻求工具来补充现有交易策略的交易者。 解锁海肯阿什MT5指标的潜力,将您的交易提升到新的水平! 注意: 为了更有效地推广产品, 建议添加有关可使用该指标的具体策略的信息, 并提供带有使用示例的图表截图。 您是否希望添加更多关
FREE
High Low Open Close
Alexandre Borela
4.98 (40)
如果你象这个项目一样,就有5个饥饿审查。 这项指标采用了既定价格的公开、高、低价和关闭价格 可以对特定时间区加以调整。 许多机构和专业人士都认为这些是重要的。 贸易商可以为你了解他们可能更进一步的地点, 积极。 现有期间为: 前一日。 前一星期。 曾任Month。 曾任。 前一年。 或: 目前日。 目前周。 目前 Month。 目前配额。 今年。
FREE
Trend Catcher with Alert MT5
Issam Kassas
4.68 (99)
趋势捕捉器: 具有警示指标的趋势捕捉器策略是一种多功能的技术分析工具,可帮助交易员识别市场趋势和潜在的进出点。它采用动态趋势捕捉器策略,根据市场条件进行调整,清晰地呈现趋势方向。交易员可以自定义参数,以符合其偏好和风险容忍度。该指标有助于识别趋势,发出潜在的反转信号,充当跟踪止损机制,并提供实时警报,以便及时应对市场。 具有警示指标的趋势捕捉器策略是一种多功能的技术分析工具,可帮助交易员识别市场趋势和潜在的进出点。它采用动态趋势捕捉器策略,根据市场条件进行调整,清晰地呈现趋势方向。交易员可以自定义参数,以符合其偏好和风险容忍度。该指标有助于识别趋势,发出潜在的反转信号,充当跟踪止损机制,并提供实时警报,以便及时应对市场。 特点: 趋势识别:信号牛市趋势和熊市趋势。 趋势反转:当蜡烛颜色从牛市变为熊市,反之亦然时,提醒可能的反转。 实时警报:为新趋势识别生成警报。 建议: 货币和货币对:EURUSD,AUDUSD,XAUUSD... 时间框架:H1。 账户类型:任何ECN,低点差账户。
FREE
Introduction Welcome to the world of Forex trading, where every tick of the market can be influenced by news events. Introducing our expert advisor for MetaTrader, your ultimate tool for navigating the complexities of news trading. This innovative advisor is specifically designed to automate your trading strategy during key macroeconomic releases, ensuring you never miss an opportunity.  When important indicators are announced, volatility often spikes, creating potential for profit. Our expert
FREE
介绍适用于 MT5 的 NAS100 Auto SL 和 TP Maker: 有了我们的 NAS100 Auto SL 和 TP Maker,再也不会错过止损和止盈的设置,这是交易者在 MetaTrader 5 上浏览纳斯达克 100 市场时不可或缺的助手。该工具专为寻求自动管理止损和止盈水平的无缝解决方案的用户而设计。 主要功能 轻松实现自动化: 自动监控无止损和/或止盈的纳斯达克 100 指数交易。 根据用户配置设置动态调整水平。 订单类型的多样性: 兼容纳斯达克 100 指数的市价订单和挂单。 支持 MetaTrader 5 中的各种订单类型。 定制配置: 用户友好的参数设置允许自定义跟踪偏好和止损/止盈水平。 范围灵活: 可选择为其运行的特定 NAS100 工具或所有交易工具设置止损和止盈。 快速执行: 确保快速设置所需的 StopLoss 和/或 TakeProfit 值,无需等待新的 tick 即可迅速响应。 MetaTrader 5 兼容性: 与 MetaTrader 5 中的所有订单类型兼容,实现无缝集成。 使用 NAS100 Auto SL 和 TP Maker
FREE
Coral Indi
Dinh Duong Luong
Coral trend is   a trend-following indicator that is widely popular among FOREX traders . It is usually used as a confluence with other indicators. It uses combinations of moving averages with complex smoothing formulas! It has two configurable parameters: Coefficient   - smoothing ratio (*) Applied price Calculation: Coral = (-0.064) * B6 + 0.672 * B5 - 2.352 * B4 + 2.744 * B3
FREE
RSI abcd
Francisco Gomes Da Silva
3 (1)
RSI ABCD形态查找器:技术策略 1. 指标工作原理 结合 经典RSI 与自动检测 ABCD谐波形态 。 主要组件 标准RSI (可调周期) 高低点标记 (箭头) ABCD形态 (绿/红线) 超买(70)和超卖(30)过滤器 2. MT5设置 period = 14 ; // RSI周期 size = 4 ; // 最大形态尺寸 OverBought = 70 ; // 超买水平 OverSold = 30 ; // 超卖水平 Filter = USE_FILTER_ YES ; // 确认过滤器 3. 交易策略 3.1. 买入信号(看涨ABCD) 条件: RSI形成: 低点( A ) → 高点( B ) → 更高低点( C ) D 高于超卖区(30)但低于 C 确认:绿色连线A-B-C-D 目标: TP1: B-C的61.8% TP2: B-C的100% 止损: 低于 D 3.2. 卖出信号(看跌ABCD) 条件: RSI形成: 高点( A ) → 低点( B ) → 更低高点( C ) D 低于超买区(70)但高于 C 确认:红色连线A-B-C-D 目标: TP1: B-C的6
FREE
Volume Weighted Average Price or VWAP is an indicator wich shows different average prices on chart. This is very useful to find strong negotiation price areas and as trend following. Configurations: Day, Week and Month - Show different VWAPs according to the period. You can change each line style on "colors" tab. Any doubt or suggestion please contact us. Enjoy! This is a free indicator, but it took hours to develop. If you want to pay me a coffee, I appreciate a lot   <3 PayPal, Skrill, Nete
FREE
Pivot MT5
Dmitrij Isaenko
The indicator draws daily support and resistance lines on the chart, as well as the Pivot level (reversal level). Adapted to work in MT5 The standard timeframe for calculating support and resistance levels is D1. You can choose other timeframes according to your strategy (for example, for M1-M15, the optimal timeframe for calculations is H1) The function for calculating support and resistance levels has been updated; in this calculation option, fibonacci levels are taken into account, respec
FREE
这个小工具可以帮助您通过在图表上拖动简单的线条来定义风险管理。它显示您直接在该行根据账户百分比或固定资金金额计算的实际手数。 您所要做的就是按键盘上的“t”键激活该线并将该线拖至止损点。就是这样。 在设置中,您可以定义线条和文本的颜色和宽度,还可以定义线条和右侧的文本间距,并且可以以帐户百分比或固定资金大小设置风险。 如果您有疑问或愿望,请随时询问。 这个小工具可以帮助您通过在图表上拖动简单的线条来定义风险管理。它显示您直接在该行根据账户百分比或固定资金金额计算的实际手数。 您所要做的就是按键盘上的“t”键激活该线并将该线拖至止损点。就是这样。 在设置中,您可以定义线条和文本的颜色和宽度,还可以定义线条和右侧的文本间距,并且可以以帐户百分比或固定资金大小设置风险。 如果您有疑问或愿望,请随时询问。
FREE
Bar Color Trend
Germano Chagas
4.38 (8)
Combining the best of Price Action , Directional Movement , and Divergence/Convergence analysis, Candle Color Trend is a easy and reliable way to identify trend direction. The indicator automatically paints the candles according to the assumption that an uptrend is defined by prices that form a series of higher highs and higher lows. In contrast, a downtrend is defined by prices that form a series of lower highs and lower lows. Additionally, ADX Wilder indicator is used to measure trend weakness
FREE
Expansoes M
Marcus Vinicius Da Silva Miranda
The M Extensions are variations of the Golden Ratio (Fibonacci Sequence). It is the World's first technique developed for Candle Projections. Advantages: Easy to plot. Candle anchoring; High and accurate precision as support and resistance; Excellent Risk x Return ratio; Works in any timeframe; Works in any asset / market.   The M Extensions are classified into: M0: Zero point (starting candle) RC: Initial candle control region M1: Extension region 1 M2: Extension region 2 M3: Extension regi
FREE
This indicator is an automated version of the Fibonacci retracement (Fib) indicator. Deciding the best areas to use when drawing the fib can be tricky and this  indicator was made with that in mind. When you drop it on the chart it will automatically choose the best points to draw the fib with, but in case you aren't satisfied with those regions, you can adjust it as you wish.
FREE
Reversal Composite Candles
MetaQuotes Ltd.
3.46 (13)
该系统的思路是通过计算复合蜡烛来识别反转形态。 反转形态类似日本蜡烛条分析的 "锤头" 和 "吊颈" 形态。但它使用符合蜡烛替代单一的蜡烛,并且不需要复合蜡烛的小实体来确认反转。 输入参数: Range - 最大柱线数量, 计算复合蜡烛时用。 Minimum - 最小复合蜡烛大小 (传统的点数)。 ShadowBig and ShadowSmall - 影线 (复合蜡烛单元)。 Limit, StopLoss and TakeProfit - 开盘价, 止损位和止盈位, 它们是相对于复合蜡烛的收盘价 (复合蜡烛单元)。 Expiration - 订单过期时间 (单位柱线), 用于挂单 (Limit!=0.0)。 反向蜡烛条形态的判别如下。 它计算复合蜡烛参数,其自最后的完整柱线 (索引为 1) 至由 Range 输入参数定义的柱线数量。如果复合蜡烛大小大于由 Minimum 输入参数指定的数值, 它分析复合蜡烛的影线检测反转条件。 空头能量的特征是复合蜡烛的上影线为零, 多头能量的特征是复合蜡烛的下影线为零。 为确认空头趋势反转 (且多头开始),需要以下检查: 下影线的大小 (多头能量
FREE
This Tradepanel is an Utility for Traders Who want ot use Basic MoneyManagement for Calculation of Lotsize  I have created the basic edition only to give an Overview with Limited Functionality Full Features are available with  Auto TradePanel  Pro. (This is Only Because it can not be Tested in Strategy Tester ).  Complete Description is available at  "Auto TradePanel Pro".  in This Version Basic Functionality ( Calculation of Lotsize ) open /close Positions is working in the same way as in Pro
FREE
PZ Pivot Points MT5
PZ TRADING SLU
4.95 (21)
This indicator displays pivot points in the chart, including historical vales, and supports many calculation modes for Pivot Points and S/R levels. [ Installation Guide | Update Guide | Troubleshooting | FAQ | All Products ] It plots historical levels for backtesting purposes It allows you to select the reference timeframe It implements different Pivot Point calculation modes It implements different SR calculation modes It implements customizable colors and sizes Calculation Modes The indicato
FREE
Haven FVG Indicator
Maksim Tarutin
5 (3)
Haven FVG   指标是一款市场分析工具,可在图表上突出显示低效区域(公平价值缺口,FVG),为交易者提供关键水平,以便进行价格分析和交易决策。 其他产品 ->  点击这里 主要特点: 自定义颜色设置: 多头 FVG 颜色   (Bullish FVG Color)。 空头 FVG 颜色   (Bearish FVG Color)。 灵活的 FVG 可视化: FVG 搜索的最大蜡烛数量。 FVG 区域可额外延伸指定数量的 K 线。 可选启用 FVG 填充。 中线(Middle Line): 可选择线条颜色和样式(例如虚线)。 可调整线条厚度,以提高精确度。 通用设置: 将 FVG 扩展到当前 K 线。 排除历史 FVG,并填充突出当前数据。 一种简单而有效的方法,可分析图表上的低效区域,并做出明智的交易决策。
FREE
ZigZag Support Resistance
Emmanuel Tshepang Mosweu
5 (3)
This indicator uses the Zigzag indicator to identify swing highs and swing lows in the price chart.  Once it has identified the swing highs and swing lows, it can use them to determine potential support and resistance levels. A support level is formed when the price drops and bounces back up from a swing low, indicating that there is buying pressure at that level. A resistance level is formed when the price rises and reverses downward from a swing high, suggesting selling pressure at that level.
FREE
Indicator and Expert Adviser  EA Available in the comments section of this product. Download with Indicator must have indicator installed for EA to work. Mt5 indicator alerts for bollinger band and envelope extremes occurring at the same time. Buy signal alerts occur when A bullish candle has formed below both the lower bollinger band and the lower envelope  Bar must open and close below both these indicators. Sell signal occur when A bear bar is formed above the upper bollinger band and upper
FREE
该产品的买家也购买
Trade Assistant MT5
Evgeniy Kravchenko
4.42 (183)
它有助于计算每笔交易的风险,容易安装新的订单,具有部分关闭功能的订单管理, 7 种类型的追踪止损和其他有用的功能。   附加材料和说明 安装说明   -   应用程序说明   -   模拟账户应用程序的试用版 线条功能  - 在图表上显示开仓线、止损线、止盈线。 有了这个功能,就可以很容易地设置一个新的订单,并在开仓前看到它的附加特性。   风险管理  - 风险计算功能在考虑到设定的风险和止损单的大小的情况下,计算新订单的成交量。它允许你设置任何大小的止损,同时观察设定的风险。 批量计算按钮 - 启用 / 禁用风险计算。 在 " 风险 " 一栏中设置必要的风险值,从 0 到 100 的百分比或存款的货币。 在 " 设置 " 选项卡上选择风险计算的变量: $ 货币, % 余额, % 资产, % 自由保证金, % 自定义, %AB 前一天, %AB 前一周, %AB 前一个月。   R/TP 和 R/SL - 设置止盈和止损的关系。 这允许你设置相对于损失的利润大小。 例如, 1 : 1 - 这决定了 TP = SL 的大小。 2 : 1 - 这意味着 TP 是 SL 的两倍。 RR -
欢迎来到 Trade Manager EA——这是一个终极风险管理工具,旨在使交易变得更直观、精准和高效。它不仅仅是一个下单工具,而是一个用于无缝交易计划、仓位管理和风险控制的全面解决方案。不论您是新手交易员、资深交易员,还是需要快速执行的剥头皮交易员,Trade Manager EA 都可以满足您的需求,适用于外汇、指数、大宗商品、加密货币等各种市场。 借助 Trade Manager EA,复杂的计算已成过去。只需分析市场,在图表上用水平线标记入场、止损和止盈,设置您的风险水平,Trade Manager 就会立即计算出理想的头寸规模,并实时显示以点、账户货币计价的止损和止盈。每笔交易都得以轻松管理。 主要功能: 头寸规模计算器 :根据定义的风险瞬间确定交易规模。 简单的交易计划 :在图表上用可拖动的水平线直接计划交易,设置入场、止损和止盈。 实时显示 SL 和 TP :以账户货币、点或分显示止损和止盈,便于分析。 高级保护工具 盈亏平衡选项 : 基本盈亏平衡 :当您的交易达到设定水平时自动保护利润。 多级盈亏平衡 :设置多达 4 个级别以逐步保护利润。 尾随止损选项 : 基本尾随
Local Trade Copier EA MT5
Juvenille Emperor Limited
4.98 (90)
通过 Local Trade Copier EA MT5 获得非常快速的交易复制体验。它的简单1分钟设置,使您可以在同一台Windows计算机或Windows VPS上在多个MetaTrader终端之间复制交易,具有闪电般快速的复制速度,低于0.5秒。 无论您是初学者还是专业交易者, Local Trade Copier EA MT5 都提供了广泛的选项,可根据您的特定需求进行自定义。对于任何希望增加利润潜力的人来说,这都是终极解决方案。 今天就尝试一下,看看为什么它是市场上最快、最简单的贸易复印机! 提示: 您可以在您的模拟账户中下载并试用 Local Trade Copier EA MT5 模拟版: 这里 将下载的免费演示文件粘贴到您的 MT5 >> 文件 >> 打开数据文件夹 >> MQL5 >> 专家文件夹并重新启动您的终端。  免费演示版本每次可在 4 小时内发挥全部功能,仅限演示帐户。 要重置试用期,请转至 MT5 >> 工具 >> 全局变量 >> Control + A >> 删除。 请仅在非关键模拟账户上执行此操作,不要在挑战道具公司账户中执行此操作。 Local
TradePanel MT5
Alfiya Fazylova
4.84 (134)
交易面板是一个多功能的交易助手。该应用程序包含超过 50 个用于手动交易的交易功能,并允许您自动化大多数交易操作。 应用程序安装说明 | 申请说明 | 用于模拟账户的应用程序试用版 贸易. 让您只需单击一下即可执行交易操作: 开立挂单和仓位并自动计算风险。 只需单击鼠标即可打开多个订单和仓位。 打开订单网格。 只需单击一下即可对多个符号打开订单和持仓。 按组关闭挂单和仓位。 仓位反转(平掉买入 > 开仓卖出,平掉卖出 > 开仓买入)。 锁仓(通过以缺失手数开仓,使买入和卖出手数相同)。 单击即可部分关闭所有仓位。 以相同的价格水平设置所有仓位的获利和止损。 将所有仓位的止损设置为仓位的盈亏平衡水平。 当开设挂单和仓位时,可以应用以下函数: 在多个订单或仓位之间分配计算出的交易量(当单击打开多个订单和仓位时)。 在开单过程中,图表上交易水平的可视化。 仅当当前价差不超过指定价差时才开仓。 获利与止损之间的自动比率。 虚拟止损和止盈。 根据当前价差的大小自动增加止损和获利。 根据 ATR 指标读数计算获利和止损。 设置挂单的到期日期。 设置挂单的追踪(面板自动根据当前价格移动挂单,保持价格
EasyInsight AIO MT5
Alain Verleyen
5 (5)
EASY Insight AIO – 全指标数据一体化市场扫描器 如果您能在几秒钟内分析整个外汇市场,而无需在图表上加载任何内容,会怎样? EASY Insight AIO 将 FX Power、FX Volume、FX Dynamic 和 FX Levels 的完整分析数据整合为一个结构化的 CSV 文件。无需额外工具,不在图表上显示任何内容,无干扰。 ⸻ 为什么选择 EASY Insight AIO? 包含所有指标: 无需额外授权,AIO 提供所有核心数据源的完整访问权限。 简洁干净: 图表上无任何绘制内容。非常适合希望保持界面整洁或使用无图形终端的交易者。 一键市场扫描: 即刻分析主要货币对的强弱、情绪、波动率和支撑/阻力水平。 高效工作流: 为性能而生,轻量直观,轻松集成到任何交易流程中。 透明可靠: 无“黑盒”信号,只有干净、结构化的可控数据。 AI 就绪输出: 包含可编辑的 prompt.txt,适用于 ChatGPT、Claude、Gemini 等 AI 工具。 CSV 格式: 可导出至 Excel、Python 脚本或自定义逻辑中自动化处理。 ⸻ 想了解它是
The product will copy all telegram signal to MT5 ( which you are member) , also it can work as remote copier.  Easy to set up, copy order instant, can work with almost signal formats, image signal,  s upport to translate other language to English Work with all type of channel or group, even channel have "Restrict Saving Content", work with  multi channel, multi MT5 Work as remote copier: with signal have ticket number, it will copy exactly via ticket number. Support to backtest signal. How to s
Exp COPYLOT CLIENT for MT5
Vladislav Andruschenko
3.91 (32)
MT5 交易复印机是 МetaТrader 5 平台的交易复印机 。 它复制外汇交易 之间   任何账户 MT5   -   MT5, MT4   -   MT5 对于 COPYLOT MT5 版本(或 MT4   - MT4 MT5   -   MT4 对于 COPYLOT MT4 版本) 值得信赖的复印机! MT4版本 详细描述   +DEMO +PDF 如何购买 如何安装     如何获取日志文件     如何测试和优化     Expforex 的所有产品 您还可以在 МТ4 终端 (   МТ4   -   МТ4, МТ5   -   МТ4   ) 中 复制交易: COPYLOT CLIENT for MT4 此版本包括在终端 МТ5   -   МТ5, МТ4   -   МТ5 之间 。 交易复制器用于在 2/3/10 终端之间复制交易/头寸。 支持从模拟账户和投资账户复制。 该程序可以在多个终端绑定上运行。 使用它作为您在一个账户上交易的各种投资者账户的交易的同步器, - COPYLOT 会将您的交易复制到其他终端。 从 多个 终端复制到一个; 从一个终端复
Trade Dashboard MT5
Fatemeh Ameri
4.95 (77)
疲于复杂的订单下达和手动计算?Trade Dashboard 是您的解决方案。凭借其用户友好的界面,订单下达变得轻而易举,只需点击一下,您就可以开设交易、设置止损和止盈水平、管理交易手数,并计算风险回报比,让您只需专注于您的策略。告别手动计算,使用 Trade Dashboard 简化您的交易体验。 立即下载演示版本 。 您可以在这里找到仪表盘功能和特性的详细信息 。 加入 Telegram 频道 。 购买后请给我发消息以获取支持。如果您需要添加更多功能,可以在产品的评论区留下您的想法,我愿意听取任何建议,希望您能在使用我的产品时获得最佳体验 。 这是 MT4 版本。 风险管理:使用 Trade Dashboard,可以将您的风险设置为账户余额或权益的百分比,或将风险设置为总金额。在图表上直观地定义您的止损,让工具准确计算每个货币对的适当手数。该工具还可以根据您期望的风险回报比自动设置止盈水平。它甚至可以在手数计算中涵盖佣金和点差费用。此外,您的止损和止盈可以转变为虚拟水平,隐藏于经纪商。通过 Trade Dashboard 的高级风险管理功能,掌控风险,保护您的资本。 交易线
MT5 to Telegram Signal Provider 是一个易于使用且完全可自定义的工具,它允许向 Telegram 的聊天室、频道或群组发送 指定 的信号,将您的账户变为一个 信号提供商 。 与大多数竞争产品不同,它不使用 DLL 导入。 [ 演示 ] [ 手册 ] [ MT4 版本 ] [ Discord 版本 ] [ Telegram 频道 ] 设置 提供了逐步的 用户指南 。 不需要了解 Telegram API;开发者提供了您所需的一切。 关键特性 能够自定义发送给订阅者的订单详情 您可以创建分层的订阅模型,例如铜、银、金。其中金订阅获得所有信号等。 通过 id、符号或评论过滤订单 包括执行订单的图表截图 在发送的截图上绘制已关闭的订单,以便额外核实 延迟发送新订单消息的可能性,以便在发送前对位置进行调整 订单详情完全透明: 新的市场订单*带截图 订单修改(止损、获利) 已关闭的订单*带截图 部分关闭的订单** 新的挂单 修改的挂单(进场价格) 挂单激活(作为新的市场订单附加) 已删除的挂单 历史订单报告*** 可自定义的评论 注意: * 发送截图时,您图
Trade Manager DaneTrades
Levi Dane Benjamin
4.31 (26)
交易管理器可帮助您快速进入和退出交易,同时自动计算风险。 包括帮助您防止过度交易、报复性交易和情绪化交易的功能。 交易可以自动管理,账户绩效指标可以在图表中可视化。 这些功能使该面板成为所有手动交易者的理想选择,并有助于增强 MetaTrader 5 平台。多语言支持。 MT4版本  |  用户指南+演示 交易经理在策略测试器中不起作用。 如需演示,请参阅用户指南 风险管理 根据%或$自动调整风险 可选择使用固定手数或根据交易量和点自动计算手数 使用 RR、点数或价格设置盈亏平衡止损 追踪止损设置 最大每日损失百分比,在达到目标时自动平仓所有交易。 保护账户免遭过多提款并阻止您过度交易 最大每日损失(以美元为单位)在达到目标时自动关闭所有交易。 保护账户免遭过多提款并阻止您过度交易 一键实现所有交易的盈亏平衡 自动计算从手机/电话发送的交易的风险 OCO 在设置中可用 交易和头寸管理 通过设置每月、每周、每天、每小时或每分钟的最大交易次数,停止过度交易和报复性交易。 高级挂单管理。 调整何时关闭挂单的规则 追踪挂单 支持市价订单和挂单 每日最大利润目标(以美元为单位)以确保头寸并停止
Telegram To MT5 Receiver
Levi Dane Benjamin
4.77 (13)
将信号从您所属的任何渠道(包括私人和受限渠道)直接复制到您的 MT5。 该工具在设计时充分考虑了用户的需求,同时提供了管理和监控交易所需的许多功能。 该产品采用易于使用且具有视觉吸引力的图形界面。 自定义您的设置并在几分钟内开始使用该产品! 用户指南 + 演示  |   MT4版本  |   不和谐版本 如果您想尝试演示,请参阅用户指南。 Telegram To MT5 接收器在策略测试器中不起作用! Telegram 至 MT5 功能 一次复制多个通道的信号 从私人和受限频道复制信号 不需要机器人令牌或聊天 ID(如果出于某种原因需要,您仍然可以使用这些) 使用风险百分比或固定手数进行交易 排除特定符号 选择复制所有信号或自定义要复制的信号 配置单词和短语以识别所有信号(默认值应适用于 99% 的信号提供商) 配置时间和日期设置以仅在需要时复制信号 设置一次打开的最大交易量 交易和头寸管理 使用信号或自动设置的管理 通过设置每月、每周、每天、每小时或每分钟的最大交易次数,停止过度交易和报复性交易。 支持市价订单和挂单 每日最大利润目标(以美元为单位)以确保头寸并停止过度交易 确
******************************* ***************** ********************** ***************** ********************** ************************* GoldMine Train 是一款针对黄金的趋势交易策略 EA。 操作员确定主要趋势方向并指示Train前进。 Train 将在该方向连续买入/卖出, 手数取决于账户余额和预设的杠杆比率。 当操作员改变趋势方向时,Train将停止并锁定利润。 用户可以使用图表上的按钮轻松选择趋势方向。 ******************************* ***************** ********************** ***************** ********************** *************************
Grid Manual MT5
Alfiya Fazylova
4.89 (18)
Grid Manual是一个交易面板,用于处理订单网格。 该实用程序是通用的,具有灵活的设置和直观的界面。 它不仅可以在亏损方向上设置订单网格,还可以在盈利方向上设置订单网格。 交易者不需要创建和维护订单网格,实用程序会这样做。 打开一个订单就足够了,Grid manual会自动为它创建一个订单网格,并伴随它直到非常关闭。 完整说明和演示版 此處 。 该实用程序的主要特性和功能: 伴隨以任何方式打開的訂單,包括從移動終端打開的訂單。 適用於兩種類型的網格:“限制”和“停止”。 使用兩種方法計算網格間距:固定和動態(基於 ATR 指標)。 允許您更改未結訂單網格的設置。 顯示圖表上每個網格的盈虧平衡水平。 顯示每個網格的利潤率。 允許您一鍵關閉網格中的盈利訂單。 讓您一鍵關閉每個訂單網格。 允許您對訂單網格應用追踪止損功能。 允許您在訂單網格上應用將訂單網格的止損轉移到盈虧平衡水平的功能。 相對於訂單網格的盈虧平衡水平自動重新排列止盈(僅在限價網格模式下,距離取決於所選的計算類型:“保守”或“激進”)。 最多可管理 20 個訂單網格,每個網格最多可包含 100 個訂單。 計算初始手數時,
Seconds Chart MT5
Boris Sedov
4.56 (16)
秒级图表 (Seconds Chart) — 一款专为 MetaTrader 5 设计的独特工具,用于创建秒级时间框架的图表。 通过 秒级图表 ,您可以构建以秒为单位的时间框架图表,获得标准分钟或小时图表无法提供的极致灵活性和分析精度。例如,时间框架 S15 表示每根蜡烛图持续15秒。您可以使用任何支持自定义交易品种的指标和EA交易系统。操作它们就像在标准图表上交易一样方便。 与标准工具不同, 秒级图表 让您能够在超短时间框架下进行高精度交易,无延迟干扰。 秒级图表的优势 支持 1至900秒 的时间框架图表。 基于内置的实时报价数据库, 即时加载 历史数据。 数据实时更新, 无延迟或滞后 。 可同时创建 多个秒级图表 。 秒级图表的理想应用场景 剥头皮交易 和高频交易。 精确的入场和出场时机。 在短时间框架下测试交易策略。 时间框架设置 默认设置包含以下时间框架: S1、S2、S3、S4、S5、S6、S10、S12、S15、S20、S30 。 您可轻松自定义时间框架组合,只需按升序列出 1至900秒 的数值且避免重复即可。 其他免费工具 快速交易管理器 ( Quick Trade Ma
Custom Alerts:同时监控多重市场,绝不错过任何关键机会 概述 Custom Alerts 为需要在多个交易品种间集中跟踪潜在信号的交易者提供了动态解决方案。通过整合 FX Power、FX Volume 和 IX Power 等旗舰工具的数据, Custom Alerts 会在您无需频繁切换图表或担心错失良机的情况下,自动通知您各种关键市场变化。如果您想使交易更加智能和高效, Custom Alerts 将大幅提升您的市场监控能力。 1. 为什么 Custom Alerts 对交易者非常有价值 全方位市场监控 • Custom Alerts 汇聚多种交易品种的信号,包括八大主要货币、黄金,及您可选择的最多七种指数或商品。 • 无需在多个图表间来回切换——只需接收集中且清晰的通知即可。 量身定制的警报策略 • 精准配置警报参数,无论您追踪的是成交量飙升、货币强度阈值,还是特定的价格形态, Custom Alerts 都能确保您不错过关键信号。 • 与 Stein Investments 的其他工具无缝整合,进一步提高您的交易精度。 省时且便捷 • 无需时刻盯盘,
Telegram to MT5 Coppy
Sergey Batudayev
4.83 (6)
Telegram 到 MT5: 终极信号复制解决方案 使用 Telegram 到 MT5 简化您的交易,这款现代化工具可直接从 Telegram 频道和聊天室复制交易信号到您的 MetaTrader 5 平台,无需 DLL 文件。这款强大的解决方案可确保精准的信号执行、丰富的自定义选项,节省时间并提高您的效率。 [说明 ] [   演示 ] 主要特点 直接 Telegram API 集成 通过电话号码和安全码进行身份验证。 通过用户友好的 EXE 桥轻松管理聊天 ID。 添加、删除和刷新多个频道/聊天以同时复制信号。 使用高级过滤器进行信号解析 跳过包含异常词(例如“报告”、“结果”)的不需要的信号。 支持灵活的 SL 和 TP 格式:价格、点数或点数。 自动计算指定点而不是价格的信号的切入点。 订单定制和灵活性 使用多种模式配置订单大小:固定手数、动态手数(% 风险)或特定符号手数。 使用信号数据或自定义参数调整 SL/TP。 设置滑点限制、挂单到期时间和重试参数,以实现无缝执行。 综合符号管理 排除特定符号或映射到特定经纪人的符号。 自定义信号和经纪商符号之间的符号映射(例如,GO
Trader Evolution
Siarhei Vashchylka
5 (6)
" Trader Evolution " - A utility designed for traders who use wave and technical analysis in their work. One tab of the utility is capable of money management and opening orders, and the other can help in making Elliott wave and technical analysis. Manual (Be sure to read before purchasing) | Version for MT4 Advantages 1. Trading in a few clicks. Immediate and pending orders are available in the panel 2. Money management. The program automatically selects the appropriate lot size 3. Simplifies
RiskGuard Management
MONTORIO MICHELE
5 (22)
注意 :该智能交易系统无法在策略测试器中运行。若需试用版本,请访问我的个人资料。 用户手册 要下载自动日志,请访问我的个人资料 RiskGuard Management – 专业交易,无需妥协 RiskGuard Management 是每位希望通过高级风险管理实现利润最大化、亏损最小化的交易者的终极助手。它不仅仅是一个工具,更是一个智能系统,帮助你严格执行交易计划,避免情绪化错误,以最高效率进行操作。 全面资金保护 动态计算手数的高级风险管理 自动平仓功能,确保遵守每日交易计划 Quantum 技术优化每一笔交易的风险 专业级分析和报告,包含数据导出与自动日志功能 Quantum:改变游戏规则的创新功能 Quantum 是一项革命性功能,通过分析你的交易数据和当前回撤,为每笔交易计算最优风险。效果如何?在相同回撤条件下,利润最多可提升至传统风险管理的 4 倍。 不再是固定风险,而是智能风险。Quantum 会根据你的交易风格自动调整,始终为你提供最佳设置。 高级功能,打造可控且安全的交易体验 自动手数计算 — 设置百分比或固定金额的风险,RiskGuard 自动帮你计算 止损锁定
EasyTrade MT5
Alain Verleyen
5 (2)
Easy Trade – 智能、简洁且强大的交易管理工具 Easy Trade 是为 MetaTrader 用户打造的一体化交易管理解决方案,帮助您轻松掌控风险,实现流畅交易执行。 它是根据交易者的反馈从零开始开发的,简化了多品种交易的执行、监控和管理流程,无需繁琐的操作。 无论您是手动短线交易者,还是管理多个交易设置的小型投资组合,Easy Trade 都能让您专注于明智决策和稳定盈利。 ⸻ 为什么选择 Easy Trade? 精准风险管理:可选择固定手数或按百分比定义每笔交易的风险。实时显示风险与潜在收益。 篮子式跟踪止盈:追踪多笔交易的总利润,目标达成时自动锁定部分收益,适用于组合交易。 交易截图记录:每笔交易都可截图保存,方便日记记录、回顾与绩效分析。 定时自动平仓:可设定具体日期和时间自动关闭持仓,适合日终或周末前平仓。 界面可自定义:可调整按钮排序与大小、线条样式与颜色、缩放比例等,满足个人使用习惯。 ⸻ 主要功能(版本 1.0) 魔术号与策略标签: 使用注释标记轻松区分不同策略的交易,便于统计与复盘。 手数设置: 支持固定手数或基于止损与账户资金百分比的动态手
Everything for chart Technical Analysis indicator MT5 in one tool Draw your supply demand zone with rectangle and support resistance with trendline and get alerts to mobile phone or email alert -  Risk reward indicator mt5 Video tutorials, manuals, DEMO download   here .   Find contacts on my   profile . 1.   Extended rectangles and trendlines Object will be extended to the right edge of the chart when price will draw new candles on chart. This is rectangle extender or trendline extender. 2. Pri
Trade copier MT5
Alfiya Fazylova
4.55 (31)
Trade Copier 是一种专业实用程序,旨在复制和同步交易账户之间的交易。 复制发生从供应商的帐户/终端到收件人的帐户/终端,安装在同一台计算机或 vps 上。 在购买之前,您可以在演示帐户上测试演示版本。 演示 这里 。 完整说明 这里 。 主要功能和优点: 支持复制MT5>MT5、MT4>MT5、MT5>MT4,包括МТ5 netting账户。 供应商和收件人模式在同一产品中实现。 简单直观的界面,允许您直接从图表中实时控制复制。 连接中断或终端重新启动时不会丢失设置和位置。 允许您选择要复制的符号,也可以替换接收者的符号,例如 EURUSD> USDJPY。 支持回拷贝。 能够仅复制某些订单。 允许您设置开仓交易价格的最大差异和最大时间延迟。 正确复制部分订单关闭的执行。 计算复制手数的几种方法。 同步止盈和止损。有几种方法可以计算它们的位置。 支持通过执行在“Market account”上工作,其中 SL / TP 仅在开仓后设置。 如何使用简单的设置复制交易 将供应商终端和接收终端安装在同一台计算机或 VPS 上。 在供应商终端上以“Master”模式安装复印机,然后
Trade Assistant 38 in 1
Makarii Gubaydullin
4.9 (21)
多功能工具:超过65个功能,其中包括:手数计算,价格行为,盈亏比,交易管理,供需区域。 演示版   |   用户手册   |  MT4版 任何问题 / 改进意见 / 如果发生了故障或错误    都可以联系我 该实用程序在策略测试器中不起作用:您可以在此处下载 演示版来测 试产品。 交易功能需要允许自动交易(包括经纪商方面) 简化,加快并且自动化你的交易过程。利用这款工具的控制功能就能增强普通交易端的执行力。 建立一笔新的交易:手数 / 风险 / 盈亏计算 1. 手数计算工具 (基于风险规模的交易量计算) 2. 风险计算工具 (基于手数大小的风险额计算) 3. 盈亏比 4. 订单的激活和触发,买入或卖出限价/买入或卖出止损 5. 虚拟的止损/止盈 (隐藏的止损,止盈:交易商不可见) 6.  智能的止损/入场点:当价格柱在收盘时已超越了才入场 (避免无效触发) 7. 隐藏掉挂单 (虚拟的订单) 8. 预订挂单:在市场关闭的时候你也可以下挂单 (适合周末做计划的交易者) 9. 额外的多级止盈 (一笔订单同时有多个止盈) 10. OCO(二择一委托)订单,拥有不同的订单号 11. 在图表上的
Advanced trading tool: One click smart orders that execute under your conditions Developed by trader for trading community:  position size calculator (lot size), open position after price action, strategy builder, set and forget trading, mobile notifications... Risk Management -  Risk percentage position size calculator, gain percentage, target risk reward ratio, spread and commissions are included in calculations 7 Advanced order types  - Set and forget trading with price action automation (OC
OrderManager MT5
Lukas Roth
4.82 (22)
介绍 OrderManager :MT5的革命性工具 使用全新的Order Manager实用程序,像专业人士一样管理您在MetaTrader 5上的交易。Order Manager设计简单,易于使用,可让您轻松定义和可视化每笔交易的风险,从而做出明智的决策并优化您的交易策略。有关OrderManager的更多信息,请参阅手册。 [ 手册 ] [ MT4版本 ] [ Telegram 频道 ] 主要功能: 风险管理:快速轻松地定义您交易的风险,让您做出更好的决策并提高交易性能。 视觉表示:图形化地查看您的交易和相关风险,以清晰简洁地了解您的开放头寸。 订单修改:只需几次点击即可轻松修改或关闭您的订单,简化您的交易过程,为您节省宝贵的时间。 掌握新闻:一键获取最新市场新闻。 不要错过这个MT5交易员的必备工具。用Order Manager提升您的交易体验,将您的交易游戏提升到新的水平。 OrderManager在startegyTester中 不 工作! OrderManager 仅与 Windows 兼容。 请考虑给这个产品一个5星级评价。您的优秀反馈将激励作者加快更新并整合令
DrawDown Limiter
Haidar, Lionel Haj Ali
5 (20)
Drawdown Limiter EA You are in the right place if you were searching for Drawdown control, Drawdown limiter, Balance protection, Equity Protection or Daily Drawdown Limit related to Prop Firm, FTMO, or Funded account trading, or if you want to protect your trading account. Have you suffered from controlling your drawdown when trading funded accounts? This EA is meant for you. Prop firms usually set a rule called “Trader Daily Drawdown”, and if it is not respected, you are disqualified.  I am an
交易面板一键交易。 处理仓位和订单! 通过 图表 或 键盘 进行交易 。 使用我们的交易面板,您只需单击一下即可直接从图表中执行交易,执行交易操作的速度比使用标准 MetaTrader 控件快 30 倍。 参数和函数的自动计算使交易者的交易更加快捷、方便。 图形提示、信息标签和有关贸易交易的完整信息均位于图表 MetaTrader 上。 MT4版本 详细描述   +DEMO +PDF 如何购买 如何安装     如何获取日志文件     如何测试和优化     Expforex 的所有产品 打开和关闭、反转和锁定、部分关闭/Autolot。虚拟/真实止损/止盈/追踪止损/盈亏平衡,订单网格... МetaТrader 5 中主要订单的交易控制面板 :买入、卖出、buystop、buylimit、sellstop、selllimit、平仓、删除、修改、追踪止损、止损、获利。 有 5 个选项卡 可用:头寸、挂单、账户信息、信号和总利润。 Description on English VirtualTradePad在“  MQL5语言最佳图形面板  ”竞赛中 获得二等奖 。 注意!如果
KT Equity Protector MT5
KEENBASE SOFTWARE SOLUTIONS
4.67 (3)
轻松保护您的交易资金 保护交易资金与增长资金同等重要。KT Equity Protector 是您的个人风险管理助手,持续监控账户权益,在达到预设的利润目标或止损水平时,自动关闭所有持仓和挂单,以防止亏损或锁定盈利。 无需情绪化的决策,也不再需要猜测——只需让这个可靠的资金保护工具为您全天候守护账户。 KT Equity Protector 可自动通过关闭所有图表来阻止其他交易机器人继续操作。这确保在您手动重新启动 KT Equity Protector 之前,不会发生任何进一步的交易行为,从而让您完全掌控并安心交易。 工作原理 权益止损(防止亏损): 假设您的账户余额为 $10,000,设置了 $1,000 的权益止损。一旦账户权益降至 $9,000,KT Equity Protector 将立即关闭所有交易,保护您的资金免受更大亏损。 权益止盈(锁定利润): 同样地,如果您设置了 $2,000 的权益止盈目标,当账户权益达到 $12,000 时,EA 将立即平仓,锁定收益并保障已获得的利润。 两种强大的资金计算模式: 相对模式(基于百分比): 按照账户初始余额的百分比计算止损和
Cerberus Equity Watcher
Samuel Bandi Roccatello
5 (3)
Cerberus the Equity Watcher 是一种风险管理工具,可以持续监控您的账户资产并避免因错误的 EA 或您的情绪行为(如果您是全权交易者)导致的重大亏损。对于依赖 EA 的系统交易者来说,它非常有用,EA 可能包含错误,或者在意外的市场条件下可能表现不佳。 Cerberus 允许您设置最小净值和(可选)最大值,如果达到其中任何一个,则所有头寸都被平仓,所有挂单被关闭,所有 EA 被“杀死”。在展平所有位置后,将向用户手机发送通知,并在屏幕上显示一条清晰的消息。在“扁平化”之后, Cerberus 继续关注股权价值,并继续扼杀任何进一步的交易尝试,直到它被重新初始化。 Cerberus 执行的任何操作都清楚地显示在屏幕上,报告在“专家顾问”选项卡上,并向用户发送通知。为了避免用户错误,对用户输入的输入值和自动交易的当前状态进行了多次检查。 ****** 特征 最小和最大权益值可以以账户货币或初始权益的百分比设置 最大净值是可选的 如果达到最小/最大净值,则所有 EA 将独立于它们交易的符号被终止 第一次压扁后几秒钟进行双重检查 Cerberus 在拉平后也继续监控股权
EasyInsight MT5
Alain Verleyen
5 (3)
EASY Insight – 您最聪明的交易助手 如果您能在几秒钟内分析整个外汇市场——从此再不错过任何高潜力的交易机会,您会如何? EASY Insight 为交易者提供清晰、精准和可操作的数据,这些数据直接提取自您现有的指标,例如 FX Power、FX Volume、FX Dynamic 和 FX Levels。 无论您是经验丰富的专业交易者,还是数据驱动的短线交易者,这款工具都能将完整的市场概况导出为一个 CSV 文件——便于您制定个性化策略或通过 AI 辅助决策。 ⸻ 想了解它是如何工作的? 我们收集了最常见的问题,并以清晰、结构化的方式进行了回答 —— 包括如何进行测试、它的独特优势以及如何从 AI 中获得最佳效果。   点击这里阅读完整常见问题解答 无论你是刚开始使用还是已经每天在使用 EASY Insight —— 都值得一读。 新功能:现已推出一体化版本 想要一站式解决方案?请查看我们的全新 EASY Insight AIO ——包含所有所需指标的终极一键解决方案,无需额外设置。 探索我们的完整交易生态系统 访问所有模板、策略教程、YouTube 播放
Take a Break MT5
Eric Emmrich
4.82 (22)
The most advanced news filter on MQL market - free demo available Take a Break has transformed from a basic news filter into a comprehensive account protection solution. It seamlessly pauses any other Expert Advisors during news events or based on your custom filters, all while safeguarding your EA settings - restoring them automatically when trading resumes for complete peace of mind. Typical use cases: A single news filter for all your EAs. Stop trading during news/high volatility (+ close all
作者的更多信息
RSI Chart Levels
Nikolay Mitrofanov
5 (5)
The indicator draws levels based on the overbought and oversold values ​​of the RSI indicator. The maximum values ​​are taken into account, which are equal to or exceeded certain limits. That is, for example, when the price has gone into the overbought zone, the highest price is selected from all prices in this zone for this period of time, and as soon as the indicator value returns to a value below the overbought value, the level is fixed and the calculation of new values ​​begins. The same
FREE
The utility draws pivot levels based on a selection from day week month The previous candlestick of the selected timeframe is taken and the values for the levels are calculated using the following formulas: Pivot = (high + close + low) / 3 R1 = ( 2 * Pivot) - low S1 = ( 2 * Pivot) - high R2 = Pivot + (R1 -S1) R3 = high + ( 2 * (Pivot - low)) S2 = Pivot - (R1 - S1) S3 = low - ( 2 * (high - Pivot)); The style and thickness for all lines are adjusted. The colors for the R, Pivot and S lines ar
FREE
Mahisto Trend Chart
Nikolay Mitrofanov
5 (2)
The indicator makes calculations based on data obtained from one of seven (7) moving averages and colors the chart. Simple moving averages are those that have only one important calculation parameter - the period. The shift in the indicator is not used. There is a shift trick setting, it is used to smooth the result of calculations. You can see the changes if you reduce this parameter to 1 (minimum value). shift trick must always be less than the period value. Available averages: MA Simpl
FREE
Strong movement levels
Nikolay Mitrofanov
5 (2)
Looks for strong price movements and draws levels upon their completion. You determine the strength of the movement yourself by specifying in the settings the number of points and the number of candles of the same color in a row in one direction. There are 2 types of building in the settings: extrenum - high / low close - close price You can also adjust the number of displayed levels and the number of candles for calculations. By default, the settings indicate 5 levels for 360 candles. That
FREE
The indicator highlights in color the places on the chart where the price moves in one direction continuously from the selected number of candles. You can specify the number of points from the beginning of the movement to select only movements from this amount. It can be useful for looking for reversals or sharp impulses. I also recommend purchasing this utility to determine local weekly / monthly trends and support and resistance lines. https://www.mql5.com/en/market/product/61401
FREE
Trendline Equalizer
Nikolay Mitrofanov
1.5 (2)
When creating, modifying and moving a trend line, two anchor points will be selected: high / low, open / close, median or weighted from the candlestick prices. For high / low, open / close, if the anchor point is above the candlestick, the upper price will be taken, below the candlestick - the lower one. If the point is inside the candlestick, then if the first point is higher than the second, then the first one goes up, the second goes down. Conversely, if the second is higher than the first.
FREE
The indicator draws a normal chart by coloring it in colors based on prices calculated by the Heiken Ashi indicator algorithm. That is, the shape of the candles does not change. In fact, this is the same Heiken Ashi that does not distort the price chart. Then there will be a drawing of a cat, because there is nothing more to write about the indicator. .                                                       
FREE
Calculates pivot levels. It paints the histogram depending on the location of prices relative to these levels. Parameter values: style - select the type of display (Histogram, Line, Arrow) price - price, has little effect on the final look, but this can be customized timeframe - select a timeframe for calculating levels. color over pivot line - color of everything above the pivot level color under pivot line - color of everything below the pivot level pivot line intersection color - the color
FREE
Tapeworm
Nikolay Mitrofanov
The indicator converts two moving averages into histograms and paints their intersection area. There is a shift trick setting, it is used to smooth the result of calculations. You can see the changes if you reduce this parameter to 1 (minimum value). Available averages: MA Simple MA Exponential MA LinearWeighted MA Smoothed DEMA TEMA and RSI - as a bonus By default, the fast MA is displayed at the top of the histogram, and the slow one at the bottom. You can swap them if you like. shift tr
FREE
Levels of Pivots
Nikolay Mitrofanov
The utility draws reversal levels using the formulas for each of the selected number of candles: Pivot = (high + close + low) / 3 R1 = ( 2 * Pivot) - low S1 = ( 2 * Pivot) - high R2 = Pivot + (R1 -S1) R3 = high + ( 2 * (Pivot - low)) S2 = Pivot - (R1 - S1) S3 = low - ( 2 * (high - Pivot)) H = high L = low U = if the candle is bullish, then close. Otherwise - open D = if the candle is bullish, then open. Otherwise - close On any timeframe. After a new candle closes on the calculated timeframe
FREE
Fight of forces
Nikolay Mitrofanov
The indicator paints the candlesticks of the chart in colors calculated from the values of the strengths of the bulls and bears. It works like this: The values of the two indicators Bears and Bulls are taken, and who is stronger on the candlestick is compared. It's all. .
FREE
The indicator draws a colored histogram from comparisons of the strengths of bulls and bears. It works like this: The values ​​of two indicators Bears and Bulls are taken, who is stronger on the candlestick is compared, the column is filled in. It's all. .
FREE
筛选:
Michael-MT5
448
Michael-MT5 2024.08.18 10:11 
 

用户没有留下任何评级信息

[删除] 2021.10.03 12:17 
 

用户没有留下任何评级信息

Nikolay Mitrofanov
16492
来自开发人员的回复 Nikolay Mitrofanov 2021.10.03 18:48
Всё показывает на всех таймфреймах. Обновляет и рисует линии только на H1.
Попробуйте на пустой график применить, потому что возможно, что другие утилиты или индикаторы очищают экран от объектов.
回复评论
版本 3.0 2021.04.06
Новая версия. Только для уровней недели.
版本 2.63 2021.02.20
Добавлены дневные трендовые линии
版本 2.62 2021.02.09
add: настройка количества линий недельных трендов, которые должны быть продлены вправо.
版本 2.61 2021.02.09
bug fix: вычисление второй точки внутринедельного трендового уровня после обновления недельных максимумов и минимумов.
版本 2.6 2021.02.08
Трендовые линии внутри недели ограничены текущей неделей. Раньше с пятницы новое значение конца линии перебрасывалось на следующий рабочий день.
Рефакторинг.
版本 2.5 2021.02.04
fix: Порядок расчетов боров.
版本 2.4 2021.02.04
fix: Добавлено обновление чарта после отрисовки уровней.
版本 2.3 2021.02.04
fix: Удаление линий при обновлении новых максимумов/минимумов.
版本 2.2 2021.02.02
fix: отрисовка недельных динамических уровней
版本 2.1 2021.02.02
Добавлен выбор количества свечей для расчета, что бы не перегружать программу.