• Übersicht
  • Bewertungen (6)
  • Diskussion (22)
  • Neue Funktionen

X3 Chart Pattern Scanner MT4

3.67

Introduction to X3 Chart Pattern Scanner

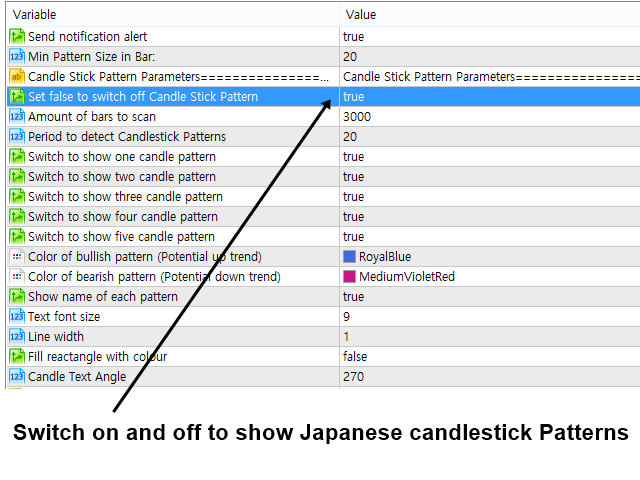
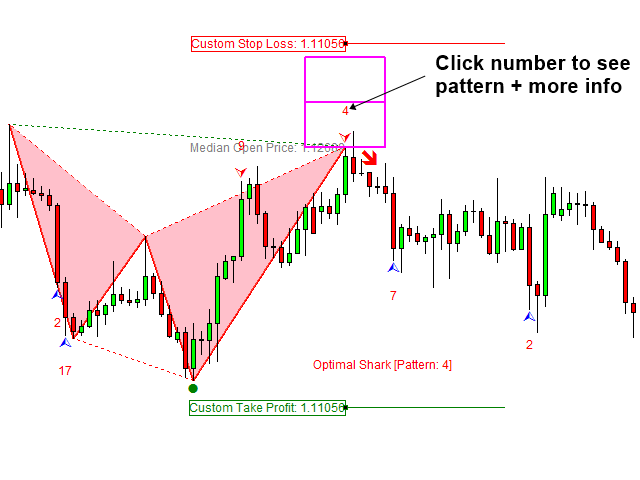
X3 Cherart Pattern Scanner is the non-repainting and non-lagging indicator detecting X3 chart patterns including Harmonic pattern, Elliott Wave pattern, X3 patterns, and Japanese Candlestick patterns. Historical patterns match with signal patterns. Hence, you can readily develop the solid trading strategy in your chart. More importantly, this superb pattern scanner can detect the optimal pattern of its kind. In addition, you can switch on and off individual patterns according to your preferences. For example, if you only want to trade harmonic patterns, then just switch off all Elliott Wave and X3 patterns. Also, note that each pattern is customizable with RECF notation. Japanese candlestick patterns are kind of bonus package added in the indicator. Japanese candlestick patterns can be used as the secondary confirmation for harmonic patterns, Elliott wave and X3 patterns. You can also switch on and off Japanese Candlestick patterns.


Harmonic Pattern Category

Detectable Harmonic Patterns include Optimal AB=CD, Optimal Butterfly Pattern, Optimal Gartley Pattern, Optimal Bat Pattern, Optimal Alternate Bat Pattern, Optimal Shark Pattern, Optimal Crab Pattern, Optimal Deep Crab Pattern, Optimal Cypher Pattern, Optimal 5-0 Pattern and Optimal 3 Drives Pattern.


Elliott Wave Pattern Category

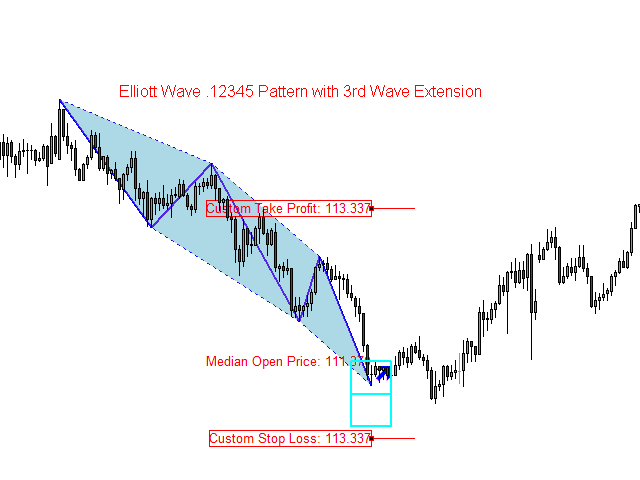
Detectable Elliott Wave patterns include Elliott Wave .1234 Pattern, Elliott Wave .12345 Pattern, Elliott Wave .12345AB Pattern and Elliot Wave .12345ABC Pattern. In addition, you can modify the structure of the Elliott Wave patterns as you wish.


X3 Chart Pattern Category

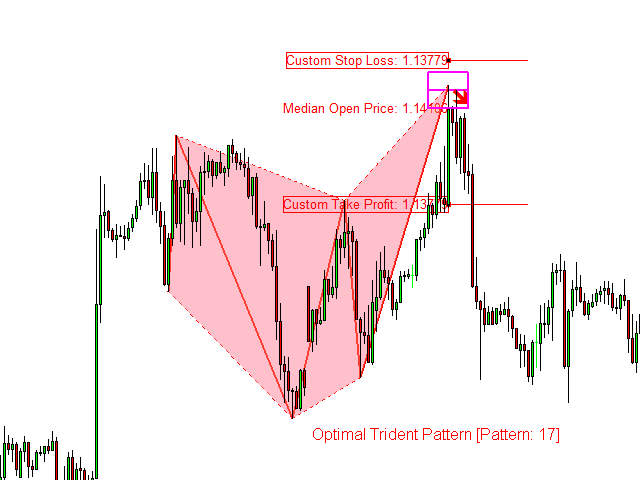
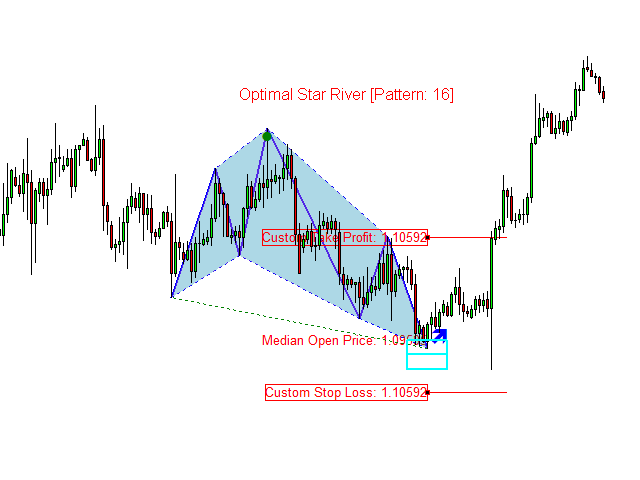
Detectable X3 Chart Pattern includes Star River Pattern, Trident Pattern, Horse Pattern, Eagle Pattern and Phoenix Pattern.


Japanese Candlestick Pattern Category

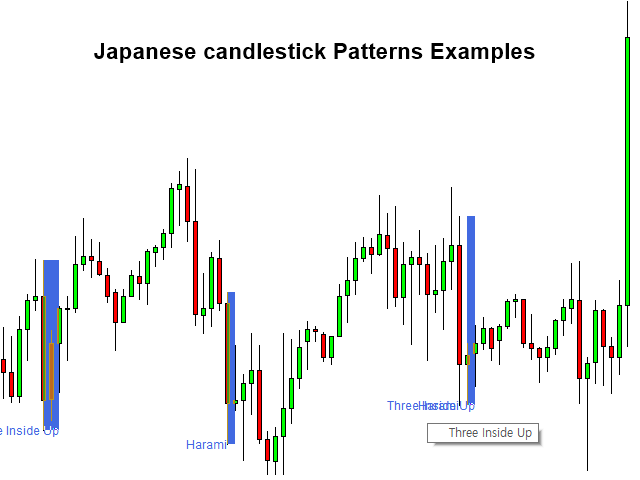
Detectable Japanese candlestick patterns include Engulfing, Piercing Line, Morning Star, Doji Star, Hammer, Harami and many more Japanese candlestick patterns also detetable.


Product Features

  • Non-repainting and non-lagging Harmonic pattern, Elliott Wave pattern and X3 Chart Pattern scanner
  • Pattern Completion Interval
  • Potential Reversal Zone
  • Potential Continuation Zone
  • Pattern Locking and Unlocking Feature
  • Interactive Stop Loss and Take Profit according to your Reward/Risk ratio
  • Historical Patterns
  • Can detect around 52 Japanese candlestick patterns
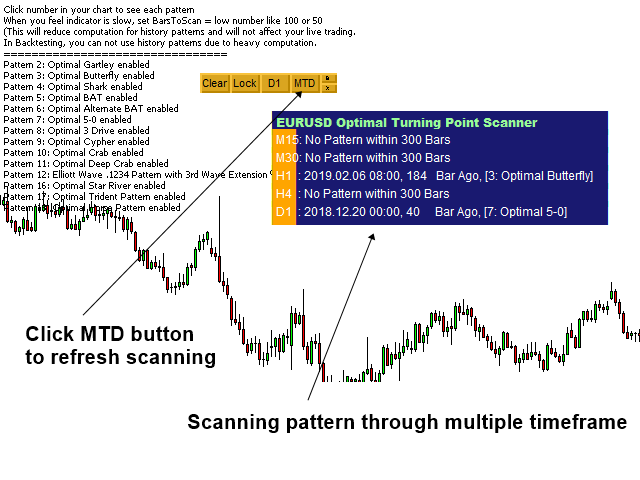
  • Multiple Timeframe Pattern Scanning for Harmonic pattern, Elliott Wave pattern, and X3 Pattern


Entry and Exit for Trading

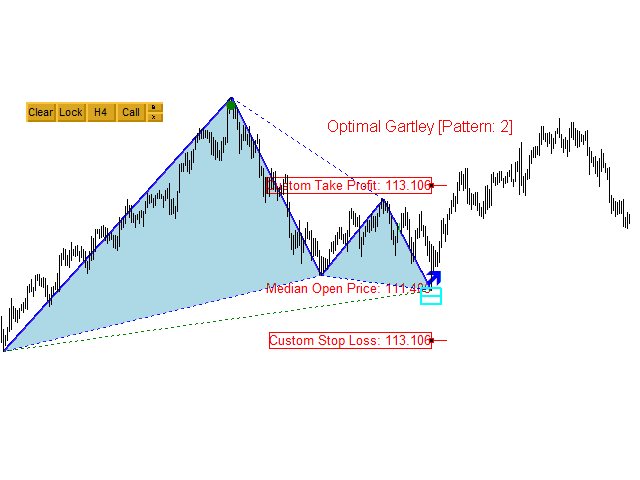
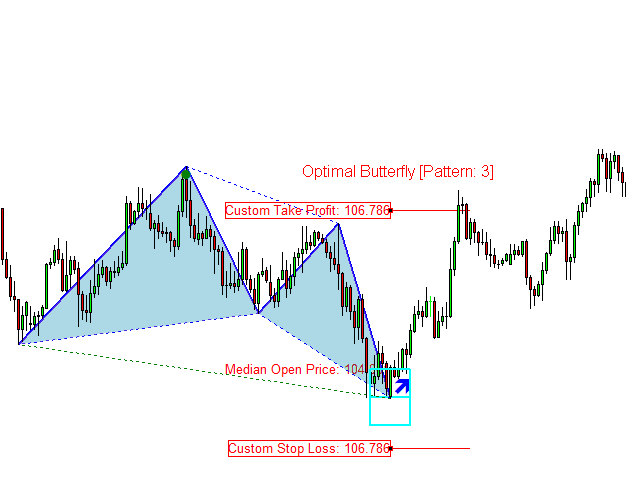
This indicator provides three essential components to trade and manage the trading risk including pattern completion interval, potential reversal zone and potential continuation zone. Provided stop loss and take profit levels are movable and adjustable. Potential reversal zone can be used to identify the location of turning point. Potential continuation zone can be used to predict future price move after turning point detection. Pattern Completion Interval is the tactical place where you can set breakeven, or trail stop your profit or to open new entry according to the market condition.


Secondary confirmation

Any experienced trader will recommend using secondary confirmation together with X3 chart patterns. Depending on your skill, you can combine various secondary confirmation technique with X3 Chart Pattern Scanner.

  • Other technical indicators (i.e. RSI, CCI, MACD, etc)
  • Supply Demand Analysis
  • Fundamental analysis
  • Elliott Wave Analysis
  • Triangle pattern, rising wedge and falling wedge patterns


Trading Strategy Guide

Detailed trading strategy can be found from the link below. We highly recommend reading this guide before using this indicator.

https://www.mql5.com/en/blogs/post/750344

https://www.mql5.com/en/blogs/post/750343


Important Note

X3 Chart Pattern Scanner provides many good patterns. However, use the patterns you like only as each pattern in the scanner can be switched on and off. This indicator is testable in strategy tester up to 80% of its features. Please test it before purchasing. This is the off the shelf product. Therefore, we do not accept any modification or customization request on this product. In addition, we do not provide any code library or any support for your coding for this product.


Bewertungen 6
Nemesio Jr Reyes
274
Nemesio Jr Reyes 2022.06.26 22:34 
 

amazing indicator

Capital Growth
215
Capital Growth 2020.01.24 11:37 
 

The software is great and young ho seo is a great programmer, shame it doesn't allow you to show patterns that are forming, but I understand I'm a M1 scalper and not many people do that, so I always need constant patterns that are forming. For harmonics and elliot waves, this one is the best scanner in the market, I tried them all so I know.

Empfohlene Produkte
Reversal Pattern Pro
Boonyapagorn Rodvattanajinda
Reversal Patterns Pro Reversal Patterns Pro is a Price Action (PA) analytical tool that scans the reversal patterns.  - Finds and marks the most dependable Japanese candlestick patterns in real-time. - Supports all time frames (Best for Scalping) - Doesn't repaint making it an exceptional indicator for Expert Advisors. Input parameters : - Support & Resistance Mode ( true or false ) for enabling advanced filtering - Donchian Period - RSI Period - RSI Oversold Level - RSI Overbought Level - Al
The indicator detects and displays М. Gartley's Butterfly pattern. The pattern is plotted by the extreme values of the ZigZag indicator (included in the resources, no need to install). After detecting the pattern, the indicator notifies of that by the pop-up window, a mobile notification and an email. The pattern and wave parameters are displayed on the screenshots. The default parameters are used for demonstration purposes only in order to increase the amount of detected patterns. Parameters z
Elliott Wave Trend was designed for the scientific wave counting. This tool focuses to get rid of the vagueness of the classic Elliott Wave Counting using the guideline from the template and pattern approach. In doing so, firstly Elliott Wave Trend offers the template for your wave counting. Secondly, it offers Wave Structural Score to assist to identify accurate wave formation. It offers both impulse wave Structural Score and corrective wave Structure Score. Structural Score is the rating to sh
Monster Harmonic Indicator
Paul Geirnaerdt
4.59 (29)
Monster Harmonics Indicator is a harmonic pattern indicator. It recognizes Gartley, Bat, Crab, Butterfly, Cypher, White Swan, Black Swan, Shark and several other patterns. Projected patterns that are not yet completed are recognized, too. Monster even shows the PRZ (Potential Reversal Zone). Users can add their own user defined patterns to Monster. Besides the current pattern, Monster also shows all patterns in the symbols history. Monster will provide alerts for developing patterns. Introduced
Vorstellung des Maravilla Square Indikators: Dein Werkzeug für vorausschauendes Trading Entdecke den Maravilla Square Indikator, deinen Schlüssel für vorausschauendes Trading. Dieses einzigartige Tool bietet Einblicke in Preisumkehrungen und präsentiert eine Trendlinie, die zwischen Hoch- und Tiefpunkten angepasst werden kann. Dynamik der Trendlinie: Der Maravilla Square Indikator führt die Trendlinie ein, die du an Hoch- und Tiefpunkte im Chart anpassen kannst. Diese dynamische Funktion schafft
FREE
PZ Harmonacci Patterns
PZ TRADING SLU
3.17 (6)
Dies ist wahrscheinlich der vollständigste Indikator für die automatische Erkennung der harmonischen Preisbildung, den Sie für die MetaTrader-Plattform finden können. Es erkennt 19 verschiedene Muster, nimmt Fibonacci-Projektionen genauso ernst wie Sie, zeigt die potenzielle Umkehrzone (PRZ) an und findet geeignete Stop-Loss- und Take-Profit-Werte. [ Installationsanleitung | Update-Anleitung | Fehlerbehebung | FAQ | Alle Produkte ] Es erkennt 19 verschiedene harmonische Preisbildungen Darges
Introduction This indicator detects volume spread patterns for buy and sell opportunity. The patterns include demand and supply patterns. You might use each pattern for trading. However, these patterns are best used to detect the demand zone (=accumulation area) and supply zone (=distribution area). Demand pattern indicates generally potential buying opportunity. Supply pattern indicates generally potential selling opportunity. These are the underlying patterns rather than direct price action. T
FREE
Introduction Harmonic Patterns are best used to predict potential turning point. Traditionally, Harmonic Pattern was identified manually connecting peaks and troughs points in the chart. Manual harmonic pattern detection is painfully tedious and not suitable for everyone. You are often exposed under subjective pattern identification with manual pattern detection. To avoid these limitations, Harmonic Pattern Plus was designed to automate your harmonic pattern detection process. The functionality
The Penta-O is a 6-point retracement harmonacci pattern which usually precedes big market movements. Penta-O patterns can expand and repaint quite a bit. To make things easier this indicator implements a twist: it waits for a donchian breakout in the right direction before signaling the trade. The end result is an otherwise repainting indicator with a very reliable trading signal. The donchian breakout period is entered as an input. [ Installation Guide | Update Guide | Troubleshooting | FAQ | A
Gartley Projection D
Oleksandr Medviediev
3.71 (7)
Der Indikator identifiziert die harmonischen Muster (XABCD) gemäß den Entwicklungen von H.M. Gartley („Profits in the Stock Market“, 1935г). Der D-Punkt wird als Punkt in der perspektivischen Projektion projiziert (geben Sie in den Einstellungen ProjectionD_Mode = true an). Wird nicht neu gezeichnet. Wenn ein Balken des Arbeitszeitraums schließt und sich der identifizierte Musterpunkt während der Balken von Patterns_Fractal_Bars nicht bewegt hat, erscheint ein Pfeil auf dem Diagramm (in Richt
Introduction to Harmonic Volatility Indicator Harmonic Volatility Indicator is the first technical analysis applying the Fibonacci analysis to the financial volatility. Harmonic volatility indicator is another level of price action trading tool, which combines robust Fibonacci ratios (0.618, 0.382, etc.) with volatility. Originally, Harmonic Volatility Indicator was developed to overcome the limitation and the weakness of Gann’s Angle, also known as Gann’s Fan. We have demonstrated that Harmonic
The   Fibonacci Confluence Toolkit   is a technical analysis tool designed to help traders identify potential price reversal zones by combining key market signals and patterns. It highlights areas of interest where significant price action or reactions are anticipated, automatically applies Fibonacci retracement levels to outline potential pullback zones, and detects engulfing candle patterns. Its unique strength lies in its reliance solely on price patterns, eliminating the need for user-define
PZ Wolfe Waves
PZ TRADING SLU
1 (1)
Wolfe Waves sind natürlich vorkommende Handelsmuster, die an allen Finanzmärkten vorhanden sind und einen Kampf um einen Gleichgewichtspreis darstellen. Diese Muster können sich über kurze und lange Zeiträume entwickeln und sind eines der zuverlässigsten prädiktiven Umkehrmuster, die es gibt und die normalerweise starken und langen Kursbewegungen vorausgehen. [ Installationsanleitung | Update-Anleitung | Fehlerbehebung | FAQ | Alle Produkte ] Klare Handelssignale Erstaunlich einfach zu handeln
The XR Gartley Pattern MT4 is an indicator which displays and alerts Gartley pattern detected on the candlestick chart. It also displays potential trade with calculated Take Profit and Stop Loss, Timeframe H1. After purchasing XR Gartley Pattern, you can immediately download this indicator from the MT4-MT5 Market and start using it because all features are set to default, is not necessary to change any parameter. In addition, we have created a  private group  for customers who have purchased one
FREE
Vanexio
Sayan Vandenhout
VANEXIO USES THE TREND WAVE INDICATOR AND IT CAN IDENTIFY THE BEGINNING AND THE END OF A NEW WAVE TREND MOVEMENT. AS AN OSCILLATOR, THE INDICATOR IDENTIFIES THE OVERBOUGHT AND OVERSOLD ZONES. IT WORKS GREAT TO CATCH THE SHORT TERM PRICE REVERSALS AND USES A MARTINGALE STRATEGY TO CLOSE ALL TRADES IN PROFIT. USE DEFAULT SETTINGS ON H1 OR HIGHER TIME FRAME ON ANY PAIR FOR MORE ACCURATE TRADES WHY THIS EA : Smart entries calculated by 5 great strategies The EA can be run on even a $20000 acco
FREE
Der Trendfänger: Die Strategie des Trendfängers mit Alarmindikator ist ein vielseitiges technisches Analysewerkzeug, das Händlern hilft, Markttrends und potenzielle Ein- und Ausstiegspunkte zu identifizieren. Sie verfügt über eine dynamische Trendfängerstrategie, die sich den Marktbedingungen anpasst, um eine klare visuelle Darstellung der Trendrichtung zu ermöglichen. Händler können die Parameter an ihre Vorlieben und Risikotoleranz anpassen. Der Indikator hilft bei der Trendidentifikation, s
FREE
All Symbols   AND  All Time frames Scan                                                                                                                 Document Introduction   The ABCD is a basic harmonic pattern. The ABCD pattern is a visual, geometric chart pattern comprised of three consecutive price swings. It looks like a diagonal lightning bolt and can indicate an upcoming trading opportu
Anubis Skunk
Sayan Vandenhout
Anubis Skunk USES THE TREND WAVE INDICATOR AND IT CAN IDENTIFY THE BEGINNING AND THE END OF A NEW WAVE TREND MOVEMENT. AS AN OSCILLATOR, THE INDICATOR IDENTIFIES THE OVERBOUGHT AND OVERSOLD ZONES. IT WORKS GREAT TO CATCH THE SHORT TERM PRICE REVERSALS AND USES A MARTINGALE STRATEGY TO CLOSE ALL TRADES IN PROFIT. USE DEFAULT SETTINGS ON H1 OR HIGHER TIME FRAME ON ANY PAIR FOR MORE ACCURATE TRADES WHY THIS EA : Smart entries calculated by 5 great strategies The EA can be run on even a $20000
Vanglutio
Sayan Vandenhout
VANGLUTIO USES THE TREND WAVE INDICATOR AND IT CAN IDENTIFY THE BEGINNING AND THE END OF A NEW WAVE TREND MOVEMENT. AS AN OSCILLATOR, THE INDICATOR IDENTIFIES THE OVERBOUGHT AND OVERSOLD ZONES. IT WORKS GREAT TO CATCH THE SHORT TERM PRICE REVERSALS AND USES A MARTINGALE STRATEGY TO CLOSE ALL TRADES IN PROFIT. USE DEFAULT SETTINGS ON H1 OR HIGHER TIME FRAME ON ANY PAIR FOR MORE ACCURATE TRADES WHY THIS EA : Smart entries calculated by 5 great strategies The EA can be run on even a $20000 ac
Auto Levels
Yaroslav Varankin
Auto Level this tool is able to determine the levels of support and resistance. search and display when the price has broken through the level and when it pushed off from it. the indicator can be useful if you use resistance support levels in your trading. or the highs and lows of the price, then it will greatly simplify your work and help you more quickly and more accurately determine the rebound or breakdown of the current trend or tendencies level. blue line bottom uptrend red line on top dow
Alpha Trend Zeichen ist seit langem ein sehr beliebtes Handelstool in unserem Unternehmen. Es kann unser Handelssystem überprüfen und Handelssignale klar anzeigen, und die Signale werden nicht driften. Hauptfunktionen: Anhand der Marktanzeige aktiver Bereiche können Indikatoren intuitiv bestimmen, ob der aktuelle Markttrend zu einem Trendmarkt oder zu einem volatilen Markt gehört. Und betreten Sie den Markt gemäß den Indikatorpfeilen, mit grünen Pfeilen für Kauf und roten Pfeilen für Verkauf
Day Pattern
Oleksandr Martsynyshen
Description: - D ay Pattern - an indicator that helps to identify patterns of price changes for the development of trading algorithms and strategies. For whom this tool? - For developers of trading strategies and algorithms. - Medium- and long-term traders. Time frames H1-W1. Features of the indicator: - There is a function of exporting indicator values to a file of the csv format. - Using the information panel, you can conduct an express analysis of trading tool. - The indicator is sui
The indicator provides a superior alternative to price action analysis. It enables the identification of normalized patterns, which are then transformed into a graphical representation to forecast future steps within a time series. In the top-left corner, you'll find information regarding the expected prediction accuracy, determined through a complex MSQE calculation. You have the flexibility to adjust the time window, making it easy to validate the indicator's performance. Additionally, you can
Crypto_Forex-Indikator „Hanging Man Pattern“ für MT4 – ohne Neulackierung und ohne Verzögerung. – Der Indikator „Hanging Man Pattern“ ist ein sehr leistungsstarker Indikator für Price Action Trading. – Der Indikator erkennt bärische Hanging Man Patterns im Chart: Rotes Pfeilsignal im Chart (siehe Bilder). – Mit Benachrichtigungen für PC, Mobilgeräte und E-Mail. – Der Indikator „Hanging Man Pattern“ lässt sich hervorragend mit Unterstützungs-/Widerstandsniveaus kombinieren. // Hervorragende Ha
Basic Harmonic Pattern
Mehran Sepah Mansoor
4.55 (56)
Dieser Indikator identifiziert die beliebtesten Harmonic Patterns , die Marktumkehrpunkte vorhersagen. Diese harmonischen Muster sind Kursformationen, die sich auf dem Devisenmarkt ständig wiederholen und auf mögliche zukünftige Kursbewegungen hindeuten / Free MT5 Version Darüber hinaus verfügt dieser Indikator über ein eingebautes Markteintrittssignal sowie über verschiedene Gewinnmitnahmen und Stop-Losses. Es ist zu beachten, dass der Harmonische Muster-Indikator zwar eigenständig Kauf-/Verk
FREE
This is an arrow indicator without a future function,developed based on the most advanced profit trading algorithms.It has the most innovative and advanced dual trend analysis module, as well as the latest and highly effective market trend prediction algorithm.Trends are your friends, and following larger trends can earn the maximum profit in foreign exchange. This indicator helps traders identify current trends and track them. Someone once made a profit of 10 times in a week by relying on it.No
Der Indikator baut einen Fächer von Trendlinien auf (nach dem Klicken auf eine bestimmte Kerze), ähnlich den klassischen Gann-Winkeln. Die Besonderheit des Indikators besteht darin, dass er Winkel nicht nur auf einer festen Skala aufbaut, sondern auch den Durchschnittspreis einer bestimmten Anzahl von Balken verwendet (optional). Es gibt zwei Möglichkeiten, den Durchschnittspreis für Winkel im Indikator zu berechnen (optional): 1) Berechnung der durchschnittlichen Preisbewegung (für eine besti
The indicator displays Renko bars on the chart, uses them to plot the ZigZag - trend lines connecting the local Lows and Highs of the price movement, and highlights them based on the Gartley patterns, showing the potential price reversal points. Renko - specialized display of the price action, in which the graph is displayed not every bar of the time frame, but only under the condition that the price had passed more than the specified number of points. Renko bars are not bound to a time frame, s
Line
Andrea Fontanini
free only until the end of the week The following indicator must be used and contextualized according to your trading methodologies. It provides excellent trading insights and identifies rejection zones on the drawn lines. Several parameters can be customized. The indicator will plot three levels above and below the opening price on D1, W1, and MN1. It will provide the daily ADR and display two additional daily sessions (EUROPE session and USA session). The colors of the various lines can be cu
FREE
Introduction Excessive Momentum Indicator is the momentum indicator to measure the excessive momentum directly from raw price series. Hence, this is an extended price action and pattern trading. Excessive Momentum Indicator was originally developed by Young Ho Seo. This indicator demonstrates the concept of Equilibrium Fractal Wave and Practical Application at the same time. Excessive Momentum detects the market anomaly. Excessive momentum will give us a lot of clue about potential reversal and
Käufer dieses Produkts erwarben auch
Cycle Maestro
Stefano Frisetti
HANDEL mit CYCLEMAESTRO Das Signal ist einfach und unmittelbar: Sobald der Hintergrund eines Bereichs grün oder rot wird, bedeutet dies, dass ein Handelssignal aktiv ist: GRÜN = KAUFEN und ROT = VERKAUFEN. Der HÄNDLER kann den HANDEL eröffnen und den nächsten Anweisungen folgen.  HINWEIS: CYCLEMAESTRO wird nur über diese Website vertrieben, es gibt keine anderen Vertriebshändler. Die DEMO-Version dient nur als Referenz und wird nicht unterstützt. Die endgültige Version wird unterstützt und f
Enigmera
Ivan Stefanov
5 (7)
ENIGMERA: Der Kern des Marktes Wichtig: Die MQL5.com-Demo wird im Strategy Tester ausgeführt und spiegelt möglicherweise nicht vollständig die Funktionalität von Enigmera wider. Überprüfen Sie die Beschreibung, Screenshots und das Video für Details. Zögern Sie nicht, mir bei Fragen eine Nachricht zu senden! Der Code des Indikators wurde vollständig neu geschrieben. Version 3.0 fügt neue Funktionen hinzu und behebt Fehler, die seit der Einführung des Indikators aufgetreten sind. Einführung Dies
Pairs Trading Dashboard - Spearman Correlation and Stationary Z-Score  is a custom indicator designed for the MetaTrader 4 (MT4) platform, developed to assist traders in analyzing and monitoring currency pairs for pairs trading strategies. It utilizes Spearman’s rank correlation coefficient and Z-Score calculations to identify trading signals across multiple timeframes and currency pairs. The indicator integrates various technical filters and stationarity tests to refine signal generation and di
Gold Channel is a volatility-based indicator, developed with a specific timing algorithm for the XAUUSD pair, which consists of finding possible corrections in the market. This indicator shows two outer lines, an inner line (retracement line) and an arrow sign, where the theory of the channel is to help identify overbought and oversold conditions in the market. The market price will generally fall between the boundaries of the channel. If prices touch or move outside the channel it is a tradi
This indicator works on MT4 and is very easy to use. When you receive a signal from it, you wait for that candle with the signal to close and you enter your trade at the beginning of the next new candle . A red arrow means sell and a green arrow means buy. All arrows comes with Alert  like for easy identification of trade signal. Are you okay with that? 1 minute candle 1 minute expire
Bomb Bank Signal
Igor Pereira Calil
5 (1)
Bombenbanksignal: Ihr Vertrauensindikator in MetaTrader 4 Bomb Bank Signal ist ein leistungsstarker Indikator für MetaTrader 4, der entwickelt wurde, um die relevantesten Trends auf dem Finanzmarkt zu identifizieren. Wenn Sie nach einem Tool suchen, das Bewegungen genau vorhersieht, ist die Bomb Bank der Verbündete, den Sie brauchen. So funktioniert es: Dieser Indikator kombiniert drei unterschiedliche Methoden – Volumenanalyse, Kerzenschließungen und symmetrischer Trend –, um Kauf- und Verk
TrendMaestro
Stefano Frisetti
4 (4)
note: this indicator is for METATRADER4, if you want the version for METATRADER5 this is the link:  https://www.mql5.com/it/market/product/108106 TRENDMAESTRO ver 2.4 TRENDMAESTRO recognizes a new TREND in the bud, he never makes mistakes. The certainty of identifying a new TREND is priceless. DESCRIPTION TRENDMAESTRO identifies a new TREND in the bud, this indicator examines the volatility, volumes and momentum to identify the moment in which there is an explosion of one or more of these data a
Linear Trend Predictor – Ein Trendindikator, der Einstiegspunkte und Richtungsunterstützungslinien kombiniert. Funktioniert nach dem Prinzip des Durchbrechens des Hoch-/Tiefpreiskanals. Der Indikatoralgorithmus filtert Marktrauschen und berücksichtigt Volatilität und Marktdynamik. Indikatorfunktionen  Mithilfe von Glättungsmethoden zeigt es den Markttrend und Einstiegspunkte zum Öffnen von Kauf- oder Verkaufsaufträgen an.  Geeignet zum Bestimmen kurzfristiger und langfristiger Marktbewegungen
EARLY REMINDER: The Starting price is 65 price will rise soon up to 365$ and then 750$ after first 10 copies of sales. Grab this offer now! Introduction Hello, traders! Welcome to the demonstration of the Forex Beast Indicator , a comprehensive tool designed to assist aspiring traders in navigating the complexities of the forex market. This indicator incorporates seven essential components to provide a well-rounded trading experience: Moving Averages Colored Zones Support and Resistance Levels
Pair Trading Strategy Based on Spearman Correlation and Stationary Z-Score  is A single-pair indicator focusing on one primary symbol (chart symbol) and one secondary symbol for the MetaTrader 4 (MT4) platform, designed to support pairs trading by analyzing the correlation between two currency pairs. It employs Spearman’s rank correlation coefficient, Z-Score calculations, and stationarity testing to generate trading signals, displayed in a subwindow and on the main chart. The indicator integra
Hit Rate Top Bottom Signal
Martin Alejandro Bamonte
Hit Rate Top Bottom Signal Hit Rate Top Bottom Signal Hit Rate Top Bottom Signal bietet einen völlig innovativen Ansatz. Es ist ideal für diejenigen, die im Voraus bewerten möchten, wie das Signal mit einem bestimmten TP-SL funktioniert und in welchen PAAREN/TFs es am besten abschneidet. Die Strategie Hit Rate Top Bottom Signal ist ein grundlegendes Werkzeug für jeden Trader und jede Art von Handel , denn sie gibt nicht nur präzise, nicht-neuzeichnende Signale ab, die klar anzeigen, wann und in
MQTVolume
Joaquin Gual Moreno
5 (1)
This indicator marks the long or short force of each candle. Green = long. Red = Short Parameters: The periods serve to make the indicator functions faster or slower. We recommend to run faster periods 4-10 or slower periods 12-26. PeriodFast : Numbers of Bars used for the calculations of fast period (Recommended value 4) PeriodSlow : Numbers of Bars used for the calculations of slow period (Recommended value 10)
This is a mini version(One pair) of Advanced Detector of Trend Reversal and Continuance known as TrueTrendStarM(TTSm25). It is a sensitive and Predictive indicator of Price Trends for Professional traders.  BIG ONE TIME DISCOUNT 50% !!!( Not 20% !)  ( ATTENTION BUYERS:- PLEASE CONTACT ME FOR HOW BEST TO USE THE INDICATOR FOR MAXIMUM PROFITS )    It detects high odds changes in Price Trend direction long before other indicator detects it. I have been working on it since 2019.    This is possi
Trade Invest Pro - Boss in der Welt der Kryptowährung! Dieser Indikator ist ideal für den Handel mit Kryptowährungen! Die Arbeit an Trade Invest Pro hat ein halbes Jahr gedauert! Aber nicht umsonst! Jetzt nur noch genaue Signale in der Nähe der Unterstützung - Widerstandsniveaus! Er zeigte sich gut auf den Zeitrahmen m5 m15 für binäre Optionen! Optional kann es für Forex für Zeitrahmen m30 und mehr konfiguriert werden! Reagiert gut auf Nachrichten! Malt nicht! und verschwindet nicht aus
Binary Booster
Yaroslav Varankin
5 (1)
Binary Options Trading Indicator: A Reliable Tool for Your Trades This indicator is specifically designed for binary options trading and has proven its high quality, reliability, and adequate accuracy, depending on the dynamics of the chart. Key Points: Signal Interpretation: When a blue cross signal appears, it indicates a potential entry into a trade, though it is considered a weak signal on its own. However, if the blue cross is accompanied by an arrow, it is considered a more reliable buy s
ZO Trend
Trung Le Hoang
4 (4)
Important!! ZO Trend can't work on MN timeframe. /*--------------------------------------------------------------------------------------------------------------------------------------------------------------------------------------------- ZO Trend an indicator used to search for entry point. With the session candle algorithm on many timeframe, ZO Trend creates an area for traders find good Entry Point. ZO SYSTEM BASIC SETUP :  https://www.youtube.com/watch?v=qdNOXHWozNw ZO TREND User guide : 
Super Zone
Dmitriy Sotnikov
Several years of observing the principles of the operation of the Super Zone market worked, then and now, because the indicator allows you to see the trading range of the week and even the month that large market participants use. We are very easy to use on the H4 in the weekly range ( in the tester it not work in the demo mode ) - we sell from the upper zones and buy from the lower zones. Marks zones from the beginning of the week (month) that do not redraw , works on almost all currency pairs
Dark Sniper
Dmitriy Kashevich
Dark Sniper pointer indicator.  Complete absence of redrawing   The percentage of correct indicator forecasts depends on your settings; the default is period 7 (performed better) The arrow indicates the direction of the next candle and the possible direction of the trend in the future.  Suitable for small timeframes m1 and m5  It is recommended to open transactions from 1 to 2 candles.  The signal appears on the current candle. Open a trade on the next one since the signal is being generat
Algo Trading Indicaor  With this indicator , you’ll have zones and trends that hight probability the price will reverse from it. so will gives you all the help that you need  Why should you join us !?  1-This indicator is logical since it’s working in previous days movement , to predict the future movements. 2-Algo trading indicator will help you to draw trends which is special and are too strong than the basics trend , trends will change with the frame time that you work on . 3-We can use
How to use Pair Trading Station Pair Trading Station is recommended for H1 time frame and you can use it for any currency pairs. To generate buy and sell signal, follow few steps below to apply Pair Trading Station to your MetaTrader terminal. When you load Pair Trading Station on your chart, Pair Trading station will assess available historical data in your MetaTrader platforms for each currency pair. On your chart, the amount of historical data available will be displayed for each currency pai
Hello Dear Trader, Today Im Telling You About The "Golden Scalp System V1 " Metatrader4 Golden Scalp System Scalper with EMA   This is a  Scalper strategy   based on ( Exponential moving average) EMA . Time frame: H1 Pair: EUR/USD, GBP/USD,AUD/USD XAU/USD Platform Mt4   Indicators for Scalper with Ema: 300  EMA (Exponential Moving Average) ; 500 EMA (Expontial Moving Average); Stochastic   (5,3,3)   Long Entry 1) 300  EMA   > 500  EMA . 2) Find significant levels of support. 3) Wait for the c
The Nihilist 5.0 Indicator includes Forexalien and Nihilist Easy Trend trading strategies and systems. It is composed of an MTF Dashboard where you can analyze the different input possibilities of each strategy at a glance. It has an alert system with different types of configurable filters. You can also configure which TF you want to be notified on your Metatrader 4 platform and Mobile application The indicator has the option to view how could be a TP and SL by using ATR or fixed points, even w
Description Very precise patterns to detect: entry signals as well as breakout, support and resistance reversal patterns. It points out zones in which, with a high probability, institutional orders with the potential to change the price’s direction and keep moving towards it, have been placed.  KEY LINKS:   Indicator Manual  –  How to Install   –  Frequent Questions  -  All Products  How is this indicator useful? It will allow you to trade on the order’s direction, once its direction has been id
Hidden Cross Binary Options
Ellan Dirgantara Tholkhah
The latest Binary Options arrow indicator in the Garuda Signals product line. Binary options signal based on multiple time frame cross over analysis. Gets confirmation from the most consistent signals known to man; Ichimoku, SMA, Bollinger Bands; and also uses the 1 Hour time frame as trend confirmation , so you don't have to open up multiple chart and waste time. - Can be used for all time frames up to 1 hour, but is most POWERFUL for 1 and 5 min options. - Place your Call/PUT based on the Arro
Magic M2
Tuan Anh Dao
4.5 (8)
------ GOOD LUCK   -----   (Telegram: @MagicBinary) The indicator allows you to trade binary options. T his indicator give high winning ratio with over 20 years of backtesting  The recommended time frame is М1 and the expiration time is 3, 5 minutes. The indicator suitable for Auto and Manual trading. A possible signal is specified as a arrows above/under a candle. You can entry current candle /intrabar or can wait until candle close Arrows are not re-painted Trade sessions: Any/ Rec
Automatic, live & interactive picture of all trendlines. Assign push, email and sound alerts to the lines of your choice and be informed about price rollback, breakout, rollback after breakout, number of rollbacks, line expiration by double breakout. Correct, drag or delete the lines and interactively tune the line system. https://youtu.be/EJUo9pYiHFA . Chart examples https: //www.mql5.com/en/users/efficientforex Price Interaction Events All events are effective immediately and only after one
A. Was ist A2SR ?   * Es ist ein führender technischer Indikator (kein Repaint, kein Verzögern). -- Orientierungshilfe : -- unter  https://www.mql5.com/en/blogs/post/734748/page4#comment_16532516 -- und  https://www.mql5.com/en/users/yohana/blog A2SR verfügt über eine spezielle Technik zur Bestimmung der Unterstützungsniveaus (Nachfrage) und des Widerstands (Angebot). Im Gegensatz zu der gewöhnlichen Methode, die wir im Internet gesehen haben, hat A2SR ein originelles Konzept zur Bestimmung de
The indicator displays the probable ( Support and resistance ) levels. The indicator draws horizontal and trend levels of support and resistance. The indicator settings: Trends - the mode for displaying trend lines or horizontal lines of support and resistance Yes - display trend lines only No - display horizontal lines only UseResource - use the resources built into the indicator. Yes - use the ZigZag indicator from the resources of the product. No - use a custom ZigZag indicator. HistoryBar -
Simply drop the indicator to the chart and Fibonacci levels will be shown automatically! The indicator is developed for automatic drawing of Fibonacci levels on the chart. It provides the abilities to: Select the standard Fibo levels to be shown Add custom levels Draw the indicator on the timeframes other than the current one. For example, the indicator is calculated on the weekly period (W1) and is displayed on the monthly period (MN1) Select the timeframes the indicator will be available on Ca
The indicator of a Professional Trader is an arrow indicator for predicting the direction of price movement. I have been working on this indicator since 2014. You can use this indicator as your main indicator, use its entry signals, and use it as your only indicator to find entry points. About the product: Recommended TF [H4-D1-W1]   . The indicator predicts the direction of the next candle. Fits a variety of tools; Flexibility in settings for different instruments and intervals through the MO
Weitere Produkte dieses Autors
Einführung in den Harmonic Pattern Scenario Planner Der gegenwärtige Zustand des Devisenmarktes kann viele verschiedene mögliche Preispfade durchlaufen, um sein zukünftiges Ziel zu erreichen. Die Zukunft ist dynamisch. Daher ist die Planung Ihres Handels mit möglichen Zukunftsszenarien ein wichtiger Schritt für Ihren Erfolg. Um einem solch mächtigen Konzept gerecht zu werden, stellen wir Ihnen den Harmonic Pattern Scenario Planner vor, das erste prädiktive Harmonic Pattern Tool der Welt unter s
Introduction to Chart Pattern MT Chart Pattern MT is a chart pattern scanner to detect the triangle pattern, falling wedge pattern, rising wedge pattern, channel pattern and so on. Chart Pattern MT uses highly sophisticated chart pattern detection algorithm. However, we have designed it in the easy to use with intuitive user interface. Chart Pattern MT will show all the patterns in your chart in the most efficient format for your trading. You do not have to do tedious manual pattern detection an
Introduction to Fractal Pattern Scanner Fractal Indicator refers to the technical indicator that makes use of the fractal geometry found in the financial market. Fractal Pattern Scanner is the advanced Fractal Indicator that brings the latest trading technology after the extensive research and development work in the fractal geometry in the financial market. The most important feature in Fractal Pattern Scanner is the ability to measure the turning point probability as well as the trend probabi
Einführung in den Fractal Pattern Scanner Fractal Indicator bezieht sich auf einen technischen Indikator, der die fraktale Geometrie des Finanzmarktes nutzt. Fractal Pattern Scanner ist ein fortschrittlicher Fraktalindikator, der nach umfangreichen Forschungs- und Entwicklungsarbeiten im Bereich der fraktalen Geometrie auf dem Finanzmarkt die neueste Handelstechnologie bietet. Das wichtigste Merkmal von Fractal Pattern Scanner ist die Fähigkeit, die Wahrscheinlichkeit des Wendepunkts sowie die T
Ace Angebot-Nachfrage-Zonen-Indikator Das Konzept der Angebots-Nachfrage-Zone beruht auf dem quantitativen Missverhältnis zwischen Kauf- und Verkaufsvolumen auf dem Finanzmarkt. Die Angebots- und Nachfragezone kann einen guten Ein- und Ausstieg bieten. Eine Zone ist leichter zu handeln als eine Linie. Die Angebots-Nachfrage-Zone kann einen detaillierten Handelsplan und ein Risikomanagement ermöglichen. Ihre Fähigkeit, die Marktrichtung vorherzusagen, ist hoch. Der Ace Supply Demand Zone Indicato
Elliott Wave Trend wurde für die wissenschaftliche Wellenzählung entwickelt. Dieses Tool konzentriert sich darauf, die Unschärfe der klassischen Elliott-Wellenzählung zu beseitigen, indem es die Richtlinien des Template- und Pattern-Ansatzes nutzt. Dabei bietet Elliott Wave Trend erstens die Vorlage für Ihre Wellenzählung. Zweitens bietet es den Wave Structural Score, um die genaue Wellenbildung zu identifizieren. Es bietet sowohl den Structural Score für Impulswellen als auch den Structure Scor
Price Breakout pattern Scanner is the automatic scanner for traders and investors. It can detect following patterns automatically from your chart. Head and Shoulder - Common tradable pattern. Reverse Head and Shoulder - This pattern is the reverse formation of the Head and Shoulder. Double Top - When the price hits resistance level twice and decline toward the support level, the trader can anticipate sudden bearish breakout through the support level. Double Bottom - The double bottom pattern is
Die Peak-Trough-Analyse ist ein großartiges Werkzeug zur Erkennung von Spitzen und Tälern in Ihrem Diagramm. Das Tool Peak Trough Analysis kann drei verschiedene Algorithmen zur Erkennung von Spitzen und Tälern verwenden. Zu den drei Algorithmen gehören der Signal-Fraktal-Indikator von Bill Williams, der modifizierte Fraktal-Indikator und der ZigZag-Indikator. Sie können dieses Peak- und Trough-Analyse-Tool verwenden, um das Preismuster zu erkennen, das sich aus dem Equilibrium Fractal-Wave-Proz
FREE
Einführung Harmonische Muster eignen sich am besten zur Vorhersage potenzieller Wendepunkte. Traditionell wurden Harmonic Patterns manuell identifiziert, indem man Spitzen- und Tiefpunkte im Chart miteinander verband. Die manuelle Erkennung harmonischer Muster ist mühsam und nicht für jedermann geeignet. Bei der manuellen Erkennung von Mustern ist man oft subjektiven Einschätzungen ausgesetzt. Um diese Einschränkungen zu vermeiden, wurde Harmonic Pattern Plus entwickelt, um den Prozess der Erken
Einführung Dieser Indikator erkennt Volumen-Spread-Muster für Kauf- und Verkaufsgelegenheiten. Die Muster umfassen Nachfrage- und Angebotsmuster, die Sie für den Handel verwenden können. Diese Muster sind jedoch am besten geeignet, um die Nachfragezone (=Kumulierungsbereich) und die Angebotszone (=Verteilungsbereich) zu erkennen. Das Nachfragemuster zeigt im Allgemeinen eine potenzielle Kaufgelegenheit an. Das Angebotsmuster deutet im Allgemeinen auf eine potenzielle Verkaufsgelegenheit hin. Es
FREE
Einführung in Sideways Market Analyzer Ein bemerkenswerter Zeitraum mit geringer Volatilität und trendlosen Bewegungen auf dem Finanzmarkt wird als Seitwärtsmarkt bezeichnet. Früher oder später wird die geringe Volatilität zunehmen und der Kurs wird nach dem Seitwärtsmarkt einen Trend aufnehmen. Unter Handelsgesichtspunkten kann ein Seitwärtsmarkt als sehr guter Einstiegszeitpunkt für Händler dienen. Der Sideways Market ist auch häufig Ausdruck einer Ansammlung von Großaufträgen von Großanlegern
Einführung Dieser Indikator erkennt Volumen-Spread-Muster für Kauf- und Verkaufsgelegenheiten. Die Muster umfassen Nachfrage- und Angebotsmuster, die Sie für den Handel verwenden können. Diese Muster sind jedoch am besten geeignet, um die Nachfragezone (=Kumulierungsbereich) und die Angebotszone (=Verteilungsbereich) zu erkennen. Das Nachfragemuster zeigt im Allgemeinen eine potenzielle Kaufgelegenheit an. Das Angebotsmuster deutet im Allgemeinen auf eine potenzielle Verkaufsgelegenheit hin. Es
Einführung in Fractal Moving Average Der Indikator Fractal Moving Average wurde als Teil des Fractal Pattern Scanners entwickelt. Innerhalb des Fractal Pattern Scanners wurde der Fractal Moving Average Indikator als eine Vielzahl von Chart-Objekten implementiert. Bei über Tausenden von Chart-Objekten haben wir festgestellt, dass dies nicht die beste und effizienteste Art war, den Indikator zu betreiben. Es war zu rechenintensiv für den Indikator. Daher haben wir uns entschlossen, die Indikatorve
FREE
Ace Supply Demand Zone Indicator The concept of supply demand relies on the quantity mismatching between buying and selling volumes in the financial market. Supply and demand zone can provide the good entry and exit. A zone is easier to trade than a line. The supply demand zone can provide the detailed trading plan and the risk management. Its ability to predict market direction is high. There are two distinctive points about Ace Supply Demand Zone Indicator. Ace Supply Demand Zone indicator was
Peak Trough Analysis is the great tool to detect peaks and troughs in your chart. Peak Trough Analysis tool can use three different peaks and troughs detection algorithm. The three algorithm include the orignal Fractals Indicator by Bill Williams, the Modified Fractals indicator and ZigZag indicator. You can use this peak and trough analysis tool to detect the price pattern made up from Equilibrium Fractal-Wave process. For further usage, there are good guide line on how to use this peak trough
FREE
Introduction This indicator detects volume spread patterns for buy and sell opportunity. The patterns include demand and supply patterns. You might use each pattern for trading. However, these patterns are best used to detect the demand zone (=accumulation area) and supply zone (=distribution area). Demand pattern indicates generally potential buying opportunity. Supply pattern indicates generally potential selling opportunity. These are the underlying patterns rather than direct price action. T
FREE
Auto Chart Alert MT5
Young Ho Seo
3.83 (6)
Einführung Auto Chart Alert ist ein praktisches Tool, um Alarme für Ihren Handel in Ihrem Chart zu setzen. Mit Auto Chart Alert können Sie die Alarmlinie mit einem Klick an die gewünschte Stelle in Ihrem Chart setzen. Auto Chart Alert ist ein großartiges Tool, wenn Sie auf wichtige Unterstützungs- und Widerstandsniveaus für Ihren Handel achten müssen. Sie können einen akustischen Alarm, eine E-Mail und eine Push-Benachrichtigung erhalten, wenn der Kurs die Alarmlinie an der von Ihnen gewünschte
FREE
Einführung in den Timebox-Indikator Der Time Box Indicator ist ein unverzichtbarer Indikator für jeden Trader. Er zeigt tägliche, wöchentliche und monatliche Boxen an, je nach Ihren Präferenzen. Sie können jedoch alle wichtigen Kursniveaus in Ihrem Chart automatisch erweitern. Sie können diese als wichtige Unterstützungs- und Widerstandsniveaus verwenden. Es ist ein sehr einfaches, aber effektives Werkzeug für Ihren Handel. Grafik-Einstellung Weißes Diagramm verwenden Linienstil für den aktuell
FREE
Einführung in den Wendepunktindikator Die Trajektorien der Finanzmarktbewegungen ähneln sehr stark den polynomialen Krümmungen mit dem Vorhandensein von Zufallsschwankungen. Es ist allgemein bekannt, dass Wissenschaftler die Finanzdaten in viele verschiedene zyklische Komponenten zerlegen können. Wenn der Finanzmarkt mindestens einen Zyklus aufweist, dann muss der Wendepunkt für diese Finanzmarktdaten vorhanden sein. Unter dieser Annahme sollten die meisten Finanzmarktdaten eine Vielzahl von Wen
Introduction To Time Box Indicator Time Box Indicator is a must have indicator for any trader. It will display daily, weekly and Monthly box according to your preferences. Yet, you can extend any important price levels in your chart automatically. You can use them as the significant support and resistance levels. It is very simple but effective tool for your trading. Graphic Setting Use White Chart Line Style for Current Open price Daily Setting Update Timeframe for daily box Number of days to
FREE
How to use Pair Trading Station Pair Trading Station is recommended for H1 time frame and you can use it for any currency pairs. To generate buy and sell signal, follow few steps below to apply Pair Trading Station to your MetaTrader terminal. When you load Pair Trading Station on your chart, Pair Trading station will assess available historical data in your MetaTrader platforms for each currency pair. On your chart, the amount of historical data available will be displayed for each currency pai
Einführung in das Auftragsrisikomanagement EA ORM EA wurde speziell für die schnelle und präzise Ausführung von Marktaufträgen entwickelt, die mit unseren unten aufgeführten Price Action- und ökonometrischen Handelsstrategien verwendet werden können. ORM EA ist vollautomatisch und ORM EA ist sehr einfach zu bedienen. ORM EA ist völlig kostenlos. Sie können diese robuste Auftragsausführungsfunktion dieses ORM EA auch für jede andere Ihrer eigenen Handelsstrategien verwenden. Handelsstrategie-Lei
FREE
Einführung in das Risikomanagement von Support Resistance Support Resistance ist die vertrauenswürdigste technische Analyse. Allerdings wird das Risikomanagement für die Unterstützung und den Widerstand nicht oft praktiziert. Daher stellen wir eine effektive Risikomanagement-Methode für den Unterstützungs- und Widerstandshändler vor. In dem Buch: Scientific Guide To Price Action and Pattern Trading (Wisdom of Trend, Cycle, and Fractal Wave) wird beschrieben, wie man Support Resistance, Fibonacci
Einführung in den GARCH-Indikator GARCH ist die Abkürzung für Generalized Autoregressive Conditional Heteroskedasticity (verallgemeinerte autoregressive bedingte Heteroskedastizität) und ist ein in der Finanzbranche häufig verwendetes Volatilitätsvorhersagemodell. Das GARCH-Modell wurde erstmals 1986 von dem dänischen Wirtschaftswissenschaftler Tim Peter Bollerslev vorgestellt. Der Nobelpreisträger von 2003, Robert F. Engle, leistete mit Tims Arbeit ebenfalls einen wichtigen Beitrag zur Verfeine
FREE
Introduction to Fractal Moving Average Fractal Moving Average indicator was designed as part of Fractal Pattern Scanner. Inside Fractal Pattern Scanner, Fractal Moving Average Indicator was implemented as multiple of chart objects. With over thousands of chart object, we find that it was not the best and efficient ways to operate the indicator. It was computationally too heavy for the indicator. Hence, we decide to implement the indicator version of Fractal Moving Average indicator to benefit o
FREE
Introduction to Order Risk Management EA ORM EA is specially designed for fast and accurate market order execution to be used with our Price Action and Econometric Trading strategies listed below. ORM EA is fully automatic and ORM EA is also very easy to use. ORM EA is totally free of charge. You can also use this robust order execution feature of this ORM EA for any other your own trading strategy. Trading Strategy Guide Order Risk Management EA provides the guide for the risk management for y
FREE
Introduction to GARCH Indicator GARCH is the short initial for Generalized Autoregressive Conditional Heteroskedasticity and it is the volatility prediction model commonly used in financial industry. GARCH model was first appeared in the work by Danish Economist, Tim Peter Bollerslev in 1986. The 2003 Nobel Prize winner, Robert F Engle also added much contribution for the refinement of GARCH model with Tim’s work. Our GARCH INM predictor took the original method of Nelder Mead for GARCH model bu
FREE
Elliott Wave Trend was designed for the scientific wave counting. This tool focuses to get rid of the vagueness of the classic Elliott Wave Counting using the guideline from the template and pattern approach. In doing so, firstly Elliott Wave Trend offers the template for your wave counting. Secondly, it offers Wave Structural Score to assist to identify accurate wave formation. It offers both impulse wave Structural Score and corrective wave Structure Score. Structural Score is the rating to sh
Einführung in den X3 Chart Pattern Scanner X3 Cherart Pattern Scanner ist ein nicht nachzeichnender und nicht nachlaufender Indikator zur Erkennung von X3 Chartmustern, einschließlich Harmonic Pattern, Elliott Wave Pattern, X3 Pattern und Japanese Candlestick Pattern. Historische Muster stimmen mit Signalmustern überein. So können Sie leicht eine solide Handelsstrategie in Ihrem Chart entwickeln. Noch wichtiger ist, dass dieser großartige Musterscanner das optimale Muster seiner Art erkennen kan
Auto Chart Alert MT4
Young Ho Seo
5 (2)
Introduction Auto Chart Alert is a convenient tool to set alert for your trading in your chart. With Auto Chart Alert, you can set the alert line in one click in your desired location in your chart. You can even set alert over the sloped lines in your chart. Auto Chart Alert is a great tool when you have to watch out importnat support and resistance levels for your trading. You can receive the sound alert, email and push notification when the price hit the alert line at you desired location. Au
FREE
Auswahl:
elite luis
3351
elite luis 2023.03.09 14:09 
 

Der Benutzer hat keinen Kommentar hinterlassen

kylewisani
181
kylewisani 2023.02.12 17:13 
 

Too much false signals

Nemesio Jr Reyes
274
Nemesio Jr Reyes 2022.06.26 22:34 
 

amazing indicator

Fregatt888
588
Fregatt888 2020.07.23 20:03 
 

Индикатор слабый связаться с разработчиком проблематично. Зря потраченные деньги... не стоит он таких денег.

majed237
167
majed237 2020.03.30 06:06 
 

I can not find any signal in chart iwont return my money

Capital Growth
215
Capital Growth 2020.01.24 11:37 
 

The software is great and young ho seo is a great programmer, shame it doesn't allow you to show patterns that are forming, but I understand I'm a M1 scalper and not many people do that, so I always need constant patterns that are forming. For harmonics and elliot waves, this one is the best scanner in the market, I tried them all so I know.

Antwort auf eine Rezension
Version 8.71 2022.01.12
In version 8.71, we reinforced the zone concept in X3 Chart Pattern Scanner. Zone is the extended concept from the Horizontal Support and Resistance in technical analysis. Zone is the great tool to decide your trading entry and exit as well as managing your risk and reward. Since we understand the importance of the zone concept, we provide the reinforced version of the Pattern Completion Interval for Harmonic Pattern and X3 Chart Pattern in the new version of X3 Chart Pattern Scanner. As before, you can lock this trading zone for the multiple timeframe analysis.
Version 8.70 2020.11.24
In version 8.70, we have recompiled X3 Chart Pattern Scanner in the latest Metaeditor compiler. It is minor update only. But it is recommended to use this latest version of X3 Chart Pattern Scanner.
Version 8.67 2020.06.27
In version 8.67, We have change the outlook of Multiple Timeframe Pattern Detection, In the Multiple Timeframe Pattern Panel, you can also check the size of chart pattern too.
Version 8.66 2020.02.05
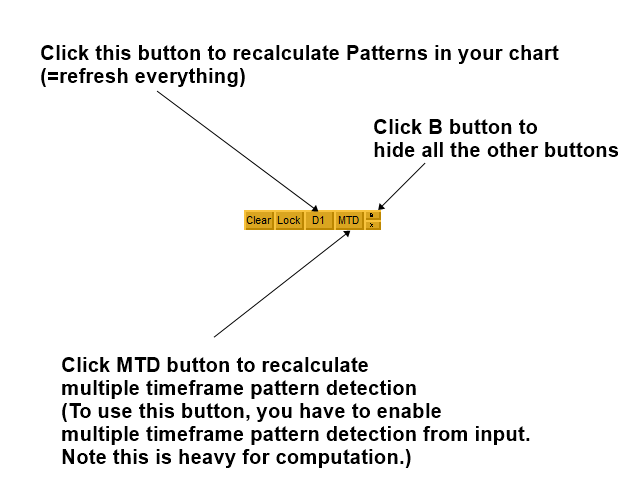
In version 8.6, now you can clear the commands drawn in your chart. The commands line can be cleared when you press "Clear" button. This commands will be shown again, when you click H1 button in the middle of buttons. Just use this to clear your chart if you need to see some details around this area.
Version 8.65 2019.11.23
In version 8.65, we have aligned the Pattern Structure to X3 Pattern Framework. For example, we changed shape ratio (S) to retracement ratio (R) and momentum ratio (M) to expansion ratio (E). Hence, now theory, practice and profit goes together in one framework. Please check below two articles for further explanation about the pattern structure.

https://algotrading-investment.com/2019/07/09/defining-profitable-patterns/

https://algotrading-investment.com/2019/11/20/x3-pattern-framework-for-the-day-trader-in-the-financial-market-2/
Version 8.63 2019.11.15
In version 8.36, we have made some improvement over the graphical objects used in the Pattern Scanner.
Version 8.62 2019.11.01
In Version 8.62, we have upgraded the pattern detection algorithm in Profitable Pattern Scanner. Please enjoy the powerful pattern scanner for your profitable trading.
Version 8.61 2019.10.10
In version 8.61, we have added Advanced Channel indicator to aid your trading decision with profitable patterns.

In default, it is enabled. However, using Channel indicator is not complusory. You can always switch off it by setting

Use Channel = false under Channel Parameter.

At the same time, you can use both regression channels and standard deviation channels according to your preferences.

If you set the width of channel = 0, then it will not draw the channel in your chart.

Enjoy this powerful channel indicator together with our profitable pattern scanner.