
Trading with the MQL5 Economic Calendar (Part 5): Enhancing the Dashboard with Responsive Controls and Filter Buttons
Introduction
In this article, we build upon the previous work in Part 4 of the MetaQuotes Language 5 (MQL5) series where we added real-time updates to the MQL5 Economic Calendar dashboard. Here, our focus is on making the dashboard more interactive by adding buttons that allow us to directly control the currency pair filters, importance levels, and time range filters, all from the panel itself—without needing to change the settings in the code. We will also include a "Cancel" button that clears the selected filters and removes the dashboard components, giving us full control over the display. Finally, we will enhance the user experience by making the buttons responsive to clicks, ensuring that they function smoothly and provide immediate feedback. The topics that we will cover in this article include:
- Creating Filter Buttons and Controls
- Automating and Adding Responsiveness to the Buttons
- Testing the Enhanced Dashboard
- Conclusion
These additions will significantly improve the usability of our dashboard, making it more flexible and dynamic for users to interact with in real time. With these interactive elements, we can easily filter and manage the news data displayed without needing to modify the underlying code each time. Let's begin by creating the filter buttons and integrating them into our existing dashboard layout.
Creating Filter Buttons and Controls
In this section, we will focus on creating the filter buttons that will allow us to control the different aspects of our dashboard, such as the currency pair filter, importance level filter, and time range filter, directly from the panel. By adding these buttons, we will make it easier for us to interact with the dashboard, without needing to access or modify the code each time we want to change a filter setting. The goal is to design an intuitive user interface that provides flexibility while keeping the layout simple and clean.
First, we will define the positions and properties of each of the filter buttons. We will place these buttons within the dashboard panel, allowing us to toggle between different settings for currency pairs, importance levels, and time filters. For example, we will place the currency filter buttons in the top-right corner of the dashboard, the currency, importance, and time filter selection buttons in the header section, and the cancel button right after their definition. Each button will correspond to a specific filter setting, and we can click on these buttons to apply our preferred filters. Here's an image showing the initial layout for the filter buttons within the dashboard:
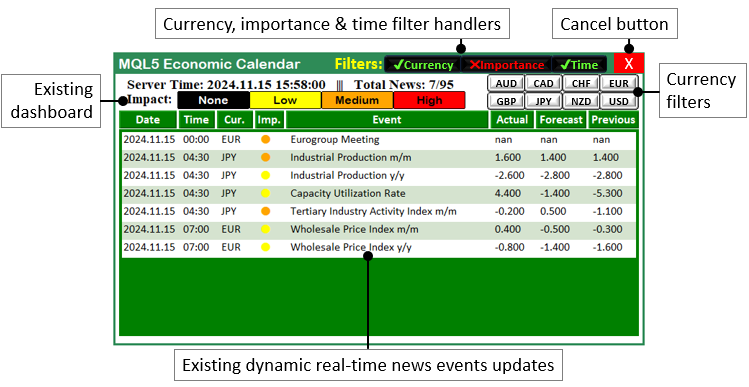
As seen in the image, the filter buttons are organized within the dashboard for easy access and management. Each button is designed to handle a specific function, either to enable available currency pairs, set the importance level of the events, or filter by time. The buttons will also be made visually distinct from one another so that we can easily differentiate between the different control groups.
To implement this, we will need to define constants for the extra objects and controls that we are going to include in the dashboard.
#define FILTER_LABEL "FILTER_LABEL"  //--- Define the label for the filter section on the dashboard

#define FILTER_CURR_BTN "FILTER_CURR_BTN"  //--- Define the button for filtering by currency pair
#define FILTER_IMP_BTN "FILTER_IMP_BTN"  //--- Define the button for filtering by event importance
#define FILTER_TIME_BTN "FILTER_TIME_BTN"  //--- Define the button for filtering by time range

#define CANCEL_BTN "CANCEL_BTN"  //--- Define the cancel button to reset or close the filters

#define CURRENCY_BTNS "CURRENCY_BTNS"  //--- Define the collection of currency buttons for user selection
Here, we define a set of string constants that represent the names of the various dashboard elements we will be adding, primarily buttons and labels, using the #define keyword. We will use these constants to create and manage user interface components such as filter buttons and a cancel button. First, we define "FILTER_LABEL", which represents the label for the filter section on the dashboard.
Next, we define three buttons: "FILTER_CURR_BTN" for filtering by currency pair, "FILTER_IMP_BTN" for filtering by event importance, and "FILTER_TIME_BTN" for filtering by the event's time range. We also define a "CANCEL_BTN" to allow us to reset or close the active filters and delete the dashboard components, and finally, "CURRENCY_BTNS" represents a collection of currency buttons for us to select specific currency pairs. These definitions help us create a dynamic and interactive dashboard where we can control the data displayed directly from the interface. To enhance dynamism, we remove the array of defined currencies outside, in the global scope as follows:
string curr_filter[] = {"AUD","CAD","CHF","EUR","GBP","JPY","NZD","USD"};
string curr_filter_selected[];
Here, we enhance the flexibility and dynamism of the currency filter by removing the predefined list of currencies from within the functions and placing it in a global scope. We now define a new global array "curr_filter" to hold the list of possible currencies, such as "AUD", "CAD", "CHF", "EUR", "GBP", "JPY", "NZD", and "USD". Additionally, we create an empty array "curr_filter_selected", which will store the user-selected currencies dynamically during runtime. Finally, we create a variable that will keep track of the need to do updates since this time round, we won't be needing the updates once we get rid of the dashboard via the cancel button. Easy-peasy.
bool isDashboardUpdate = true;
We just define a boolean variable "isDashboardUpdate" and initialize it to true. We will use the variable to track whether the dashboard needs to be updated. By setting it to true, we can flag that there has been a change or action (such as a filter selection or button click) that requires the dashboard to be refreshed with new data or settings. Likewise, setting it to false will mean that we don't need to carry out the updates process, helping in managing the dashboard’s state efficiently, ensuring it only updates when necessary, and avoiding unnecessary re-renders.
From the global scope, we can go to the initialization section and map our extra filter components to the dashboard. We will start with the topmost buttons, which are the filter enablers.
createLabel(FILTER_LABEL,370,55,"Filters:",clrYellow,16,"Impact"); //--- Create a label for the "Filters" section in the dashboard

//--- Define the text, color, and state for the Currency filter button
string filter_curr_text = enableCurrencyFilter ? ShortToString(0x2714)+"Currency" : ShortToString(0x274C)+"Currency"; //--- Set text based on filter state
color filter_curr_txt_color = enableCurrencyFilter ? clrLime : clrRed; //--- Set text color based on filter state
bool filter_curr_state = enableCurrencyFilter ? true : false; //--- Set button state (enabled/disabled)
createButton(FILTER_CURR_BTN,430,55,110,26,filter_curr_text,filter_curr_txt_color,12,clrBlack); //--- Create Currency filter button
ObjectSetInteger(0,FILTER_CURR_BTN,OBJPROP_STATE,filter_curr_state); //--- Set the state of the Currency button
Here, we are adding a label and a button for the currency filter on the dashboard. First, we use the "createLabel" function to place a label titled "Filters:" on the chart at coordinates (370, and 55), with a yellow color, and a font size of 16. This label will serve as the heading for the filter section, clearly indicating to the user where the filter options are located.
Next, we define and set up the button for the "Currency" filter. We check the state of the "enableCurrencyFilter" variable, and based on its value, we dynamically set the button's text using the "filter_curr_text" variable. If the currency filter is enabled ("enableCurrencyFilter" is true), the button will display a check mark ("0x2714") with the text "Currency", indicating that the filter is active; if it’s disabled, a cross ("0x274C") will be shown instead, signaling that the filter is inactive. We achieve this by use of a ternary operator, which works similarly to the if operator, only that it is small, simple, and straightforward.
To further reflect the filter's state visually, we set the text color of the button using the "filter_curr_txt_color" variable. If the filter is active, the text will appear in green; if inactive, it will appear in red. We also use the "filter_curr_state" boolean variable to control the actual state of the button, which determines whether the button is enabled or disabled.
Then, we create the button itself using the "createButton" function, placing it at (430, 55) on the chart with the appropriate label ("filter_curr_text"), text color ("filter_curr_txt_color"), and a black background. Finally, we use the ObjectSetInteger function to set the state of the button (enabled or disabled) by referencing the "filter_curr_state" variable. This ensures that the button’s appearance and functionality match the current filter settings. Upon compilation, we have the following output.
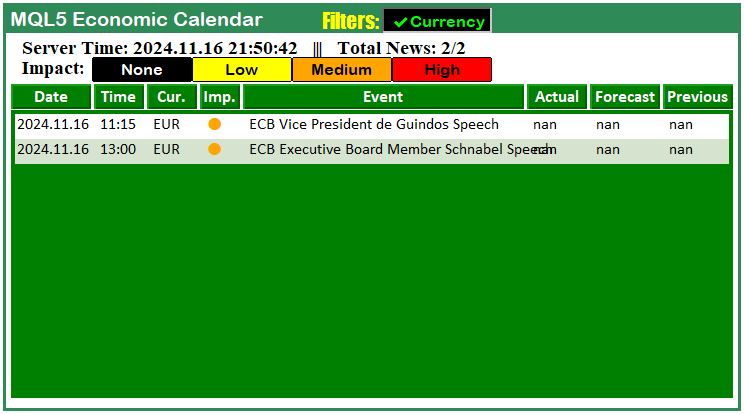
That was a success. We can now proceed to add the filter buttons using the same logic.
//--- Define the text, color, and state for the Importance filter button
string filter_imp_text = enableImportanceFilter ? ShortToString(0x2714)+"Importance" : ShortToString(0x274C)+"Importance"; //--- Set text based on filter state
color filter_imp_txt_color = enableImportanceFilter ? clrLime : clrRed; //--- Set text color based on filter state
bool filter_imp_state = enableImportanceFilter ? true : false; //--- Set button state (enabled/disabled)
createButton(FILTER_IMP_BTN,430+110,55,120,26,filter_imp_text,filter_imp_txt_color,12,clrBlack); //--- Create Importance filter button
ObjectSetInteger(0,FILTER_IMP_BTN,OBJPROP_STATE,filter_imp_state); //--- Set the state of the Importance button

//--- Define the text, color, and state for the Time filter button
string filter_time_text = enableTimeFilter ? ShortToString(0x2714)+"Time" : ShortToString(0x274C)+"Time"; //--- Set text based on filter state
color filter_time_txt_color = enableTimeFilter ? clrLime : clrRed; //--- Set text color based on filter state
bool filter_time_state = enableTimeFilter ? true : false; //--- Set button state (enabled/disabled)
createButton(FILTER_TIME_BTN,430+110+120,55,70,26,filter_time_text,filter_time_txt_color,12,clrBlack); //--- Create Time filter button
ObjectSetInteger(0,FILTER_TIME_BTN,OBJPROP_STATE,filter_time_state); //--- Set the state of the Time button

//--- Create a Cancel button to reset all filters
createButton(CANCEL_BTN,430+110+120+79,51,50,30,"X",clrWhite,17,clrRed,clrNONE); //--- Create the Cancel button with an "X"

//--- Redraw the chart to update the visual elements
ChartRedraw(0); //--- Redraw the chart to reflect all changes made above
Here, we set up the buttons for the "Importance," "Time," and "Cancel" filters on the dashboard. For the "Importance" filter, we first define the button's text with the "filter_imp_text" variable. Based on the value of "enableImportanceFilter", if the filter is active, we display a check mark ("0x2714") alongside the text "Importance", indicating that the filter is enabled; if not, we show a cross ("0x274C") with the same text, indicating the filter is disabled. We also set the button's text color using "filter_imp_txt_color", which is green when enabled and red when disabled. The "filter_imp_state" boolean controls whether the button is enabled or disabled.
Next, we use the "createButton" function to create the "Importance" filter button and place it at the position (430+110, 55) with the appropriate text, color, and state. We then use ObjectSetInteger to set the state of the button ("OBJPROP_STATE") based on "filter_imp_state", ensuring the button reflects the correct status.
We follow a similar process for the "Time" filter button. We define its text in "filter_time_text" and adjust the color with "filter_time_txt_color" based on the value of "enableTimeFilter". The button is created at the position (430+110+120, 55) and the state is set accordingly using "filter_time_state".
Lastly, we create the "Cancel" button using the "createButton" function, which will reset all filters and delete the dashboard when clicked. This button is placed at the position (430+110+120+79, 51), with a white "X" on a red background to indicate its purpose. Finally, we call the ChartRedraw function to refresh the chart and visually update the newly created buttons and changes. Upon run, we get the following outcome.
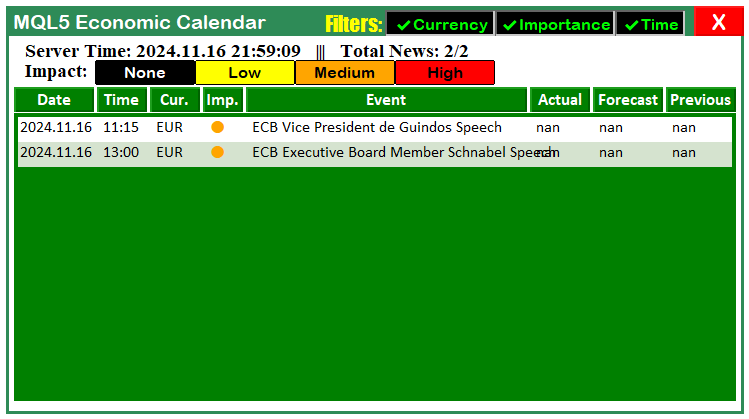
That was a success. We have now added all the filter buttons to the dashboard. However, during the creation of the texts, we used a concatenation of foreign characters called Unicode characters. Let us have a deep look at them.
ShortToString(0x2714);
ShortToString(0x274C);
Here, we use the "ShortToString(0x2714)" and "ShortToString(0x274C)" functions to represent Unicode characters in MQL5, and the "0x2714" and "0x274C" values refer to specific symbols in the Unicode character set.
- "0x2714" is the Unicode code point for the "CHECK MARK" symbol. It is used to indicate something is enabled, completed, or correct. In the context of the filter buttons, we use it to show that a filter (like the Currency or Importance filter) is active or enabled.
- "0x274C" is the Unicode code point for the "CROSS MARK" symbol. It is used to represent something disabled, not done, or incorrect. Here, we use it to show that a filter is inactive or disabled.
You can go ahead to use your characters as well provided you provide characters that are compatible with the MQL5 coding environment. A set of the characters is as below:
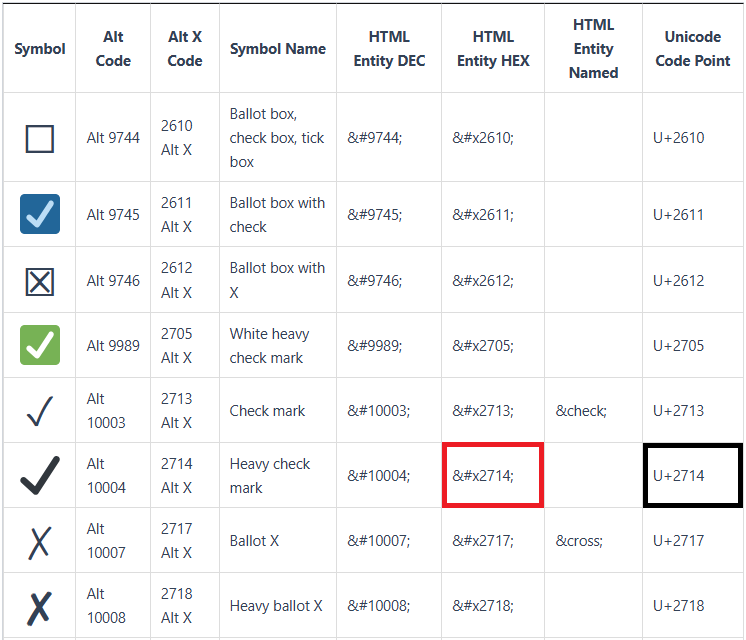
In the code, the ShortToString function converts these Unicode code points into their corresponding character representations. These characters are then appended to the text of the filter buttons to visually show whether a filter is active or not. Next, we can create the currency filter buttons dynamically.
int curr_size = 51;               //--- Button width
int button_height = 22;           //--- Button height
int spacing_x = 0;               //--- Horizontal spacing
int spacing_y = 3;               //--- Vertical spacing
int max_columns = 4;              //--- Number of buttons per row

for (int i = 0; i < ArraySize(curr_filter); i++){
   int row = i / max_columns;                              //--- Determine the row
   int col = i % max_columns;                             //--- Determine the column

   int x_pos = 575 + col * (curr_size + spacing_x);        //--- Calculate X position
   int y_pos = 83 + row * (button_height + spacing_y);    //--- Calculate Y position

   //--- Create button with dynamic positioning
   createButton(CURRENCY_BTNS+IntegerToString(i),x_pos,y_pos,curr_size,button_height,curr_filter[i],clrBlack);
}

if (enableCurrencyFilter == true){
   ArrayFree(curr_filter_selected);
   ArrayCopy(curr_filter_selected,curr_filter);
   Print("CURRENCY FILTER ENABLED");
   ArrayPrint(curr_filter_selected);

   for (int i = 0; i < ArraySize(curr_filter_selected); i++) {
      // Set the button to "clicked" (selected) state by default
      ObjectSetInteger(0, CURRENCY_BTNS + IntegerToString(i), OBJPROP_STATE, true);  // true means clicked
   }
}
Here, we are dynamically creating currency filter buttons and managing their layout and state based on whether the filter is enabled or not. We start by defining button layout parameters. We set the integer variable "curr_size" to 51, which determines the width of each button, and "button_height" is set to 22, determining the button height. "spacing_x" and "spacing_y" are set to 0 and 3 respectively to control the spacing between buttons in the horizontal and vertical directions. We also define "max_columns" as 4, limiting the number of buttons per row to four.
Next, we use for loop to loop through the array "curr_filter", which contains the currency pair codes like "AUD", "CAD", and so on. For each iteration, we calculate the row and column where the button should be placed. We calculate the rows as "i / max_columns" to determine the row number, and columns as "i % max_columns" to determine the column within the row. Using these values, we calculate the X ("x_pos") and Y ("y_pos") positions of the buttons on the screen. Then, we call the function "createButton" to dynamically create each button with its label set to the corresponding currency from the "curr_filter" array and the color set to black.
After creating the buttons, we check if the filter is enabled by evaluating the value of "enableCurrencyFilter". If the filter is enabled, we clear the selected currencies array using the ArrayFree function and copy the content of "curr_filter" into "curr_filter_selected" using the ArrayCopy function. This effectively copies all currencies into the selected array. We then print "CURRENCY FILTER ENABLED" and display the selected filter array using the ArrayPrint function. Finally, we loop through the selected currencies in the "curr_filter_selected" array and set each corresponding button's state to selected using the ObjectSetInteger function by posing the respective parameters. We use the IntegerToString function to concatenate the index of the selection and append it to the macro "CURRENCY_BTNS", and set the state to true, which visually marks the button as clicked.
Upon compilation, we get the following outcomes.
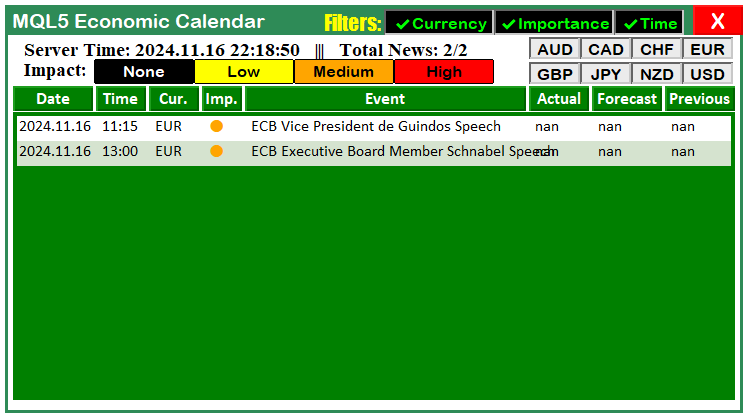
From the image, we can see that we have successfully added the filter buttons to the dashboard. What we need to do next from here now is update the function that is responsible for destroying the dashboard so that it also considers the newly added components.
//+------------------------------------------------------------------+
//|      Function to destroy the Dashboard panel                     |
//+------------------------------------------------------------------+

void destroy_Dashboard(){

   //--- Delete the main rectangle that defines the dashboard background
   ObjectDelete(0,"MAIN_REC");

   //--- Delete the sub-rectangles that separate sections in the dashboard
   ObjectDelete(0,"SUB_REC1");
   ObjectDelete(0,"SUB_REC2");

   //--- Delete the header label that displays the title of the dashboard
   ObjectDelete(0,"HEADER_LABEL");

   //--- Delete the time and impact labels from the dashboard
   ObjectDelete(0,"TIME_LABEL");
   ObjectDelete(0,"IMPACT_LABEL");

   //--- Delete all calendar-related objects
   ObjectsDeleteAll(0,"ARRAY_CALENDAR");

   //--- Delete all news-related objects
   ObjectsDeleteAll(0,"ARRAY_NEWS");

   //--- Delete all data holder objects (for storing data within the dashboard)
   ObjectsDeleteAll(0,"DATA_HOLDERS");

   //--- Delete the impact label objects (impact-related elements in the dashboard)
   ObjectsDeleteAll(0,"IMPACT_LABEL");

   //--- Delete the filter label that identifies the filter section
   ObjectDelete(0,"FILTER_LABEL");

   //--- Delete the filter buttons for Currency, Importance, and Time
   ObjectDelete(0,"FILTER_CURR_BTN");
   ObjectDelete(0,"FILTER_IMP_BTN");
   ObjectDelete(0,"FILTER_TIME_BTN");

   //--- Delete the cancel button that resets or closes the filters
   ObjectDelete(0,"CANCEL_BTN");

   //--- Delete all currency filter buttons dynamically created
   ObjectsDeleteAll(0,"CURRENCY_BTNS");

   //--- Redraw the chart to reflect the removal of all dashboard components
   ChartRedraw(0);

}
We also need to update the OnTick event handler logic to only run the updates as long as the updates flag is true. We achieve that via the following logic.
//+------------------------------------------------------------------+
//| Expert tick function                                             |
//+------------------------------------------------------------------+
void OnTick(){
//---

   if (isDashboardUpdate){
      update_dashboard_values(curr_filter_selected);
   }
}
Here, we are checking if the condition "isDashboardUpdate" is true, which indicates that the dashboard should be updated with the latest data. If this condition is met, we call the function "update_dashboard_values" to update the values displayed on the dashboard using the selected currency filters stored in the "curr_filter_selected" array.
The array "curr_filter_selected" contains the currencies that have been chosen for filtering, and by passing it to the "update_dashboard_values" function, we ensure that the dashboard reflects the most current filter selections. If the variable flag is false, no updates will be considered. That is all that we need to consider to create the filter buttons. Now we just need to go ahead and add responsiveness to the buttons created, and that will be handled in the next section.
Automating and Adding Responsiveness to the Buttons
To add responsiveness to the dashboard, we will need to include an event listener that will track the clicks and take action based on them. For this, we will use the in-built OnChartEvent event handler in MQL5.
//+------------------------------------------------------------------+
//|    OnChartEvent handler function                                 |
//+------------------------------------------------------------------+
void  OnChartEvent(
   const int       id,       // event ID
   const long&     lparam,   // long type event parameter
   const double&   dparam,   // double type event parameter
   const string&   sparam    // string type event parameter
){

//---

}
This is the function that is responsible for recognizing chart activities such as changes, clicks, object creations, and many more. However, we are only interested in the chart clicks since we want to listen to the button clicks only. We will start with the simplest to the most complex. The cancel button is the simplest.
if (id == CHARTEVENT_OBJECT_CLICK){ //--- Check if the event is a click on an object

   if (sparam == CANCEL_BTN){ //--- If the Cancel button is clicked
      isDashboardUpdate = false; //--- Set dashboard update flag to false
      destroy_Dashboard(); //--- Call the function to destroy the dashboard
   }
}
Here, we handle the scenario when the event detected is a click on an object, detected when the ID of the event is CHARTEVENT_OBJECT_CLICK. If the event is a click, we check if the object clicked is the "CANCEL_BTN" by evaluating if the string parameter "sparam" is "CANCEL_BTN". If this condition is met, it signifies that the Cancel button on the dashboard has been clicked. In response, we set the global flag "isDashboardUpdate" to false, effectively disabling further updates to the dashboard. Next, we call the "destroy_Dashboard" function to remove all graphical elements associated with the dashboard from the chart, thereby clearing it. This ensures the interface is reset and cleared when the Cancel button is clicked. Here is its illustration.
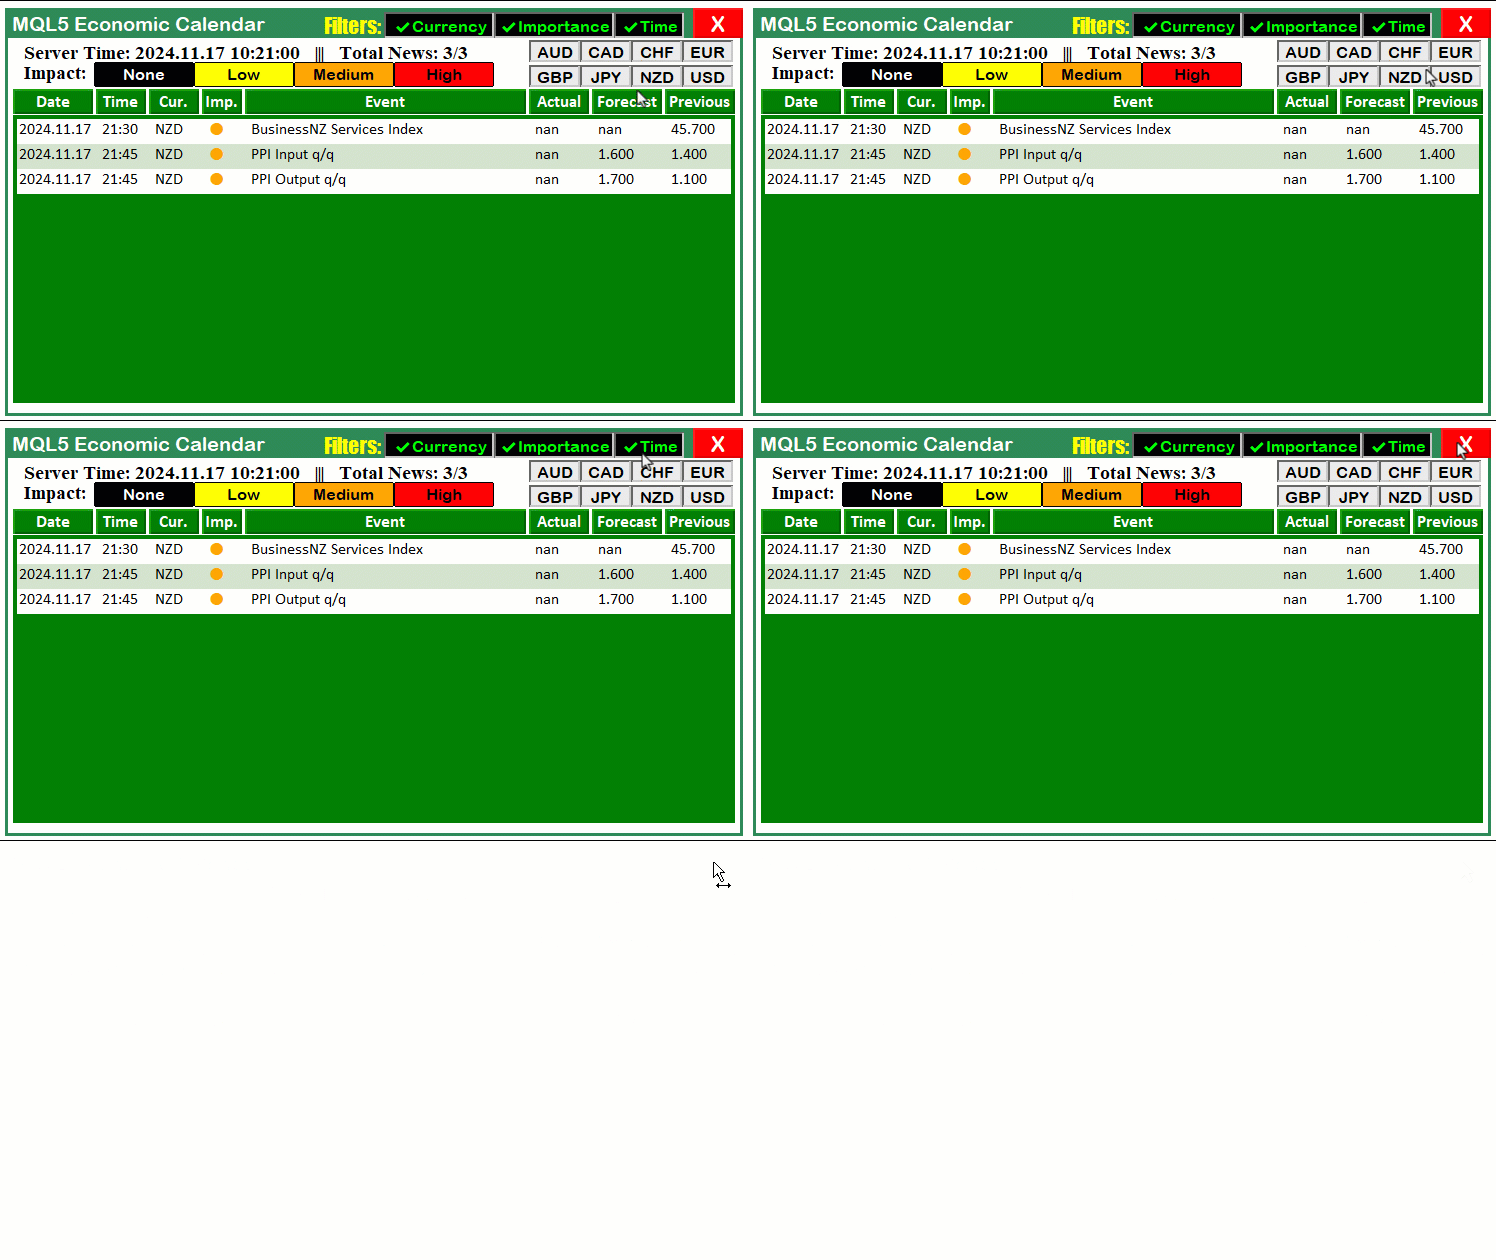
That was a success. We can now apply the same logic to automate the other buttons. We will automate the currency filter button now. We use the following logic in a code snippet to achieve that.
if (sparam == FILTER_CURR_BTN){ //--- If the Currency filter button is clicked
   bool btn_state = ObjectGetInteger(0,sparam,OBJPROP_STATE); //--- Get the button state (clicked/unclicked)
   enableCurrencyFilter = btn_state; //--- Update the Currency filter flag
   Print(sparam+" STATE = "+(string)btn_state+", FLAG = "+(string)enableCurrencyFilter); //--- Log the state
   string filter_curr_text = enableCurrencyFilter ? ShortToString(0x2714)+"Currency" : ShortToString(0x274C)+"Currency"; //--- Set button text based on state
   color filter_curr_txt_color = enableCurrencyFilter ? clrLime : clrRed; //--- Set button text color based on state
   ObjectSetString(0,FILTER_CURR_BTN,OBJPROP_TEXT,filter_curr_text); //--- Update the button text
   ObjectSetInteger(0,FILTER_CURR_BTN,OBJPROP_COLOR,filter_curr_txt_color); //--- Update the button text color
   Print("Success. Changes updated! State: "+(string)enableCurrencyFilter); //--- Log success
   ChartRedraw(0); //--- Redraw the chart to reflect changes
}
Here, we handle the behavior when the "FILTER_CURR_BTN" (Currency filter button) is clicked. When this condition is met, we retrieve the button's current state (clicked or unclicked) using the ObjectGetInteger function with the property OBJPROP_STATE, and store it in the "btn_state" variable. We then update the "enableCurrencyFilter" flag with the value of "btn_state" to reflect whether the Currency filter is active.
Next, we log the button's state and the updated flag value to provide feedback using the Print function. Based on the state of the Currency filter, we dynamically set the button text using a checkmark or cross with the ShortToString function and update its color to green for active or red for inactive. These updates are applied to the button using ObjectSetString for the text and ObjectSetInteger for the color property.
Finally, we log a success message to confirm that the changes have been applied and call the ChartRedraw function to update the chart, ensuring that the visual changes to the button are displayed immediately. This interaction allows us to toggle the Currency filter dynamically and reflect the changes on the dashboard. The same process applies to the other filter buttons.
if (sparam == FILTER_IMP_BTN){ //--- If the Importance filter button is clicked
   bool btn_state = ObjectGetInteger(0,sparam,OBJPROP_STATE); //--- Get the button state
   enableImportanceFilter = btn_state; //--- Update the Importance filter flag
   Print(sparam+" STATE = "+(string)btn_state+", FLAG = "+(string)enableImportanceFilter); //--- Log the state
   string filter_imp_text = enableImportanceFilter ? ShortToString(0x2714)+"Importance" : ShortToString(0x274C)+"Importance"; //--- Set button text
   color filter_imp_txt_color = enableImportanceFilter ? clrLime : clrRed; //--- Set button text color
   ObjectSetString(0,FILTER_IMP_BTN,OBJPROP_TEXT,filter_imp_text); //--- Update the button text
   ObjectSetInteger(0,FILTER_IMP_BTN,OBJPROP_COLOR,filter_imp_txt_color); //--- Update the button text color
   Print("Success. Changes updated! State: "+(string)enableImportanceFilter); //--- Log success
   ChartRedraw(0); //--- Redraw the chart
}
if (sparam == FILTER_TIME_BTN){ //--- If the Time filter button is clicked
   bool btn_state = ObjectGetInteger(0,sparam,OBJPROP_STATE); //--- Get the button state
   enableTimeFilter = btn_state; //--- Update the Time filter flag
   Print(sparam+" STATE = "+(string)btn_state+", FLAG = "+(string)enableTimeFilter); //--- Log the state
   string filter_time_text = enableTimeFilter ? ShortToString(0x2714)+"Time" : ShortToString(0x274C)+"Time"; //--- Set button text
   color filter_time_txt_color = enableTimeFilter ? clrLime : clrRed; //--- Set button text color
   ObjectSetString(0,FILTER_TIME_BTN,OBJPROP_TEXT,filter_time_text); //--- Update the button text
   ObjectSetInteger(0,FILTER_TIME_BTN,OBJPROP_COLOR,filter_time_txt_color); //--- Update the button text color
   Print("Success. Changes updated! State: "+(string)enableTimeFilter); //--- Log success
   ChartRedraw(0); //--- Redraw the chart
}
Here, we define the behavior for handling clicks on the "FILTER_IMP_BTN" (Importance filter button) and the "FILTER_TIME_BTN" (Time filter button), enabling dynamic toggling of these filters. For the "FILTER_IMP_BTN," when clicked, we first retrieve its current state using ObjectGetInteger with the property OBJPROP_STATE and store it in the "btn_state" variable. We then update the "enableImportanceFilter" flag to reflect whether the Importance filter is active. Using the Print function, we log the button state and the flag's updated value. Depending on the state, we set the button text to a checkmark or cross via the ShortToString function and update its color to green for active or red for inactive. These changes are applied using ObjectSetString for the text and ObjectSetInteger for the color property functions. Finally, we log a success message and call the ChartRedraw function to ensure the updates are visually applied.
Similarly, for the "FILTER_TIME_BTN," we follow the same process. We retrieve the button's state using the ObjectGetInteger function and update the "enableTimeFilter" flag accordingly. We log the state and flag updates for feedback. The button text and color are dynamically updated to reflect the state (active/inactive), using ShortToString, ObjectSetString, and ObjectSetInteger functions respectively. After confirming the updates with a log, we redraw the chart with the ChartRedraw function. This process ensures real-time responsiveness for the filter buttons, providing us with a seamless experience in toggling their functionality. Here is a visual outcome.
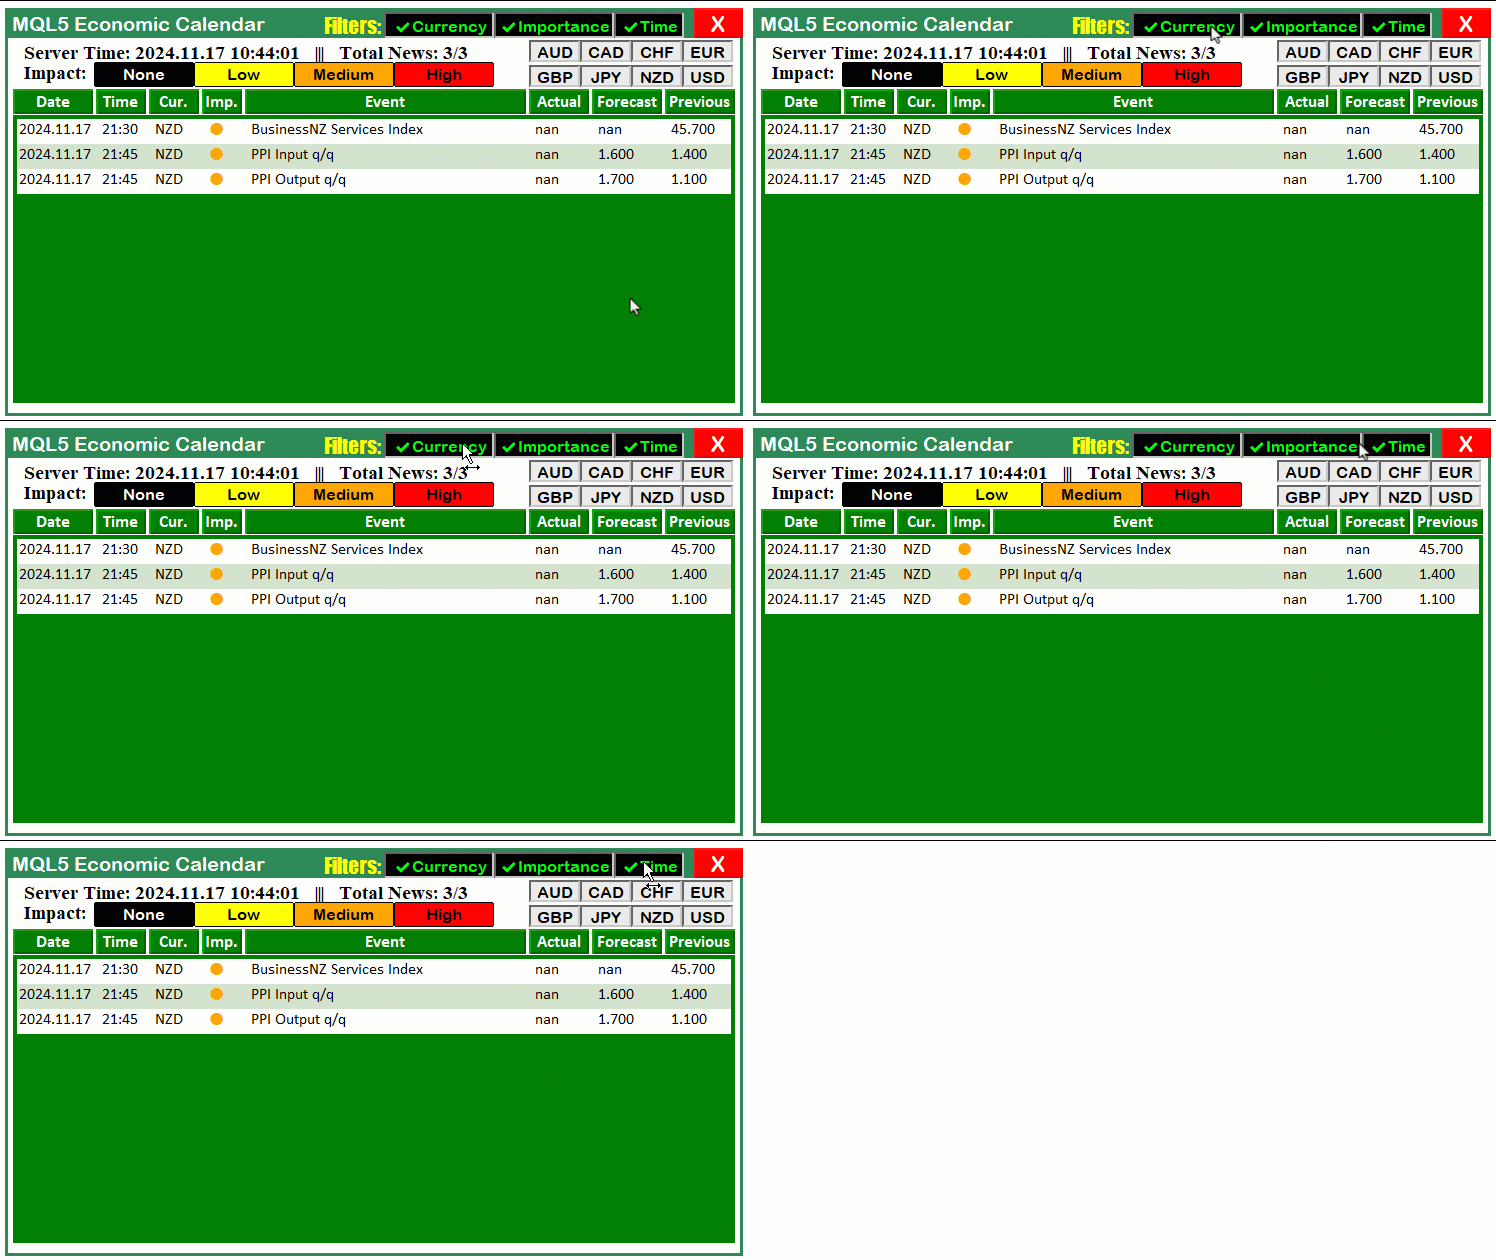
That was a success. We can now proceed to automate the currency buttons as well.
if (StringFind(sparam,CURRENCY_BTNS) >= 0){ //--- If a Currency button is clicked
   string selected_curr = ObjectGetString(0,sparam,OBJPROP_TEXT); //--- Get the text of the clicked button
   Print("BTN NAME = ",sparam,", CURRENCY = ",selected_curr); //--- Log the button name and currency

   bool btn_state = ObjectGetInteger(0,sparam,OBJPROP_STATE); //--- Get the button state

   if (btn_state == false){ //--- If the button is unselected
      Print("BUTTON IS IN UN-SELECTED MODE.");
      //--- Loop to find and remove the currency from the array
      for (int i = 0; i < ArraySize(curr_filter_selected); i++) {
         if (curr_filter_selected[i] == selected_curr) {
            //--- Shift elements to remove the selected currency
            for (int j = i; j < ArraySize(curr_filter_selected) - 1; j++) {
               curr_filter_selected[j] = curr_filter_selected[j + 1];
            }
            ArrayResize(curr_filter_selected, ArraySize(curr_filter_selected) - 1); //--- Resize the array
            Print("Removed from selected filters: ", selected_curr); //--- Log removal
            break;
         }
      }
   }
   else if (btn_state == true){ //--- If the button is selected
      Print("BUTTON IS IN SELECTED MODE. TAKE ACTION");
      //--- Check for duplicates
      bool already_selected = false;
      for (int j = 0; j < ArraySize(curr_filter_selected); j++) {
         if (curr_filter_selected[j] == selected_curr) {
            already_selected = true;
            break;
         }
      }

      //--- If not already selected, add to the array
      if (!already_selected) {
         ArrayResize(curr_filter_selected, ArraySize(curr_filter_selected) + 1); //--- Resize array
         curr_filter_selected[ArraySize(curr_filter_selected) - 1] = selected_curr; //--- Add the new currency
         Print("Added to selected filters: ", selected_curr); //--- Log addition
      }
      else {
         Print("Currency already selected: ", selected_curr); //--- Log already selected
      }

   }
   Print("SELECTED ARRAY SIZE = ",ArraySize(curr_filter_selected)); //--- Log the size of the selected array
   ArrayPrint(curr_filter_selected); //--- Print the selected array

   update_dashboard_values(curr_filter_selected); //--- Update the dashboard with the selected filters
   Print("SUCCESS. DASHBOARD UPDATED"); //--- Log success

   ChartRedraw(0); //--- Redraw the chart to reflect changes
}
Here, we handle clicks on currency filter buttons to dynamically manage the selected currencies and update the dashboard accordingly. When a button is clicked, we first determine if it belongs to the "CURRENCY_BTNS" group using the StringFind function. If true, we retrieve the text label of the button using the ObjectGetString function with the "OBJPROP_TEXT" property to identify the currency it represents. Next, we check the button's state using ObjectGetInteger with the "OBJPROP_STATE" property to determine whether the button is selected (true) or unselected (false).
If the button is in an unselected state, we remove the corresponding currency from the "curr_filter_selected" array. To achieve this, we loop through the array to locate the matching currency, shift all subsequent elements to the left to overwrite it, and then resize the array using the ArrayResize function to remove the last position. Each removal is logged to confirm the action. Conversely, if the button is in a selected state, we check for duplicates to prevent adding the same currency multiple times. If the currency is not already in the array, we resize the array using the "ArrayResize" function, append the new currency to the last position, and log the addition. If the currency is already selected, a message is logged to indicate no further action is needed.
After updating the "curr_filter_selected" array, we log its size and contents using the ArrayPrint function for visibility. We then call the "update_dashboard_values" function to refresh the dashboard with the newly selected filters. To ensure all changes are visually reflected, we conclude by calling the ChartRedraw function and updating the chart interface in real-time.
Since we now have varying currency filters after user interaction, we need to update the function responsible for the updates with the latest user-selected currencies.
//+------------------------------------------------------------------+
//| Function to update dashboard values                              |
//+------------------------------------------------------------------+
void update_dashboard_values(string &curr_filter_array[]){

//---

      //--- Check if the event’s currency matches any in the filter array (if the filter is enabled)
      bool currencyMatch = false;
      if (enableCurrencyFilter) {
         for (int j = 0; j < ArraySize(curr_filter_array); j++) {
            if (country.currency == curr_filter_array[j]) {
               currencyMatch = true;
               break;
            }
         }

         //--- If no match found, skip to the next event
         if (!currencyMatch) {
            continue;
         }
      }

//---

}
Here, we update the "update_dashboard_values" function by introducing a crucial improvement by utilizing the "curr_filter_array" parameter, passed by reference using the "&" symbol. This design allows us to directly manipulate and work with the selected currencies filter array, ensuring the dashboard remains synchronized with user preferences.
Here's what we mean by "Passing by Reference (&)". The "curr_filter_array" parameter is passed by reference to the function. This means the function accesses the actual array in memory rather than a copy. Changes to the array within the function (if any) directly affect the original array outside the function. This approach improves efficiency, especially for larger arrays, and maintains consistency with the user's current filter selections. Later on, instead of using the initial array, we substitute it with the latest one as passed by reference containing user preferences. We have highlighted the changes in yellow for clarity. On compilation, we get the following outcome.
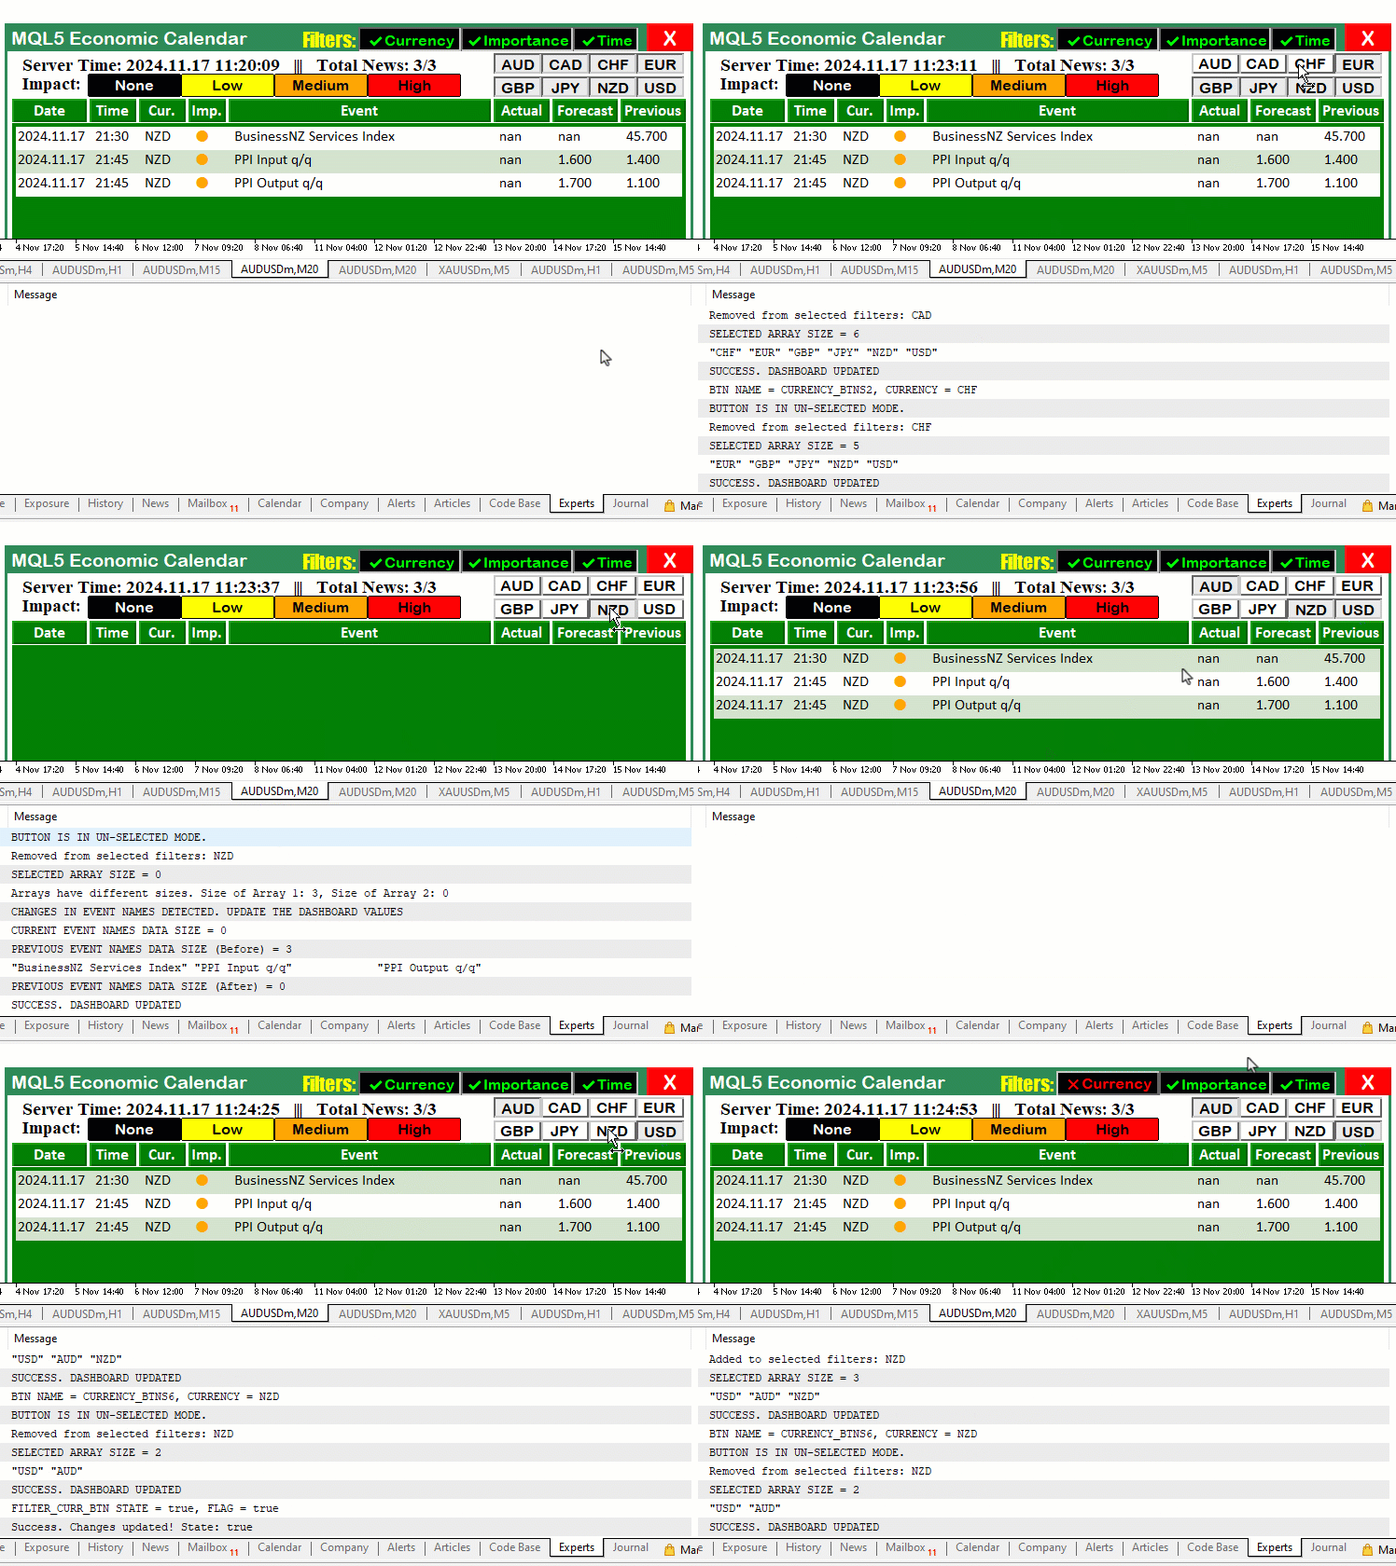
From the visualization, we can see that the dashboard is updated on every instance we click on any of the currency buttons, which is a success. However, currently, there is a dependency of the currency filter button on the currencies, in that after we click on the single currency filter, the dashboard is not updated. To resolve this, we just have to call the update function on every filter button, as below.
if (sparam == FILTER_CURR_BTN){ //--- If the Currency filter button is clicked
   bool btn_state = ObjectGetInteger(0,sparam,OBJPROP_STATE); //--- Get the button state (clicked/unclicked)
   enableCurrencyFilter = btn_state; //--- Update the Currency filter flag
   Print(sparam+" STATE = "+(string)btn_state+", FLAG = "+(string)enableCurrencyFilter); //--- Log the state
   string filter_curr_text = enableCurrencyFilter ? ShortToString(0x2714)+"Currency" : ShortToString(0x274C)+"Currency"; //--- Set button text based on state
   color filter_curr_txt_color = enableCurrencyFilter ? clrLime : clrRed; //--- Set button text color based on state
   ObjectSetString(0,FILTER_CURR_BTN,OBJPROP_TEXT,filter_curr_text); //--- Update the button text
   ObjectSetInteger(0,FILTER_CURR_BTN,OBJPROP_COLOR,filter_curr_txt_color); //--- Update the button text color
   update_dashboard_values(curr_filter_selected);
   Print("Success. Changes updated! State: "+(string)enableCurrencyFilter); //--- Log success
   ChartRedraw(0); //--- Redraw the chart to reflect changes
}
if (sparam == FILTER_IMP_BTN){ //--- If the Importance filter button is clicked
   bool btn_state = ObjectGetInteger(0,sparam,OBJPROP_STATE); //--- Get the button state
   enableImportanceFilter = btn_state; //--- Update the Importance filter flag
   Print(sparam+" STATE = "+(string)btn_state+", FLAG = "+(string)enableImportanceFilter); //--- Log the state
   string filter_imp_text = enableImportanceFilter ? ShortToString(0x2714)+"Importance" : ShortToString(0x274C)+"Importance"; //--- Set button text
   color filter_imp_txt_color = enableImportanceFilter ? clrLime : clrRed; //--- Set button text color
   ObjectSetString(0,FILTER_IMP_BTN,OBJPROP_TEXT,filter_imp_text); //--- Update the button text
   ObjectSetInteger(0,FILTER_IMP_BTN,OBJPROP_COLOR,filter_imp_txt_color); //--- Update the button text color
   update_dashboard_values(curr_filter_selected);
   Print("Success. Changes updated! State: "+(string)enableImportanceFilter); //--- Log success
   ChartRedraw(0); //--- Redraw the chart
}
if (sparam == FILTER_TIME_BTN){ //--- If the Time filter button is clicked
   bool btn_state = ObjectGetInteger(0,sparam,OBJPROP_STATE); //--- Get the button state
   enableTimeFilter = btn_state; //--- Update the Time filter flag
   Print(sparam+" STATE = "+(string)btn_state+", FLAG = "+(string)enableTimeFilter); //--- Log the state
   string filter_time_text = enableTimeFilter ? ShortToString(0x2714)+"Time" : ShortToString(0x274C)+"Time"; //--- Set button text
   color filter_time_txt_color = enableTimeFilter ? clrLime : clrRed; //--- Set button text color
   ObjectSetString(0,FILTER_TIME_BTN,OBJPROP_TEXT,filter_time_text); //--- Update the button text
   ObjectSetInteger(0,FILTER_TIME_BTN,OBJPROP_COLOR,filter_time_txt_color); //--- Update the button text color
   update_dashboard_values(curr_filter_selected);
   Print("Success. Changes updated! State: "+(string)enableTimeFilter); //--- Log success
   ChartRedraw(0); //--- Redraw the chart
}
Here, we just make sure to call the updates function to enhance the independence of the dashboard events. We have highlighted the changes in yellow color for clarity. Thus, with these changes, the buttons employ independency. Here is a quick visualization.
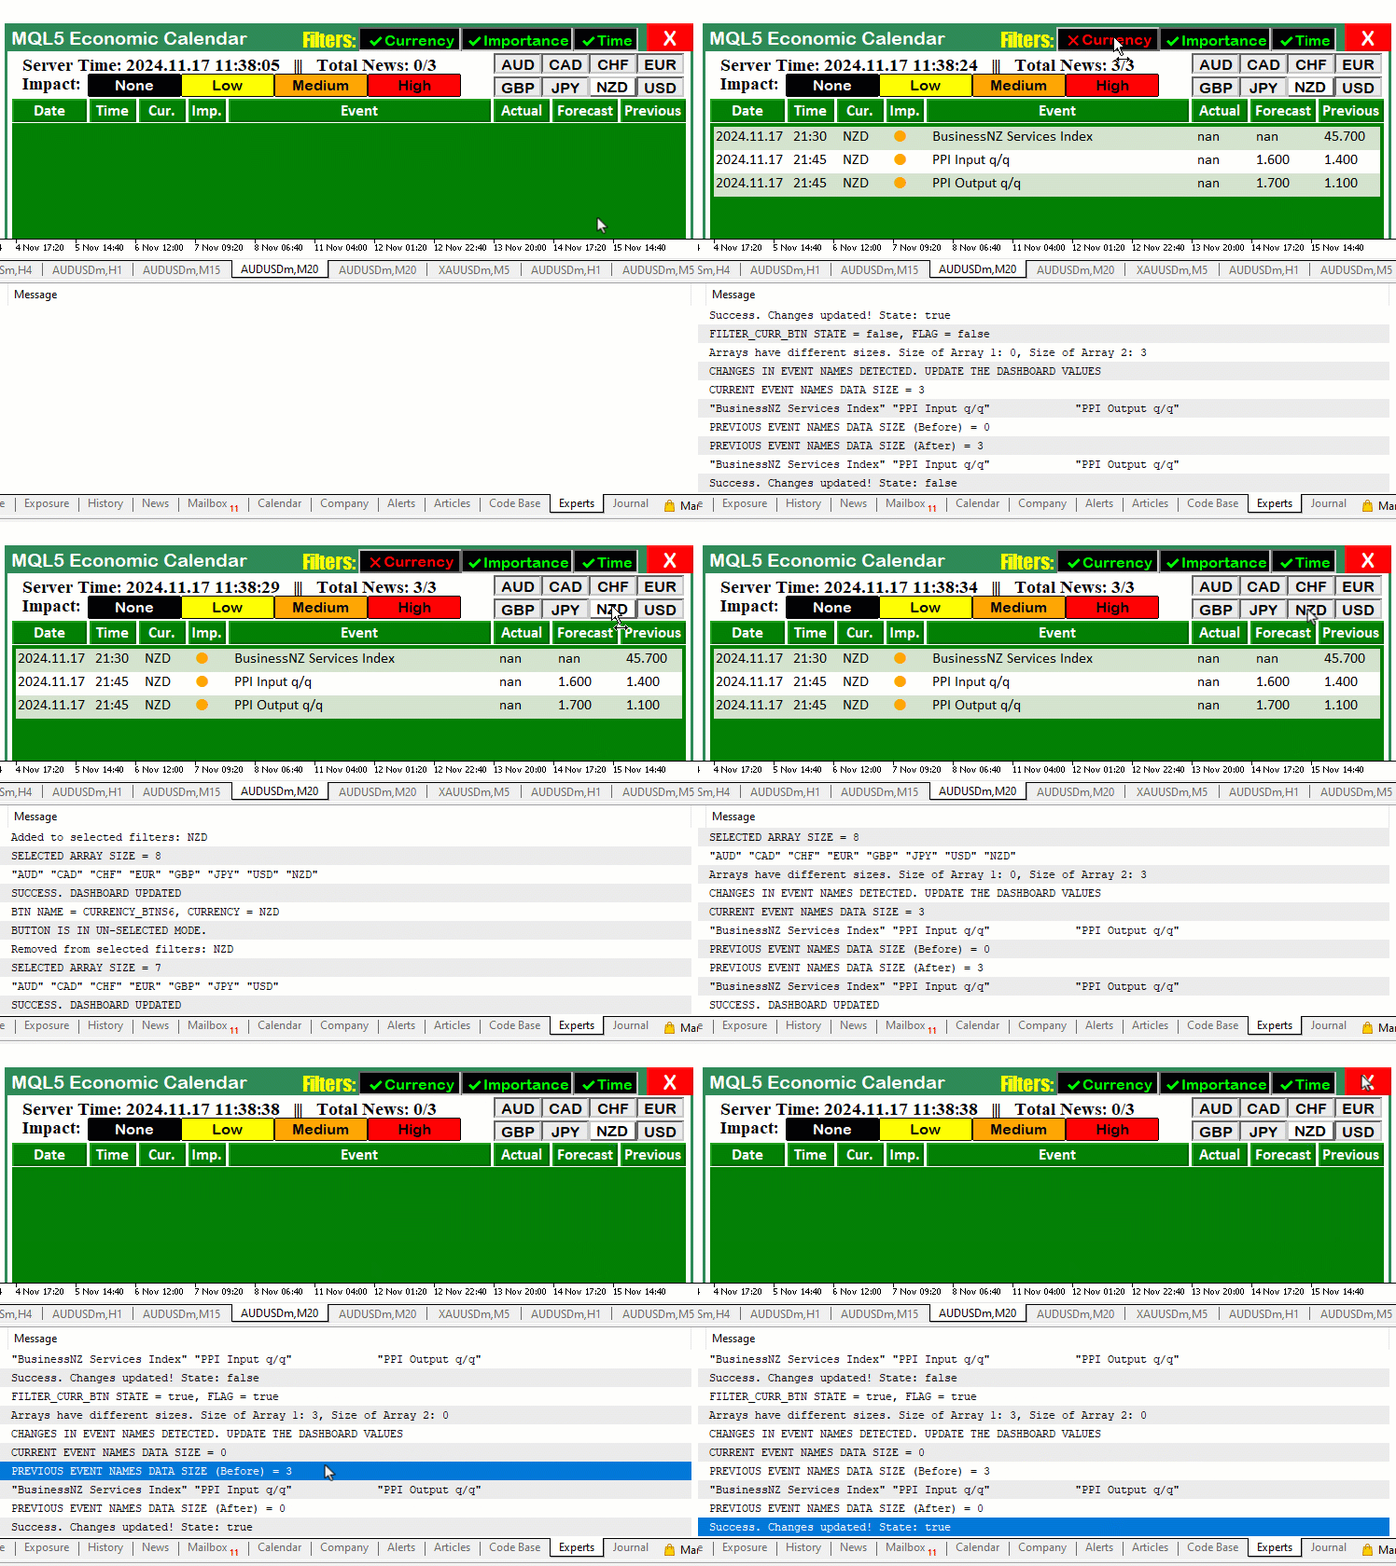
Up to this point, we have managed to integrate the currency filters. Using the same procedure, we can go ahead and integrate the importance filters as well. This will be a bit complex since we will deal with the existing buttons to add the filter effect and will require we have 2 arrays for the importance levels, a main one and a side string one which we will use to do the comparisons. We will first bring all the importance arrays to the global scope so we can access them anywhere in the code.
//--- Define labels for impact levels and size of impact display areas
string impact_labels[] = {"None","Low","Medium","High"};
string impact_filter_selected[];

// Define the levels of importance to filter (low, moderate, high)
ENUM_CALENDAR_EVENT_IMPORTANCE allowed_importance_levels[] = {CALENDAR_IMPORTANCE_NONE,CALENDAR_IMPORTANCE_LOW, CALENDAR_IMPORTANCE_MODERATE, CALENDAR_IMPORTANCE_HIGH};
ENUM_CALENDAR_EVENT_IMPORTANCE imp_filter_selected[];
Here, we define the string array "impact_labels" that holds the different impact levels available for selection by the user. The labels are "None", "Low", "Medium", and "High". We used this array to present these options to the user for filtering calendar events based on their perceived impact.
We then introduce the array "impact_filter_selected", which will store the actual labels that the user selects from the "impact_labels" array. Whenever the user interacts with the interface and chooses an impact level, we add the corresponding label to this array. It is in string format so that we can easily interpret the respective levels selected, other than from the enumeration list. This allows us to track the user's filter preferences dynamically.
Next, we define the array "allowed_importance_levels", which contains the enumerated values of type ENUM_CALENDAR_EVENT_IMPORTANCE. These enumerated values are associated with the levels of impact: "CALENDAR_IMPORTANCE_NONE", "CALENDAR_IMPORTANCE_LOW", "CALENDAR_IMPORTANCE_MODERATE", and "CALENDAR_IMPORTANCE_HIGH". We had already defined them, we just shifted them to the global scope. These values will be used to filter calendar events based on their importance.
We also define the array "imp_filter_selected", where we store the importance levels corresponding to the user’s selected impact labels. As the user selects labels from "impact_labels", we match each label with its corresponding importance level from "allowed_importance_levels" and store the result in "imp_filter_selected". This array will then be used to filter calendar events, ensuring that only events with the selected importance levels are displayed.
Now graduating to the initialization function, we will update the buttons for some clarity because we are now using them not for just guidance on event results but also for the filtering process. Thus, we want to show their active or inactive state when they are clicked.
if (enableImportanceFilter == true) {
   ArrayFree(imp_filter_selected); //--- Clear the existing selections in the importance filter array
   ArrayCopy(imp_filter_selected, allowed_importance_levels); //--- Copy all allowed importance levels as default selections
   ArrayFree(impact_filter_selected);
   ArrayCopy(impact_filter_selected, impact_labels);
   Print("IMPORTANCE FILTER ENABLED"); //--- Log that importance filter is enabled
   ArrayPrint(imp_filter_selected); //--- Print the current selection of importance levels
   ArrayPrint(impact_filter_selected);

   // Loop through the importance levels and set their buttons to "selected" state
   for (int i = 0; i < ArraySize(imp_filter_selected); i++) {
      string btn_name = IMPACT_LABEL+IntegerToString(i); //--- Dynamically name the button for each importance level
      ObjectSetInteger(0, btn_name, OBJPROP_STATE, true); //--- Set the button state to "clicked" (selected)
      ObjectSetInteger(0, btn_name, OBJPROP_BORDER_COLOR, clrNONE); //--- Set the button state to "clicked" (selected)
   }
}
Here, we first check if the "enableImportanceFilter" variable is set to true. If it is, we proceed to configure the importance filter system. We begin by clearing the existing selections in the "imp_filter_selected" array using the ArrayFree function. Then, we copy all the values from the "allowed_importance_levels" array into "imp_filter_selected", essentially setting all the importance levels as the default selections. This means that, by default, all importance levels are initially selected for filtering.
We then clear the "impact_filter_selected" array with the ArrayFree function, which ensures any previous selections in the impact labels array are removed. We follow this by copying all the values from the "impact_labels" array into "impact_filter_selected". This makes sure that the labels representing the impact levels (like "None", "Low", "Medium", and "High") are available for the filter. After setting up the arrays, we print a log message, "IMPORTANCE FILTER ENABLED", to confirm that the importance filter is now active. We also print the contents of the "imp_filter_selected" and "impact_filter_selected" arrays to display the current selections.
Finally, we loop through the "imp_filter_selected" array, which holds the importance levels that are currently selected, and dynamically set the button states for each corresponding importance level. For each importance level, we create a button name dynamically using "IMPACT_LABEL" and the index of the current importance level using the IntegerToString function. We then set the button state to "true" (selected) using the ObjectSetInteger function. Additionally, we remove any border color by setting the OBJPROP_BORDER_COLOR property to none to visually highlight that the button is selected. That is all that we need for the initialization. We now graduate to the event listener function, where we track the Importance button clicks and act accordingly. Here, we use a similar logic as we did with the currency filter buttons.
if (StringFind(sparam, IMPACT_LABEL) >= 0) { //--- If an Importance button is clicked
   string selected_imp = ObjectGetString(0, sparam, OBJPROP_TEXT); //--- Get the importance level of the clicked button
   ENUM_CALENDAR_EVENT_IMPORTANCE selected_importance_lvl = get_importance_level(impact_labels,allowed_importance_levels,selected_imp);
   Print("BTN NAME = ", sparam, ", IMPORTANCE LEVEL = ", selected_imp,"(",selected_importance_lvl,")"); //--- Log the button name and importance level

   bool btn_state = ObjectGetInteger(0, sparam, OBJPROP_STATE); //--- Get the button state

   color color_border = btn_state ? clrNONE : clrBlack;

   if (btn_state == false) { //--- If the button is unselected
      Print("BUTTON IS IN UN-SELECTED MODE.");
      //--- Loop to find and remove the importance level from the array
      for (int i = 0; i < ArraySize(imp_filter_selected); i++) {
         if (impact_filter_selected[i] == selected_imp) {
            //--- Shift elements to remove the unselected importance level
            for (int j = i; j < ArraySize(imp_filter_selected) - 1; j++) {
               imp_filter_selected[j] = imp_filter_selected[j + 1];
               impact_filter_selected[j] = impact_filter_selected[j + 1];
            }
            ArrayResize(imp_filter_selected, ArraySize(imp_filter_selected) - 1); //--- Resize the array
            ArrayResize(impact_filter_selected, ArraySize(impact_filter_selected) - 1); //--- Resize the array
            Print("Removed from selected importance filters: ", selected_imp,"(",selected_importance_lvl,")"); //--- Log removal
            break;
         }
      }
   }
   else if (btn_state == true) { //--- If the button is selected
      Print("BUTTON IS IN SELECTED MODE. TAKE ACTION");
      //--- Check for duplicates
      bool already_selected = false;
      for (int j = 0; j < ArraySize(imp_filter_selected); j++) {
         if (impact_filter_selected[j] == selected_imp) {
            already_selected = true;
            break;
         }
      }

      //--- If not already selected, add to the array
      if (!already_selected) {
         ArrayResize(imp_filter_selected, ArraySize(imp_filter_selected) + 1); //--- Resize the array
         imp_filter_selected[ArraySize(imp_filter_selected) - 1] = selected_importance_lvl; //--- Add the new importance level

         ArrayResize(impact_filter_selected, ArraySize(impact_filter_selected) + 1); //--- Resize the array
         impact_filter_selected[ArraySize(impact_filter_selected) - 1] = selected_imp; //--- Add the new importance level
         Print("Added to selected importance filters: ", selected_imp,"(",selected_importance_lvl,")"); //--- Log addition
      }
      else {
         Print("Importance level already selected: ", selected_imp,"(",selected_importance_lvl,")"); //--- Log already selected
      }
   }
   Print("SELECTED ARRAY SIZE = ", ArraySize(imp_filter_selected)," >< ",ArraySize(impact_filter_selected)); //--- Log the size of the selected array
   ArrayPrint(imp_filter_selected); //--- Print the selected array
   ArrayPrint(impact_filter_selected);

   update_dashboard_values(curr_filter_selected,imp_filter_selected); //--- Update the dashboard with the selected filters

   ObjectSetInteger(0,sparam,OBJPROP_BORDER_COLOR,color_border);
   Print("SUCCESS. DASHBOARD UPDATED"); //--- Log success

   ChartRedraw(0); //--- Redraw the chart to reflect changes
}
Here, we first identify whether an importance filter button was clicked by using the function StringFind. This function checks if the clicked button's name (represented by "sparam") contains the string "IMPACT_LABEL". If it does, we proceed to retrieve the importance level associated with the button by calling the ObjectGetString function and passing the text property, which gets the text (like "Low", "Medium", etc.) of the clicked button. We then convert this text to its corresponding enumeration value (such as CALENDAR_IMPORTANCE_LOW) by passing the selected label to the function "get_importance_level(impact_labels, allowed_importance_levels, selected_imp)". This function takes the array of labels, the allowed enumeration values, and the selected text label to return the appropriate importance level as an enum. We will cover the custom function later.
Next, we check the state of the button using the ObjectGetInteger function and passing the state property, which determines whether the button is in a selected state (true) or unselected state (false). Based on this state, we either add or remove the selected importance level from the filter arrays. If the button is unselected, we iterate through the "imp_filter_selected" array and remove the importance level, resizing the array with the ArrayResize function. We also do the same for the "impact_filter_selected" array to ensure both arrays stay in sync. If the button is selected, we first check if the importance level is already in the filter arrays using a loop. If it's not, we add it to both arrays by resizing them and appending the new value.
Once the arrays are updated, we use the ArrayPrint function to log the current contents of the filter arrays for debugging. Then, we update the dashboard with the new filter selections by calling "update_dashboard_values(curr_filter_selected, imp_filter_selected)", which reflects the changes in the filter arrays on the dashboard. We have updated the function to take the two array parameters now as per the user preferences. We will also have a look at it later. Finally, the appearance of the clicked button is updated by setting its border color with to the calculated color, where the color is determined based on whether the button is selected or not. We then redraw the chart using the ChartRedraw function to visually reflect the changes.
Now let us have a look at the custom function that takes care of getting the corresponding importance level enumeration.
//+------------------------------------------------------------------+
//| Function to get the importance level based on the selected label |
//+------------------------------------------------------------------+
ENUM_CALENDAR_EVENT_IMPORTANCE get_importance_level(string &impact_label[], ENUM_CALENDAR_EVENT_IMPORTANCE &importance_levels[], string selected_label) {
    // Loop through the impact_labels array to find the matching label
    for (int i = 0; i < ArraySize(impact_label); i++) {
        if (impact_label[i] == selected_label) {
            // Return the corresponding importance level
            return importance_levels[i];
        }
    }

    // If no match found, return CALENDAR_IMPORTANCE_NONE as the default
    return CALENDAR_IMPORTANCE_NONE;
}
Here, we define an enumeration function "get_importance_level", which is used to determine the importance level based on the selected label. The function takes three parameters:
- "impact_label": This is an array of strings that holds the different labels for impact levels (like "None", "Low", "Medium", and "High").
- "importance_levels": This array holds the corresponding importance levels as enum values (like CALENDAR_IMPORTANCE_NONE, CALENDAR_IMPORTANCE_LOW, etc.).
- "selected_label": This is the label (a string) passed to the function that represents the importance level the user selected (for example, "Medium").
Inside the function, we loop through the "impact_label" array using a for loop. For each iteration, we check if the current item in the array matches the "selected_label". If a match is found, we return the corresponding importance level from the "importance_levels" array at the same index. If no match is found after checking all the labels, the function defaults to returning CALENDAR_IMPORTANCE_NONE. We need this function to help us convert a string representing the selected impact level (like "Medium") into its corresponding importance level (like "CALENDAR_IMPORTANCE_MODERATE").
The other changes that we did was passing the new importance filtered array data into the update function as reference so that the filters take effect dynamically as per the updated user preferences. The function declaration now resembles the one shown in the code snippet below.
//+------------------------------------------------------------------+
//| Function to update dashboard values                              |
//+------------------------------------------------------------------+
void update_dashboard_values(string &curr_filter_array[], ENUM_CALENDAR_EVENT_IMPORTANCE &imp_filter_array[]){

//---

}
After the update of the function, we also need to update the existing similar functions to contain the importance filter array. For example, the "OnInit" event handler function call will resemble this as shown below.
//+------------------------------------------------------------------+
//| Expert tick function                                             |
//+------------------------------------------------------------------+
void OnTick(){
//---

   if (isDashboardUpdate){
      update_dashboard_values(curr_filter_selected,imp_filter_selected);
   }

}
That is all that we need to incorporate both the currency and the importance filters. Let us have a look at the current milestone to ascertain that the importance filters are also working as we anticipate.
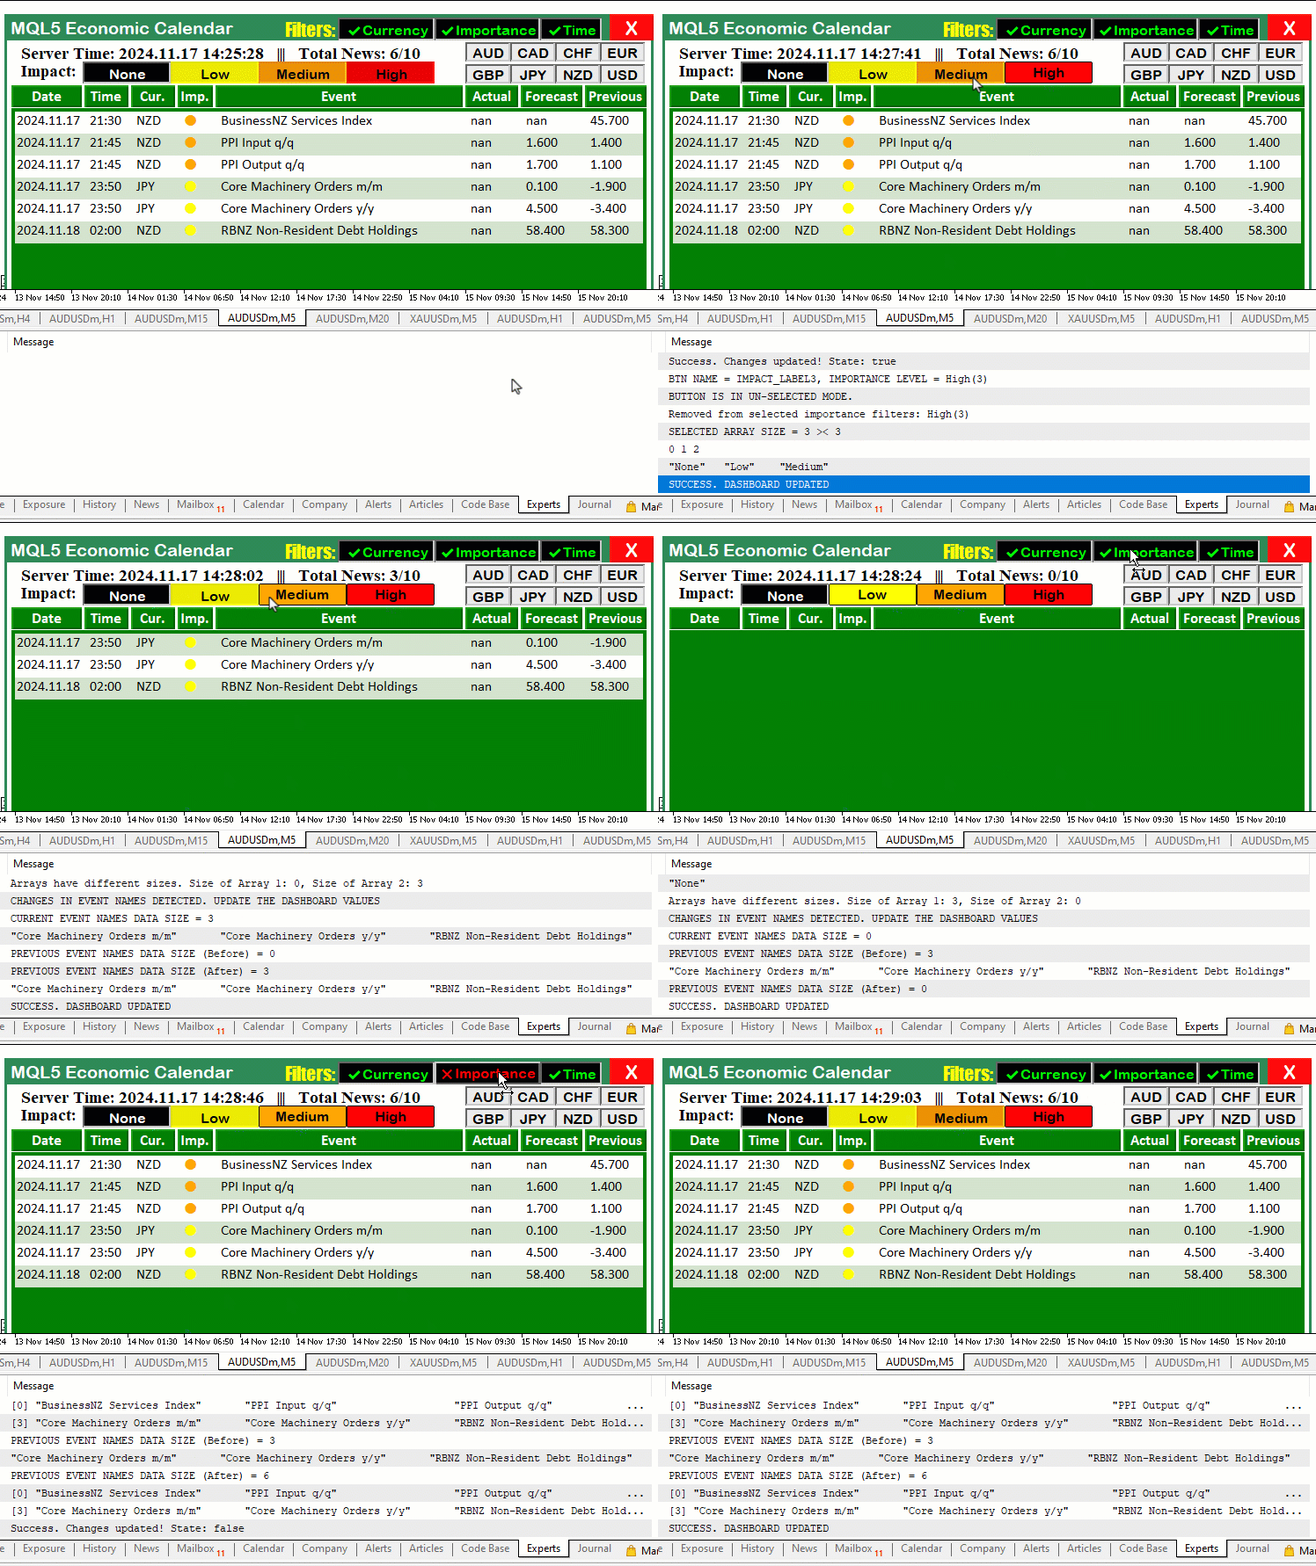
From the visualization, we can see that we achieved our objective of adding the Importance-filter responsiveness. Lastly, one thing that we can update is the total events that we display. We can have the number of filtered events, the total possible events that we can display in the chart, and the total events considered. Here is the logic we can use to achieve that. On the global scope, we can define some track variables.
int totalEvents_Considered = 0;
int totalEvents_Filtered = 0;
int totalEvents_Displayable = 0;
Here, we define three integer variables: "totalEvents_Considered", "totalEvents_Filtered", and "totalEvents_Displayable". These variables will serve as counters to track the status of events during processing:
- "totalEvents_Considered": This variable will keep track of the total number of events that are initially considered during the processing step. It represents the starting point, where all events are taken into account before any filtering is applied.
- "totalEvents_Filtered": This variable will count the total number of events that are excluded or filtered out based on the applied conditions, such as currency, importance, or time filters. It indicates how many events were removed from the dataset.
- "totalEvents_Displayable": This variable will track the total number of events that remain after filtering and are eligible for display on the dashboard. It represents the final set of events that meet all the filtering criteria and are displayable.
By using these counters, we can monitor and analyze the event processing pipeline, ensuring that the filtering logic works as expected and providing insights into the overall flow of data. Next, before any data filtering action takes place, we default them to 0.
totalEvents_Displayable = 0;
totalEvents_Filtered = 0;
totalEvents_Considered = 0;
Before the first loop, we replace the earlier values with the latest values to consider all the events. Here is an example.
//--- Loop through each calendar value up to the maximum defined total
for (int i = 0; i < allValues; i++){

//---

}
Instead of applying the restriction conditions early, you can see we still consider all the events. This will help to show us the overflow data. Thus inside the loop, we will have the following update logic.
   //--- Loop through each calendar value up to the maximum defined total
   for (int i = 0; i < allValues; i++){

      MqlCalendarEvent event; //--- Declare event structure
      CalendarEventById(values[i].event_id,event); //--- Retrieve event details by ID

      //--- Other declarations

      totalEvents_Considered++;

      //--- Check if the event’s currency matches any in the filter array (if the filter is enabled)
      bool currencyMatch = false;
      if (enableCurrencyFilter) {
         for (int j = 0; j < ArraySize(curr_filter); j++) {
            if (country.currency == curr_filter[j]) {
               currencyMatch = true;
               break;
            }
         }

         //--- If no match found, skip to the next event
         if (!currencyMatch) {
            continue;
         }
      }

      //--- Other filters

      //--- If we reach here, the filters passed
      totalEvents_Filtered++;

      //--- Restrict the number of displayable events to a maximum of 11
      if (totalEvents_Displayable >= 11) {
        continue; // Skip further processing if display limit is reached
      }

      //--- Increment total displayable events
      totalEvents_Displayable++;

      //--- Set alternating colors for data holders
      color holder_color = (totalEvents_Displayable % 2 == 0) ? C'213,227,207' : clrWhite;

      //--- Create rectangle label for the data holder
      createRecLabel(DATA_HOLDERS + string(totalEvents_Displayable), 62, startY - 1, 716, 26 + 1, holder_color, 1, clrNONE);

      //--- Initialize starting x-coordinate for each data entry
      int startX = 65;

      //--- Loop through calendar data columns
      for (int k=0; k<ArraySize(array_calendar); k++){

         //--- Prepare news data array with time, country, and other event details
         string news_data[ArraySize(array_calendar)];
         news_data[0] = TimeToString(values[i].time,TIME_DATE); //--- Event date
         news_data[1] = TimeToString(values[i].time,TIME_MINUTES); //--- Event time
         news_data[2] = country.currency; //--- Event country currency

         //--- Other fills and creations
      }

      ArrayResize(current_eventNames_data,ArraySize(current_eventNames_data)+1);
      current_eventNames_data[ArraySize(current_eventNames_data)-1] = event.name;

      //--- Increment y-coordinate for the next row of data
      startY += 25;

   }
   Print("CURRENT EVENT NAMES DATA SIZE = ",ArraySize(current_eventNames_data));
   //--- Other logs

   updateLabel(TIME_LABEL,"Server Time: "+TimeToString(TimeCurrent(),
              TIME_DATE|TIME_SECONDS)+"   |||   Total News: "+
              IntegerToString(totalEvents_Displayable)+"/"+IntegerToString(totalEvents_Filtered)+"/"+IntegerToString(totalEvents_Considered));
//---
Here, we just update the event number holders accordingly. One crucial thing to note is the code snippet that we have highlighted in light blue. Its logic works the same as the filters where if the total displayable limit is met, we skip processing. Finally, we update the label to contain all the 3 event counts, which helps us know the data overflow count in the long run. We then apply the same logic to the updates function to ensure it synchronizes in real-time as well. Upon running the system, we have the following outcome.
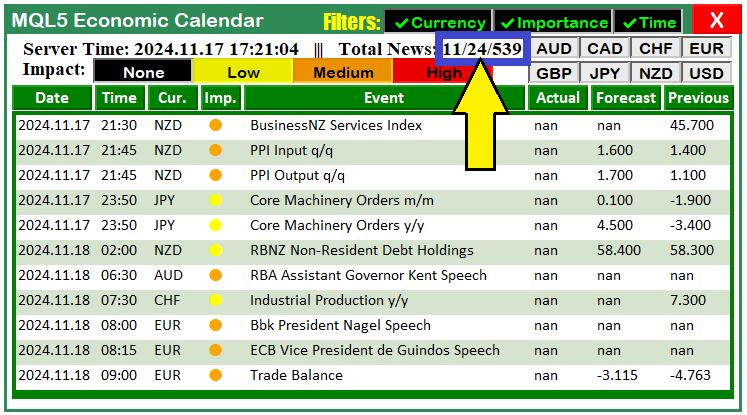
From the image, we can see that we now have 3 news counts. The first number, 11 in this case, shows the number of total displayable news, the second, 24, shows the number of the total filtered events, only that we can't display all of them on the dashboard, and the third one, 539, shows the total number of news considered for processing. With all that, to enable the time filter, we can have the desired time ranges in input formats so we can set them when we are initializing the program. Here is the logic to achieve that.
sinput group "General Calendar Settings"
input ENUM_TIMEFRAMES start_time = PERIOD_H12;
input ENUM_TIMEFRAMES end_time = PERIOD_H12;
input ENUM_TIMEFRAMES range_time = PERIOD_H8;
Here, we define a group called "General Calendar Settings" to provide configurable options for managing calendar-related functionality. We use three inputs of the type ENUM_TIMEFRAMES to control the time parameters within which calendar events are filtered or analyzed. First, we define "start_time", which specifies the beginning of the time range for calendar events, defaulting to 12 hours ("PERIOD_H12").
Next, we introduce "end_time", which marks the end of this time range, also set to "PERIOD_H12" by default. Finally, we use "range_time" to define the duration or span of interest for calendar filtering or calculations, with a default value of 8 hours ("PERIOD_H8"). By doing this, we ensure that the program operates flexibly based on user-defined timeframes, allowing us to adapt the calendar data to specific intervals of interest. These settings enable dynamic filtering and provide user control over the temporal scope of the events displayed or analyzed.
To effect the changes, we add them to the control inputs of their respective holder functions and logics as follows.
//--- Define start and end time for calendar event retrieval
datetime startTime = TimeTradeServer() - PeriodSeconds(start_time);
datetime endTime = TimeTradeServer() + PeriodSeconds(end_time);

//--- Define time range for filtering news events based on daily period
datetime timeRange = PeriodSeconds(range_time);
datetime timeBefore = TimeTradeServer() - timeRange;
datetime timeAfter = TimeTradeServer() + timeRange;
That is all. Upon compilation, we have the following output.
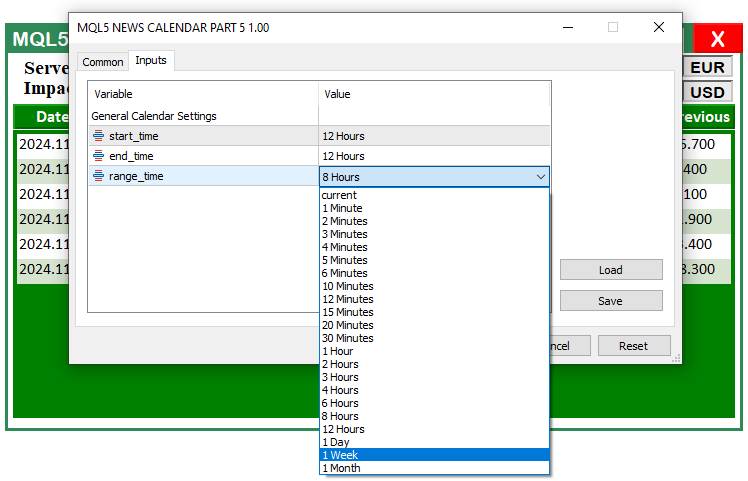
From the image, we can see that we can now access the input parameters, and choose the time settings from the dropdown list enabled. Up to this point, our dashboard is fully functional and responsive. We just need to test it on different conditions and environments to ensure that it works very fine without any faults, and if any are encountered, mitigate it. That is done in the next section.
Testing the Enhanced Dashboard
In this section, we perform testing on the enhanced dashboard we’ve developed. The goal is to ensure that all the filters, event tracking, and data display mechanisms work as intended. We’ve implemented a series of filters, including currency, importance, and time filters, that allow us to view and analyze calendar events more effectively.
The testing process involves simulating user interactions with the dashboard, enabling and disabling filters, and ensuring the calendar events are updated dynamically based on the selected criteria. We also verify the correct display of event data, such as country, currency, importance level, and event time, within the defined time range.
By running various test scenarios, we confirm the functionality of each feature, such as filtering events based on importance or currency, limiting the number of events displayed, and ensuring that the data labels update as expected. The video below demonstrates these tests in action.
Conclusion
In conclusion, we have successfully developed and tested the enhanced MQL5 Economic Calendar dashboard, ensuring that the filters, data displays, and event-tracking systems function seamlessly. This dashboard provides an intuitive interface to track economic events, applying filters based on currency, importance, and time, which helps us to stay informed and make market data-driven decisions.
Moving forward, in the next part of this series, we will build on this foundation to integrate signal generation and trade entries. By leveraging the data from the enhanced dashboard, we will develop a system that can automatically generate trading signals based on economic events and market conditions, enabling more efficient and informed trading strategies. Keep tuned.
 Utilizing CatBoost Machine Learning model as a Filter for Trend-Following Strategies
 Reimagining Classic Strategies (Part 12): EURUSD Breakout Strategy
 MQL5 Trading Toolkit (Part 4): Developing a History Management EX5 Library
 Trading Insights Through Volume: Trend Confirmation
- Free trading apps
- Over 8,000 signals for copying
- Economic news for exploring financial markets
You agree to website policy and terms of use