Guarda i video tutorial del Market su YouTube
Come acquistare un Robot di Trading o un indicatore
Esegui il tuo EA
hosting virtuale
hosting virtuale
Prova un indicatore/robot di trading prima di acquistarlo
Vuoi guadagnare nel Market?
Come presentare un prodotto per venderlo con successo
Nuovi indicatori tecnici per MetaTrader 5 - 25
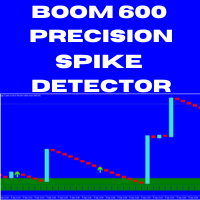
Boom 600 Precision Spike Detector The Boom 600 Precision Spike Detector is your ultimate tool for trading the Boom 600 market with precision and confidence. Equipped with advanced features, this indicator helps you identify potential buy opportunities and reversals, making it an essential tool for traders aiming to capture spikes with minimal effort. Key Features: Non-Repainting Signals: Accurate, non-repainting signals that you can trust for reliable trading decisions. Audible Alerts: Stay on t

In the context of trading, Malaysia SNR (Support and Resistance) refers to the technical analysis of support and resistance levels in financial markets, particularly for stocks, indices, or other assets traded. This is single timeframe version. Multiple timeframe version is avaiable here . There are three type of Malaysia SNR level Classic , GAP and Flipped 1. Classic Support is the price level at which an asset tends to stop falling and may start to rebound. It acts as a "floor" where demand is

Market Profile Introducing the Market Profile MetaTrader Indicator—your gateway to mastering market dynamics with precision and insight. This powerful tool delivers a classic Market Profile analysis, revealing price density over time and highlighting crucial levels, including the value area and control value for any trading session.
Compatible with timeframes from M1 to D1, it adapts to daily, weekly, monthly, or even intraday sessions, offering you unmatched flexibility. Lower timeframes prov
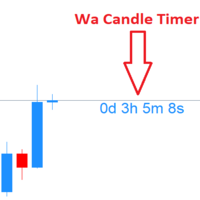
Wa Candle Timer MT5 è un indicatore potente e facile da usare che mostra il tempo rimanente prima che si formi la prossima candela sul grafico MT5. Aiuta i trader a monitorare la chiusura delle candele per eseguire operazioni con maggiore precisione. Caratteristiche principali :
Visualizza il conto alla rovescia per la candela attuale.
Cambia colore quando il tempo residuo scende sotto una percentuale definita dall’utente.
Avviso personalizzabile al raggiungimento della percentuale imp
FREE
L'indicatore MA Killer è l'arma definitiva per i trader che utilizzano le medie mobili. Si tratta di un sistema completo che si avvale di numerosi strumenti accessibili direttamente da un pannello di gestione. Grazie ai suoi strumenti hai una panoramica del mercato e un prezioso aiuto nel processo decisionale per l'ingresso in una posizione.
Consiste:
- L'indicatore Trend Master chart che visualizza la tendenza direttamente sul grafico utilizzando un codice colore. Questa tendenza è calcolata

Presentazione di Trade Sniper: il tuo vantaggio sui mercati.
Versione MT4: https://www.mql5.com/en/market/product/122371
Stanco di perdere operazioni redditizie o di essere trovato dalla parte sbagliata del mercato? Scopri Trade Sniper, l'indicatore all'avanguardia che sfrutta la potenza delle tendenze per darti un netto vantaggio nel tuo trading.
Trend Sniper non è solo un altro indicatore banale. È uno strumento sofisticato che combina algoritmi avanzati con principi di trading collaudati

Panoramica L'indicatore Multi Level ATR e Moving Average Band offre un'analisi completa dei movimenti dei prezzi considerando la volatilità. La rappresentazione visiva attraverso diverse bande facilita l'identificazione delle fasi di tendenza e consolidamento, nonché dei potenziali punti di inversione. Grazie alle opzioni di personalizzazione, gli utenti possono adattare l'indicatore alle loro esigenze di trading specifiche. Caratteristiche Visualizzazione di più bande: Livelli di prezzo basati

Hydra Trend Rider is a non-repainting, multi-timeframe trend indicator that delivers precise buy/sell signals and real-time alerts for high-probability trade setups. With its color-coded trend line, customizable dashboard, and mobile notifications, it's perfect for traders seeking clarity, confidence, and consistency in trend trading. Download the Metatrader 4 Version Message us here after purchase to get the Indicator Manual. Download Now! Offer valid only for next 10 Buyers. Price will increas

TK - Rainbow Indicator Description: The TK - Rainbow indicator is a robust tool for technical analysis, designed to provide a clear view of market trends through a multi-line approach. With 30 lines calculated at different periods, it offers an extensive analysis of price movements. The indicator uses a dual-color scheme to highlight upward and downward trends, making it easy to interpret market conditions at a glance. Key Features: 30 Lines: Each line represents a different smoothing period to
FREE

Smart Fibo Zones are powerful, auto-generated Fibonacci Retracements that are anchored to key market structure shifts . These zones serve as critical Supply and Demand levels, guiding you to identify potential price reactions and confirm market direction. Fibonacci calculations, widely used by professional traders, can be complex when it comes to identifying highs and lows. However, Smart Fibo Zones simplify this process by automatically highlighting order blocks and key zones, compl
Stochastic Alert Indicator for MetaTrader 5
The Stochastic Alert Indicator is a powerful and customizable tool designed for the MetaTrader 5 platform, perfect for traders who want to monitor overbought and oversold conditions while staying informed of potential buying and selling pressure. Key Features: Overbought/Oversold Detection: Automatically detects when the market reaches overbought (above 80) or oversold (below 20) levels, providing you with timely alerts for potential reversal points.
FREE

Previous Candle Levels MT5 shows the previous candle levels, it shows the previous candle Open High Low Close levels (OHLC Levels) in different time frame. It's designed to help the trader to analyse the market and pay attention to the previous candle levels in different time frame. We all know that the OHLC Levels in Monthly, Weekly and Daily are really strong and must of the time, the price strongly reacts at those levels. In the technical analysis, the user can use them as a support and res
FREE

Note from Developer:
This is the lite version of the Double TMA with Bands Indicator.
I will be uploading a paid version that comes with alerts and on screen signal arrows built in.
I will also be selling an EA based on this trading system once all backtesting and optimization have been completed.
Unlock your trading potential with the Double TMA Indicator with Reversal Detection!
Designed for swing and reversal trading, this versatile tool integrates two Triangular Moving Averages (TMA) f
FREE

!!!This Free Version just works on EURUSD!!! Wa Previous Candle Levels MT5 shows the previous candle levels, it shows the previous candle Open High Low Close levels (OHLC Levels) in different time frame. It's designed to help the trader to analyse the market and pay attention to the previous candle levels in different time frame. We all know that the OHLC Levels in Monthly, Weekly and Daily are really strong and must of the time, the price strongly reacts at those levels. In the technical anal
FREE

Buy Sell Storm
Professional indicator for trading on financial markets, designed for MT5 platform .
Trading on the indicator is very simple, Blue arrow to buy , Red arrow to sell.
Special offer - https://www.mql5.com/en/users/bossik2810
The indicator does not redraw and does not change its values.
( see the video of the EA on the indicator).
In the default settings the Period parameter is set to - 1
You can change this parameter for more accurate signals.
If you have any questions
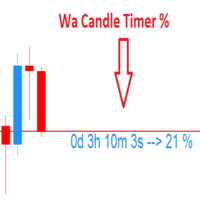
Wa Candle Timer Percentage MT5 is an indicator which shows the user how much time is remaining until the next candle will form. The percentage of the evolution of the current candle is also displayed. The user can set the percentage that the candle timer will change the color. These are the settings: 1- The percentage that the candle timer will change the color. 2- Color of Candle Timer when it's BELOW the percentage set by the user. 3- Color of Candle Timer when it's ABOVE the percentage set b
FREE
Moving Average Crossover Alerts by Chart Walker
The Moving Average Crossover Alerts Indicator is designed to help traders identify potential trend reversals and entry/exit points in the market. By tracking two moving averages—typically a faster (short-term) and a slower (long-term) one—the indicator generates alerts whenever these moving averages cross. Key Features: Customizable Moving Averages: Choose from various types of moving averages (SMA, EMA, WMA, etc.) and set your desired periods for
FREE

Enjoy the Free Candle Color indicator.
Kijun Sen is an element of Ichimoku Kinko Hyo Indicator, it's far too complicated for many traders hence they tend to be confused. We have simplified it so the Kijun Sen will change colors as it activates without the Tenkan Sen, Senkou Span, Up Kumo and Down Kumo. Customize to your period parameter and colors of your choice. Great for beginners and seasoned traders. Set your period and enjoy
GOOD LUCK and ALL THE BEST IN YOUR TRADING JOURNEY !!!!!
FREE
MACD ADX Oscillator – a powerful indicator that combines the best of the Moving Average Convergence Divergence (MACD) and the Average Directional Index (ADX) to provide unparalleled insights into market momentum and trend strength.
Key Features: Dual Momentum Analysis: This indicator merges MACD's ability to detect changes in market momentum with ADX's strength measurement, giving you a comprehensive view of the market's direction and power. Customizable Settings: Tailor the indicator to your t

Percentage Price Oscillator (PPO) for MT5 – a dynamic tool designed to measure price momentum and trend direction with precision. Core Features: Flexible Configuration : Customize the PPO to match your trading approach by adjusting the Fast Length, Slow Length, and Signal Length. The indicator is also versatile enough to adapt to any market condition with various source inputs. Intuitive Histogram Display : Choose to visualize the difference between the PPO and Signal lines with a histogram, pro

Overview
The Period Breakout Indicator is a versatile tool designed for traders seeking to identify breakout opportunities based on customizable time periods. This indicator automatically determines the highest and lowest prices within a user-defined period, allowing you to tailor it precisely to your trading strategy. Key Features
Customizable Time Periods: Define the start and end times based on your preferred trading hours or any specific period. The indicator will then calculate the highes
FREE
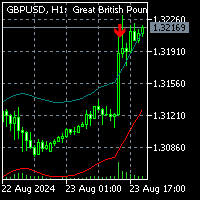
To get access to MT4 version click here . This is the exact conversion from "Nadaraya-Watson Envelope" by " LuxAlgo ". (with non-repaint input option) This is not a light-load processing indicator if repaint input is set to true . All input options are available. Buffers are available for processing in EAs. I changed default input setup to non-repaint mode for better performance required for mql market validation procedure . Here is the source code of a simple Expert Advisor operating based on
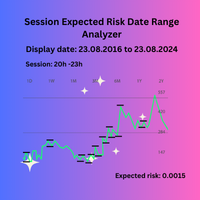
Session Expected Risk Date Range Analyzer: Analyzes price data across specified date ranges to provide detailed insights into financial risk and volatility, using each bar's price metrics for accurate risk assessment.
The Session Expected Risk Date Range Analyzer is a sophisticated tool designed to offer traders and analysts detailed insights into the expected financial risk across specific date ranges. Unlike traditional session-based analysis, this indicator focuses on calculating risk metr
FREE
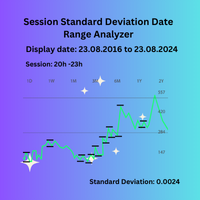
Session Standard Deviation Date Range Analyzer: Evaluate the standard deviation of each bar's price (high, low, close, open, weighted, median, and typical) within defined trading sessions and date ranges, providing detailed insights into price volatility and market behavior. **Note:** When the trading platform is closed, the indicator may not load correctly. To ensure it works, you may need to load the indicator, unload it, and then load it again. **Note:** : This indicator can only be used wit
FREE

The Kijun Sen is a component of Ichimoku Kinko Hyo indicator. The Ichimoku Kinko Hyo is a technical analysis indicator that measures the direction, momentum, and strength of trends in the market , effectively helping traders point out trade signals where possible. Its lines also serve as support and resistance lines that give traders further insight into the market dynamics.
PLEASE CONTACT US for any assistance in the comments section. The Entry criteria used ensures that sniper entries are
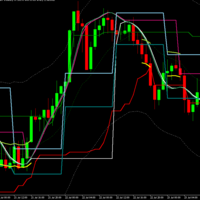
Mega Analyzer MT5 Indicator: A Comprehensive Trading Solution In the dynamic world of trading, having an edge can make all the difference. The "Mega Analyzer MT5 Indicator" offers traders that edge, providing a powerful tool that deciphers market movements with precision and clarity. Designed for both novice and experienced traders, this indicator is tailored to enhance decision-making and optimize trading strategies by revealing key price levels and market conditions that often go unnoticed by
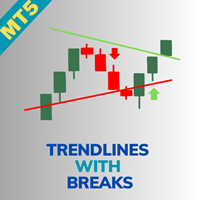
Indicator Name: Trendlines with Breaks [LuxAlgo] Overview: The Trendlines with Breaks [LuxAlgo] indicator provides traders with pivot point-based trendlines that highlight real-time breakouts. This tool is highly customizable, allowing users to adjust the steepness of trendlines, choose different slope calculation methods, and receive alerts on trendline breakouts. Key Features: Pivot Point-Based Trendlines: The indicator automatically generates trendlines based on pivot points, providing a clea
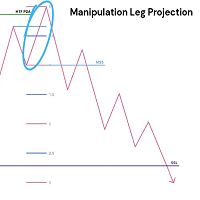
This indicator delves into using standard deviations as a tool in trading, specifically within the Inner Circle Trader (ICT) framework. Standard deviations are a statistical measure that helps traders understand the variability of price movements. These projections is use to forecast potential price targets, identify support and resistance levels, and enhance overall trading strategies. Key Concepts: Understanding Standard Deviations : Standard deviations measure how much a set of values (in thi
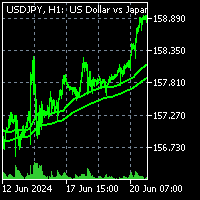
To get access to MT4 version please click here . This is the exact conversion from TradingView: "Liquidity Weighted Moving Averages" by "AlgoAlpha ". This is a light-load processing and non-repaint indicator. All input options are available expect time frame input . Buffers are available for processing in EAs. You can message in private chat for further information/changes you need. Thanks for downloading

Coral trend is a trend-following indicator that is widely popular among FOREX traders . It is usually used as a confluence with other indicators. It uses combinations of moving averages with complex smoothing formulas! It has two configurable parameters: Coefficient - smoothing ratio (*)
Applied price Calculation: Coral = (-0.064) * B6 + 0.672 * B5 - 2.352 * B4 + 2.744 * B3
FREE

The true strength index is a technical indicator used in the analysis of financial markets that attempts to show both trend direction and overbought/oversold conditions. It was first published William Blau in 1991. The indicator uses moving averages of the underlying momentum of a financial instrument. The True Strength Index (TSI) is a momentum oscillator that ranges between limits of -100 and +100 and has a base value of 0.
FREE

The SpreadTracer and TimeLeft indicator is a powerful yet straightforward tool designed for traders who want to keep a close eye on market conditions directly on their chart. This custom indicator provides essential real-time information about the spread and candle time, making it easier to make informed trading decisions. Key Features: Current Spread Monitoring : The indicator constantly displays the current spread of the trading pair, helping you assess the cost of entering or exiting a positi
FREE

Trendline Wizard Overview: The Trendline Wizard is a powerful and versatile MetaTrader 5 indicator designed for traders who rely on trendlines for their technical analysis. This indicator automatically monitors specified trendlines and provides real-time alerts when price action interacts with these critical levels. Whether you’re a swing trader, day trader, or long-term investor, the Trendline Wizard is an essential tool to enhance your trading strategy. Key Features: Customizable Alerts : Set

ATLogic Indicatore ATLogic: Uno strumento versatile per tutti gli strumenti di trading ATLogic è uno strumento completo e user-friendly per l'analisi tecnica, progettato per un'ampia gamma di strumenti finanziari, comprese tutte le coppie di valute, indici e criptovalute. Questo indicatore versatile offre ai trader potenti intuizioni su vari mercati: Lascia un messaggio dopo l'acquisto e ricevi un regalo bonus speciale. "Contattami per metterti in contatto con il mio tutor AI e scoprire come ut

HiperCube AutoTrend Lines Codice sconto del 20% su Darwinex Zero: DWZ2328770MGM_20 Questo indicatore ti aiuta a identificare facilmente supporti e resistenze, tracciare linee nel grafico e sapere dove si trova un punto importante nel mercato. Questo strumento è il modo migliore per automatizzare in modo semi automatico il tuo trading, svolgendo parte del lavoro per te. Resistenza o supporto sono livelli importanti che a volte sono difficili da identificare, ma ora non ti creeranno più confusion
FREE

Financial Indicator SolarTrade Suite: Comet Market Indicator - La tua guida affidabile nel mondo dei mercati finanziari!
Questo è un indicatore di periodo che utilizza speciali algoritmi innovativi e avanzati per calcolare il suo valore, e ha anche un design gradevole e funzioni aggiuntive.
È molto facile capire le letture di questo indicatore: una linea verticale verde è l'inizio di un nuovo periodo. Come funzioni aggiuntive: - clicca più volte nella metà superiore della finestra del grafico

Benvenuti a HiperCube Renko Candles Codice sconto del 25% su Darwinex Zero: DWZ2328770MGM Questo indicatore fornisce informazioni reali sul mercato trasformandolo in Renko Candle Style.
Definizione I grafici Renko sono un tipo di grafico finanziario che misura e traccia le variazioni di prezzo, utilizzando mattoni (o barre) per rappresentare i movimenti di prezzo. A differenza dei tradizionali grafici a candela, i grafici Renko non visualizzano informazioni basate sul tempo, concentrandosi esc
FREE
Indicatore di Spread Gratuito per MetaTrader 5 Questo indicatore offre un'analisi dettagliata dello spread su MetaTrader 5, uno dei parametri più importanti per i trader, poiché rappresenta la differenza tra il prezzo di acquisto (Ask) e il prezzo di vendita (Bid) di un asset. L'indicatore include: Spread Medio : Calcolato come la media tra lo spread massimo e minimo osservato durante la giornata. Spread Corrente : Visualizza lo spread attuale del mercato. Spread Minimo : Mostra il valore minimo
FREE

"HiperCube USD INDEX (DXY /USDX) " è un benchmark finanziario che rappresenta la performance di un gruppo specifico di asset, come azioni, obbligazioni o materie prime, con valori denominati in dollari USA. Questi indici aiutano gli investitori a monitorare e confrontare la performance di particolari settori o mercati nel tempo. Essendo espresso in USD, l'indice fornisce una misura coerente per valutare gli investimenti, indipendentemente dalla valuta nativa o dalla posizione geografica degli a
FREE

CVD SmoothFlow Pro - Analisi del Volume Illimitata per Qualsiasi Attivo! CVD SmoothFlow Pro è la soluzione definitiva per i trader che cercano un'analisi del volume precisa e illimitata. Utilizzando il calcolo del Cumulative Volume Delta (CVD) con filtraggio avanzato del rumore, la versione Pro offre la flessibilità e la precisione necessarie per operare su qualsiasi strumento finanziario. Cosa offre CVD SmoothFlow Pro? Analisi Chiara : Filtra il rumore di mercato e mette in risalto i movi

Il Super Indicator è una soluzione di trading completa su misura per trader nuovi ed esperti. Combina oltre 5 indicatori per avvisare
Chiarezza del segnale: offre segnali a freccia per punti di ingresso e uscita chiari. Avvisi in tempo reale: mantiene i trader informati con avvisi di entrata e uscita dalle operazioni. Caratteristiche:
Non riverniciabile Attivazioni massime 7+ strategie 5 indicatori tutto in uno Punti e frecce di entrata e uscita Avvisi per telefono ed e-mail Raccomanda

Indicator "Fair Value Gap" (FVG) - Scopri il Potere delle Aree di Sbilanciamento nel Mercato Il mondo del trading è pieno di opportunità nascoste, ma solo chi ha gli strumenti giusti può identificarle e sfruttarle al meglio. Il nostro Indicatore FVG è stato progettato per aiutarti a fare proprio questo. Se sei un trader che cerca di migliorare la sua capacità di leggere il mercato e di trovare i migliori punti di ingresso e uscita, l'Indicatore FVG è l'alleato perfetto per te. Cos'è un Fair Valu

Benvenuti a HiperCube VIX Codice sconto del 25% su Darwinex Zero: DWZ2328770MGM Questo indicatore fornisce informazioni reali sul mercato del volume di sp500 / us500
Definizione HiperCube VIX, noto come CBOE Volatility Index, è una misura ampiamente riconosciuta della paura o dello stress del mercato. Segnala il livello di incertezza e volatilità nel mercato azionario, utilizzando l'indice S&P 500 come proxy per il mercato in generale. L'indice VIX è calcolato in base ai prezzi dei contratti d
FREE

Benvenuti a HiperCube DonChian Codice sconto del 20% su Darwinex Zero: DWZ2328770MGM_20 Questo indicatore fornisce informazioni molto utili sul prezzo, mostrando quando il prezzo probabilmente salirà o scenderà.
Caratteristiche: Indicatore nelle finestre principali Personalizza i colori delle tue candele Personalizza il periodo dell'indicatore Imposta Off Imposta i parametri
Come interpretare: Trend rialzista: se alcune candele salgono dalla banda superiore, significa che è possibile che si s
FREE

Profilo di mercato HiperCube! Codice sconto del 20% su Darwinex Zero: DWZ2328770MGM_20 Un profilo di mercato è una rappresentazione grafica che combina informazioni su prezzo e tempo sotto forma di distribuzione. Visualizza le informazioni sui prezzi sulla scala verticale (asse y) e le informazioni sul volume sulla scala orizzontale (asse x). Questo tipo di grafico fornisce informazioni sull'attività di mercato, consentendo ai trader di visualizzare e valutare il giusto valore di mercato in tem
FREE

HiperCube ADX Histogram è qui! Codice sconto del 25% su Darwinex Zero: DWZ2328770MGM Questo indicatore ti aiuta a sapere se potrebbe esserci una forte tendenza nel mercato. ADX è un indicatore molto popolare e utile, quindi molti trader di alto livello consigliano di usarlo come filtro per le cattive operazioni o in combinazione con altre analisi. Con HiperCube ADX sarai un'esperienza premium usando un indicatore bello e fantastico per il tuo trading.
CARATTERISTICHE: Completamente personalizz
FREE
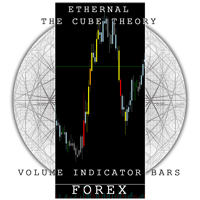
The Cube Bars Forex is an indicator for meta trader 5 created by me Tomas Lekim to color the candlesticks based on the volume peaks of the large investors in the forex market. It tracks the buy and sell peaks and paints the candles according to the amount of money invested by the other robots. It is a powerful tool against large robots because it identifies the moments when it must make decisions. It can be configured according to the currency pair you will use. It has 4 different colors so that
Indicatore di Conferma delle Entrate per MT5: Soluzione di Trading Precisa per Indici di Volatilità L'Indicatore di Conferma delle Entrate per MetaTrader 5 (MT5) è uno strumento potente e versatile, progettato specificamente per i trader che si concentrano sul trading degli indici di volatilità. Sia che tu voglia trarre profitto dal proseguimento del trend o identificare punti di inversione chiave, questo indicatore fornisce segnali chiari e utili che possono migliorare la tua strategia di tradi
The Omega Trend Indicator is an advanced tool that has been specifically designed to detect market trends early, and follow them efficiently. The indicator draws two lines. The main (thicker) Trend Line represents the presumed lower or upper volatility limits of the current market trend. A break in the main Trend Line indicates a potential reversal or shift in the movement of the trend. The Trend Line also indicates the best point to place a stop loss order. In Omega Trend Indicator, the Trend L
FREE

DYJ SmoothedMA Strategy is a very simple but powerful system to get forex and s ynthetic market trend direction. This indicator is actually a moving average indicator containing 10 smoothing algorithms in a file . The indicator can help you to see the whole trend break out/rebound signal. And these BUY and SELL signals are sent out. You can use DYJ GameDevice follow-up software to receive these signals and realize automatic opening and closing of positions. And can use the game strategy fu
Welcome to Super Trend System. The system has a track record of 18 months with a consistence performance in a live account. It is designed with a great trend base determination algorithm that performs over 88% of forex pairs positively. The algorithm is also populated by multi-time frames to find an overall market trend direction. Kindly find the images for trades management. How to use the System? When the signal line turns red, that is Sell signal, wait until the new red line creates and edg
FREE
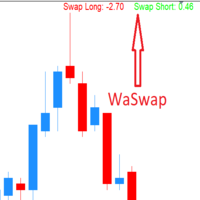
WaSwap MT5 Indicator shows the current Swap Long and current Swap Short with color.
* Set the Swap Threshold and the color to identify when the current swap is below or above the Spread Threshold.
* Set X axis and Y axis and chose the Corner and the Anchor to position the Swap Label on the chart.
* Write the font and the font size for more confort.
* Activate alert if the current Swap Long or the current Swap Short is below the swap threshold.
* The user will never swing with a negative sw
FREE

YOU CAN NOW DOWNLOAD FREE VERSIONS OF OUR PAID INDICATORS . IT'S OUR WAY OF GIVING BACK TO THE COMMUNITY ! >>> GO HERE TO DOWNLOAD
The Volatility Ratio was developed by Jack D. Schwager to identify trading range and signal potential breakouts. The volatility ratio is defined as the current day's true range divided by the true range over a certain number of days N (i.e. N periods). The following formula is used to calculate the volatility ratio: Volatility Ratio (VR) = Today's True Range
FREE

Crash 1000 Scalping Indicator for the Crash 1000 Deriv Synthetic Index. Introduction The Crash 1000 Scalping Indicator is a specialized tool designed for the Crash 1000 index on the Deriv Synthetic market. This indicator is particularly useful for scalping on the M1 timeframe, helping traders to identify precise entry and exit points for buy positions. It is designed to be non-repainting, providing clear signals with audible alerts and push notifications, and is compatible with mobile devices th
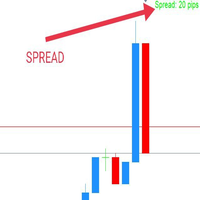
WaSpread MT5 Indicator shows the current spread in pips with color.
* Set the Spread Threshold and the color to identify when the current spread is below or above the Spread Threshold.
* Set X axis and Y axis and chose the Corner and the Anchor to position the Spread Label on the chart.
* Write the font and the font size for more confort.
* Activate alert if the current spread is above the spread threshold.
* For more precision, the user can choose to show the decimal numbers.
* The user
FREE

Looking to boost your trading performance on MT5? Introducing the signal indicator that will become your reliable ally on the path to success! This unique indicator utilizes arrows and a color-changing moving average to simplify your trading decisions. When the trend shifts upwards, the indicator turns the line blue, alerting you to potential price increases. If the trend reverses downwards, the line turns red, signaling a potential price drop. Additionally, arrows precisely indicate the optimal
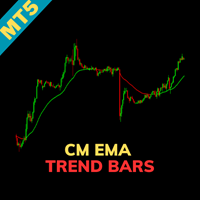
Indicator Name: CM EMA Trend Bars Overview: The CM EMA Trend Bars indicator is a straightforward yet effective tool that changes the color of price bars based on their relationship to the Exponential Moving Average (EMA). This visual cue helps traders quickly identify trend direction and potential trading opportunities. Key Features: Dynamic Bar Coloring: The indicator changes the color of the bars depending on whether they are above or below the EMA, providing a clear visual representation of t
FREE
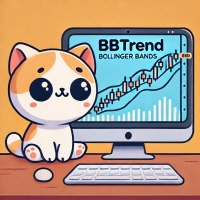
BBTrend is a powerful trend analysis tool designed to provide a clear overview of market volatility and trends at a glance.
This indicator calculates the difference between two Bollinger Bands of different periods,
visually indicating the strength of upward or downward trends to traders. Clear Trend Visualization: The upward trend is represented in green, and the downward trend in red,
allowing traders to intuitively grasp the direction and strength of the trend. Standardized Percentage Disp
FREE
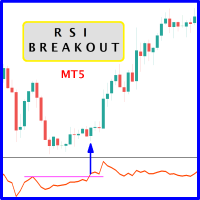
The likelihood of farther price movement increases when Relative Strength Index oscillator "RSI" breaks through its historical resistance levels in conjunction with prices breakout of resistance levels. It's strongly encouraged to confirm price breakout with oscillator breakout since they have comparable effects to price breaking support and resistance levels; similar perception is applied to short trades. Concept is based on find swing levels which based on number of bars by each side to confir
FREE
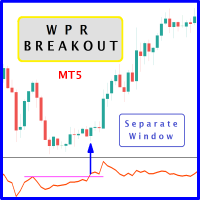
The likelihood of farther price movement increases when Larry Williams Percentage Range oscillator "WPR" breaks through its historical resistance levels in conjunction with prices breakout of resistance levels. It's strongly encouraged to confirm price breakout with oscillator breakout since they have comparable effects to price breaking support and resistance levels; similar perception is applied to short trades. Concept is based on find swing levels which based on number of bars by each side t
FREE
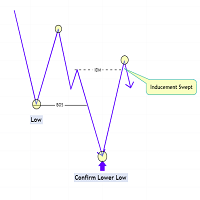
The Market Structure with Inducements & Sweeps indicator is a unique take on Smart Money Concepts related market structure labels that aims to give traders a more precise interpretation considering various factors.
Compared to traditional market structure scripts that include Change of Character (CHoCH) & Break of Structures (BOS) -- this script also includes the detection of Inducements (IDM) & Sweeps which are major components of determining other structures labeled on the chart.
SMC & pri
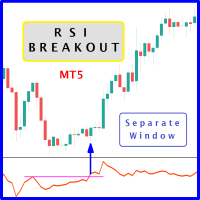
The likelihood of farther price movement increases when Relative Strength Index oscillator "RSI" breaks through its historical resistance levels in conjunction with prices breakout of resistance levels. It's strongly encouraged to confirm price breakout with oscillator breakout since they have comparable effects to price breaking support and resistance levels; similar perception is applied to short trades. Concept is based on find swing levels which based on number of bars by each side to confir
FREE
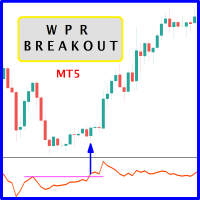
The likelihood of farther price movement increases when Larry Williams Percentage Range oscillator "WPR" breaks through its historical resistance levels in conjunction with prices breakout of resistance levels. It's strongly encouraged to confirm price breakout with oscillator breakout since they have comparable effects to price breaking support and resistance levels; similar perception is applied to short trades. Concept is based on find swing levels which based on number of bars by each side t
FREE
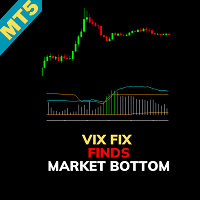
Indicator Name: CM_Williams_Vix_Fix Finds Market Bottoms Overview: The CM_Williams_Vix_Fix Finds Market Bottoms indicator is an advanced tool designed to identify market reversal points across various asset classes. Inspired by the original work of Larry Williams, this indicator provides similar insights to the VIX for stock indices but with the added flexibility of functioning effectively across all asset types. Key Features: Versatility Across Asset Classes: Unlike traditional indicators that

Session Average Date Range: Analyze and average the low - high of specific trading sessions within custom date ranges, offering insights into price movements and market behavior over selected periods. The "Session Average Date Range" tool is an advanced analytical utility designed to empower traders and analysts by allowing them to dissect and evaluate the high and low range of specific trading sessions within a user-defined date range. This tool provides a flexible and precise approach to analy
FREE

Adjustable Consecutive Fractals looks for 2 or more fractals in one direction and sends out a on screen alert, sound alert and push notification, for strong reversal points .
Adjustable Consecutive Fractals, shows the fractals on chart along with a color changing text for buy and sell signals when one or more fractals appear on one side of price.
Adjustable Consecutive Fractals is based Bill Williams Fractals . The standard Bill Williams fractals are set at a non adjustable 5 bars, BUT withe th
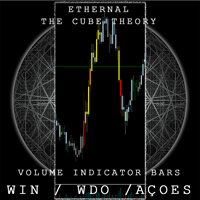
The Cube Bars Brasil pinta os candles de acordo com o volume , excelente para saber os picos de compra e venda . Pode ser regulado livremente pelo usario . Possui regulagem de parametro de entrada para que o usuario tenha a liberdade de regular o colume de acordo com o ativo que escolher . Possui 4 cores que diferenciam os candles de acordo com o tamanho do volume naquele instante
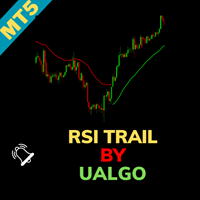
RSI Trail [UAlgo] Indicator for MetaTrader 5 The RSI Trail [UAlgo] indicator is a sophisticated technical analysis tool designed to enhance trading strategies by leveraging the Relative Strength Index (RSI) in conjunction with various moving average calculations. This indicator dynamically plots support and resistance levels based on RSI values, offering clear visual signals for potential bullish and bearish market conditions. Key Features:
Dynamic Support and Resistance Levels: The indicator u
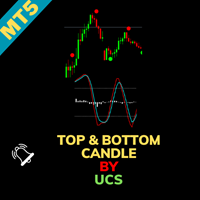
UCS_Top & Bottom Candle Indicator for MetaTrader 5 The UCS_Top & Bottom Candle is an innovative experimental indicator designed for MetaTrader 5. Based on momentum, this indicator identifies the top and bottom candles for most swing movements, assisting traders in making precise market entries and exits. Key Features: Momentum-Based Analysis: Utilizes momentum to detect the top and bottom candles for swing trading opportunities. Customizable Settings: Percent K: Set the Percent K value (default
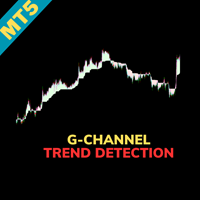
Indicator Name: G-Channel Trend Detection Overview: The G-Channel Trend Detection indicator offers a unique approach to trend analysis, leveraging AlexGrover's G-Channel methodology. This indicator provides a clear and simplified view of market trends by identifying bullish and bearish conditions based on price interactions with the G-Channel boundaries. Key Features: Trend-Based Market Analysis: The indicator determines trend direction by monitoring price action relative to the G-Channel bounda
Il MetaTrader Market è un sito semplice e pratico dove gli sviluppatori possono vendere le loro applicazioni di trading.
Ti aiuteremo a pubblicare il tuo prodotto e ti spiegheremo come prepararne la descrizione per il Market. Tutte le applicazioni sul Market sono protette da crittografia e possono essere eseguite solo sul computer dell'acquirente. La copia illegale è impossibile.
Ti stai perdendo delle opportunità di trading:
- App di trading gratuite
- Oltre 8.000 segnali per il copy trading
- Notizie economiche per esplorare i mercati finanziari
Registrazione
Accedi
Se non hai un account, registrati
Consenti l'uso dei cookie per accedere al sito MQL5.com.
Abilita le impostazioni necessarie nel browser, altrimenti non sarà possibile accedere.