Смотри обучающее видео по маркету на YouTube
Как купить торгового робота или индикатор
Запусти робота на
виртуальном хостинге
виртуальном хостинге
Протестируй индикатор/робота перед покупкой
Хочешь зарабатывать в Маркете?
Как подать продукт, чтобы его покупали
Новые технические индикаторы для MetaTrader 5 - 25

Adjustable Consecutive Fractals looks for 2 or more fractals in one direction and sends out a on screen alert, sound alert and push notification, for strong reversal points .
Adjustable Consecutive Fractals, shows the fractals on chart along with a color changing text for buy and sell signals when one or more fractals appear on one side of price.
Adjustable Consecutive Fractals is based Bill Williams Fractals . The standard Bill Williams fractals are set at a non adjustable 5 bars, BUT withe th
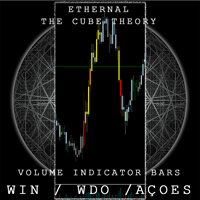
The Cube Bars Brasil pinta os candles de acordo com o volume , excelente para saber os picos de compra e venda . Pode ser regulado livremente pelo usario . Possui regulagem de parametro de entrada para que o usuario tenha a liberdade de regular o colume de acordo com o ativo que escolher . Possui 4 cores que diferenciam os candles de acordo com o tamanho do volume naquele instante
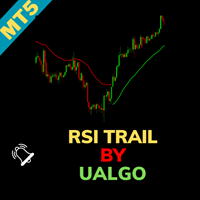
RSI Trail [UAlgo] Indicator for MetaTrader 5 The RSI Trail [UAlgo] indicator is a sophisticated technical analysis tool designed to enhance trading strategies by leveraging the Relative Strength Index (RSI) in conjunction with various moving average calculations. This indicator dynamically plots support and resistance levels based on RSI values, offering clear visual signals for potential bullish and bearish market conditions. Key Features:
Dynamic Support and Resistance Levels: The indicator u
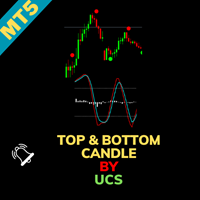
UCS_Top & Bottom Candle Indicator for MetaTrader 5 The UCS_Top & Bottom Candle is an innovative experimental indicator designed for MetaTrader 5. Based on momentum, this indicator identifies the top and bottom candles for most swing movements, assisting traders in making precise market entries and exits. Key Features: Momentum-Based Analysis: Utilizes momentum to detect the top and bottom candles for swing trading opportunities. Customizable Settings: Percent K: Set the Percent K value (default
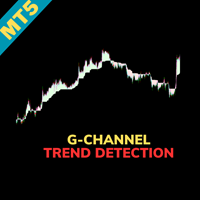
Indicator Name: G-Channel Trend Detection Overview: The G-Channel Trend Detection indicator offers a unique approach to trend analysis, leveraging AlexGrover's G-Channel methodology. This indicator provides a clear and simplified view of market trends by identifying bullish and bearish conditions based on price interactions with the G-Channel boundaries. Key Features: Trend-Based Market Analysis: The indicator determines trend direction by monitoring price action relative to the G-Channel bounda
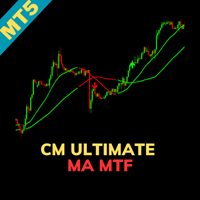
Indicator Name: CM_Ultimate_MA_MTF_V2 - Added Tilson T3 Overview: The CM_Ultimate_MA_MTF_V2 is a powerful moving average indicator that offers a high degree of customization and flexibility for traders. It supports multiple types of moving averages, including the advanced Tilson T3, and provides features such as multi-timeframe analysis, cross detection, and visual highlights. Key Features: Multi-Timeframe Flexibility: The indicator defaults to the current timeframe on the chart but allows users
The Day Trading Price Pattern indicator is an indicator of entry points that searches for and displays Price Action system patterns on dozens of trading instruments and on all standard time frames: (m1, m5, m15, m30, H1, H4, D1, Wk, Mn). Show all the main Price Patterns are introduced in the Ebook Day Trading With Price Action - Galen Wood You won't never miss any potential trading setup.
Want to send all the signals to your Telegram Channel? Checkout this guide
Advantages
1. Patterns: Tre
FREE

Enhance Your Trading with Buraq Bars Indicator! Take your trading to the next level with Buraq Bars ! This easy-to-use indicator draws bars on your chart whenever the RSI (Relative Strength Index) crosses above or below the levels you choose, giving you clear signals to help you trade better. Key Features: Set Your Own RSI Levels: Choose the levels for overbought and oversold that work best for you. Clear Visual Signals: Bars appear on your chart when the RSI crosses your levels, making it easy

The SMC ICT Indicator integrates the key concepts of Smart Money Concepts and Inner Circle Trader into a practical and precise tool.
It displays essential levels and patterns on the chart for clear analysis according to the ICT approach.
Optimized for agile processing, it allows smooth backtesting with no repainting, freezes, or delays—ensuring precision and efficiency in your trading. Take advantage now! For a limited time, get over 20% off your purchase.
Included Concepts It includes Fair Va

Индикатор Haiken Ashi для MT5 Улучшите свой торговый анализ с помощью индикатора Haiken Ashi для MT5. Этот мощный инструмент преобразует стандартные ценовые данные в более плавные, трендовые свечи, что упрощает идентификацию рыночных тенденций и потенциальных точек разворота. Ключевые особенности: Четкая идентификация тренда: Визуально различайте восходящие и нисходящие тренды по различным цветам свечей. Снижение шума: Фильтруйте ценовые колебания, обеспечивая более четкое представление об осно
FREE
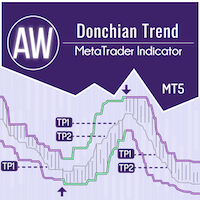
AW Donchian Trend - это трендовый индикатор, основанный на канале Дончиана. Индикатор умеет рассчитывать уровни TakeProfit и StopLoss, имеет продвинутую статистику успешности сигналов, а также три типа уведомлений о полученном сигнале. Гайд по настройке и инструкция - Здесь / MT4 Версия - Здесь Как торговать с индикатором: Торговля с AW Donchian Trend всего три простых шага: Шаг 1 - Открытие позиции Получен сигнал на покупку при рейтинге успешности больше 70% на таймфрейме M15, проверяем на

Обзор SwingVolumePro — это продвинутый и универсальный индикатор, разработанный для применения к широкому спектру финансовых активов и поддержки различных стилей торговли. Разработанный на основе строгого анализа объема и цены, он предлагает четкие и точные сигналы, которые позволяют трейдерам любого уровня принимать обоснованные решения на основе высококачественных данных.
SwingVolumePro.PDF
Основные характеристики Универсальность: SwingVolumePro может применяться к различным ак

Индикатор Индекса Силы Валюты (Currency Strength Index - CSI) ПЕРЕД АКТИВАЦИЕЙ ИНДИКАТОРА НЕ ЗАБУДЬТЕ УСТАНОВИТЬ "TRUE" ДЛЯ ОТОБРАЖЕНИЯ ПАР Индикатор Индекса Силы Валюты (Currency Strength Index - CSI) — это мощный инструмент, используемый в торговле на Форекс для измерения относительной силы основных валют. Этот индикатор помогает трейдерам определить самые сильные и слабые валюты в любой момент времени, что позволяет принимать более обоснованные торговые решения. Основные характеристики: Сравн

«Индикатор Ultimate Bot Alerts — это мощный инструмент для MetaTrader 5, который помогает трейдерам определять потенциальные точки входа и выхода на рынке. Этот индикатор использует сложный алгоритм, основанный на среднем истинном диапазоне (ATR) и ценовом действии, для генерации сигналов на покупку и продажу.
Когда вы примените индикатор Ultimate Bot Alerts к своему графику, вы увидите зеленые стрелки для сигналов покупки и красные стрелки для сигналов продажи. Эти сигналы появляются прямо на

SuperTrend — это один из самых эффективных и широко используемых технических индикаторов в трейдинге, идеально подходящий для определения направления тренда и генерации сигналов входа и выхода. Этот индикатор основан на волатильности и тренде, динамически адаптируется к рыночным условиям, обеспечивая трейдеров ясной визуальной информацией. Основные характеристики: Обнаружение тренда: SuperTrend следует за рыночным трендом, рисуя линию, которая располагается выше цены в нисходящем тренде и ниже в

Благодаря техническим и логическим манипуляциям брокерской компании, я прошел долгий путь, чтобы вывести этот индикатор, который объединяет многочисленные стратегии, обладающие следующими возможностями:
Определение рыночного тренда: понимание общего тренда рынка.
Точки разворота: определение потенциальных точек, в которых рынок может изменить направление.
Точки входа и выхода: определение оптимального времени для входа и выхода из сделок.
Для полного понимания того, как использовать этот ин
Идеально разработанный для трейдеров, которые ценят ясность, точность и удобство использования, этот передовой индикатор Renko предоставляет всё необходимое для улучшения вашей торговой стратегии. В отличие от традиционных генераторов, создающих оффлайн-графики, этот индикатор отображает Renko-графики в реальном времени прямо на вашей торговой платформе. Индикатор Live Renko также беспрепятственно работает на Synthetic Indices, таких как Volatility 75, Step Index, Boom и Crash.

Комплекс индикаторов распознающих разворотные моменты. Обнаруживает вершины и впадины по комбинациям свечей после их вычета из двух MA. Применим для торговых систем при использовании ранних входов. Можно использовать по тренду для скальпинга и внутри дневной торговли, так и для обнаружения разворотов тренда на ранних стадиях.
Возможности
Параметры предоставляют гибкую настройку для любых тайм-фреймов и торговых инструментов. Имеется несколько типов оповещений для сигналов. Желтая стрелка - си

DTFX Algo Zones are auto-generated Fibonacci Retracements based on market structure shifts.
These retracement levels are intended to be used as support and resistance levels to look for price to bounce off of to confirm direction.
USAGE Figure 1 Due to the retracement levels only being generated from identified market structure shifts, the retracements are confined to only draw from areas considered more important due to the technical Break of Structure (BOS) or Change of Character (CHo

Order block hunter indicator is the best indicator for hunt the order blocks that area where there has been a large concentration of limit orders waiting to be executed Order blocks are identified on a chart by observing previous price action and looking for areas where the price experienced significant movement or sudden changes in direction .This indicator does that for you by using very complicated codes and helps you to take the best areas To buy and sell because it make marks at the best a

The Market Structure Analyzer is a powerful tool designed for traders who follow market structure and smart money concepts. This comprehensive indicator provides a suite of features to assist in identifying key market levels, potential entry points, and areas of liquidity. Here's what it offers:
1. Swing High/Low Detection : Accurately identifies and marks swing highs and lows, providing a clear view of market structure.
2. Dynamic Supply and Demand Zones: Draws precise supply and demand zone

Introducing the Volume Order Blocks indicator, a game-changing tool designed for traders who demand precision and clarity in their market analysis. This advanced indicator not only identifies order blocks but also integrates crucial volumetric data, allowing you to gauge the strength of these blocks with unparalleled accuracy. MT4 version - https://www.mql5.com/en/market/product/121237/ Key Features of the Volume Order Blocks: Bullish & Bearish Order Blocks: Easily visualize and differentiat

Maximize Your Trading Opportunities with the "Auto Trendlines" Indicator Discover the "Auto Trendlines" Indicator: "Auto Trendlines" is the essential tool for every technical trader. This indicator automatically plots trend lines, pinpointing support and resistance levels with surgical precision. It's ideal for those looking to capitalize on market breakouts and reversals. Key Features: Automatic Trendline Plotting: Identifies and draws crucial trend lines without manual intervention. Advanced C

In the world of trading, the key to success lies in having the right tools at the right time. Our innovative Volume Profile indicator was developed with one goal in mind: to provide traders with unprecedented access to vital market activity information. This cutting-edge tool allows you to not only see where and when volumes are traded but also to understand market depth with clarity never seen before. Main Features: Temporal Flexibility: Set the analysis range up to 1800 minutes to perfectly ma

Optimize Your Trading Decisions with the "autoFibo" Indicator Discover the "autoFibo" Indicator: "autoFibo" is the essential analysis tool for traders who want to fully leverage Fibonacci levels without the hassle of manual plotting. This indicator automates the Fibonacci retracement process, providing instant visual access to key support and resistance zones. Key Features: Automatic Fibonacci Retracement: Automatically plots Fibonacci levels, making it easy to identify support and resistance zo

Enhance Your Trading Performance with the "Better Volume" Indicator Discover the "Better Volume" Indicator: The "Better Volume" is the essential market volume analysis tool for traders aiming to stand out. It analyzes tick volumes with unprecedented accuracy, featuring an advanced moving average function (PERIOD_MA) and customizable buy and sell alerts. Key Features: Advanced Volume Analysis: Recognize volume peaks signaling crucial price movements. Intuitive Buy and Sell Alerts: Stay one step a
Enhance Your Trading Strategies with the "Order Block" Indicator for MT4 Discover the "Order Block" Indicator: The "Order Block" Indicator for MT4 is designed to help you precisely identify order blocks in the market by marking the highs and lows of the order block candles. This powerful tool enables you to understand where large institutions place their orders, improving your ability to predict market movements. Key Features: Precise Order Block Detection: Automatically highlights the highs and

Channel Vertex is a price action pattern formed by price Chanel and a triangle pattern . Price channels basically indicates possible support and resistance zones around a price movement and retracement or breakout at these levels can indicate possible trend continuation or reversal .
Majority of the times price fluctuations forms triangle patterns defined by 3 vertexes , these triangle patterns most times defines a trend continuation. A triangle pattern is a trend continuation pattern that

CONGESTION BREAKOUT PRO
This indicator scans the breakout of congestion zones . This indicator unlike any other congestion indicator you will find in the market right now, it uses an advanced algorithm not peculiar to most traditional congestion indicators available today . The advanced algorithm used to define the congestions is greatly responsible for the high rate real congestion zones and low rate fake congestion zones spotted by this product.
UNDERSTANDING CONGESTION
Congestion are ar
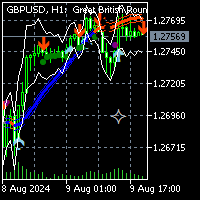
To get access to MT4 version please click here . This is the exact conversion from TradingView: " SSL Hybrid" by Mihkel00.
This is a light-load processing and non-repaint indicator. All input options are available. Buffers are available for processing in EAs. You can message in private chat for further information/changes you need. Thanks for downloading
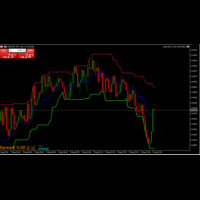
The Donchian Channel Indicator I created is a powerful tool for analyzing price trends and volatility. By plotting the highest high and lowest low over a specified period, it helps identify potential breakout opportunities and trend reversals. This indicator is valuable for traders seeking to understand market dynamics and make informed decisions based on price movements. Its simplicity and effectiveness make it an essential addition to any trading strategy.
FREE
Darvas Flow Indicator is a revolutionary trading indicator that combines the classic Darvas Box method with modern market flow analysis. Developed for serious traders, Darvas Flow offers a powerful and intuitive tool for identifying trading opportunities. Key Features:
Darvas Box Method Implementation: Darvas Flow automatically identifies Darvas boxes, allowing you to see crucial support and resistance levels. This helps in pinpointing optimal entry and exit points in your trades. Dynamic Flow
FREE

Adaptive Volatility Range [AVR] - это мощнейший инструмент для определения ключевых разворотов тренда. AVR - с точностью отображает Средний Истинный Диапазон волатильности с учетом Средневзвешенной по объему цены .Индикатор позволяет адаптироваться абсолютно под любую волатильность рынка,путем расчета средней волатильности за определенный период времени -это обеспечивает устойчивый показатель положительных сделок. Благодаря этому Adaptive Volatility Range - имеет высокий Winrate

This indicator identifies and highlights market inefficiencies, known as Fair Value Gaps (FVG), on price charts. Using a custom algorithm, the indicator detects these areas of imbalance where the price moves sharply, creating potential trading opportunities. Indicator Parameters: Bullish FVG Color (clrBlue) : Color used to highlight bullish inefficiencies. The default value is blue. Bearish FVG Color (clrRed) : Color used to highlight bearish inefficiencies. The default value is red. Bullish FVG
FREE

Overview: The US Dollar Index (DXY) is a key financial indicator that measures the strength of the US Dollar against a basket of six major world currencies. This index is crucial for traders and investors as it provides a comprehensive view of the overall market sentiment towards the US Dollar and its relative performance. All Products | Contact Composition: The DXY's composition is as follows: Euro (EUR): 57.6% Japanese Yen (JPY): 13.6% British Pound (GBP): 11.9% Canadian Dollar (CAD): 9.1%
FREE

Breakthrough signal indicator for the MT5 platform: Your reliable assistant in the world of trading!
We are pleased to present you with an innovative signal indicator, which was created in collaboration with an outstanding mathematician. This indicator combines advanced algorithms and the best of the world of mathematical analysis, providing traders with a unique tool for predicting market movements.
Why is this indicator unique?
1 .Entry signals without redrawing If a signal appears, it sta

Session Box Indicator for MetaTrader 5
Description: The SessionBox indicator is designed to visually represent the trading sessions on a chart, specifically the Asian, European, and American sessions. This indicator draws customizable rectangles around each session, allowing traders to easily identify different trading periods. It also includes labels to denote each session, enhancing clarity.
Users only need to input the session start and end hours in their server time. Please note, the Asia
FREE
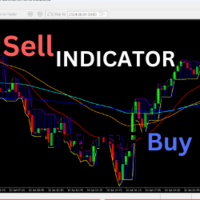
Welcome to a highly versatile and customizable trading indicator designed to elevate your trading strategy. This indicator integrates four moving averages (MAs) and order blocks, providing you with a powerful tool for market analysis and decision-making. Key Features: Four Moving Averages (MAs): This indicator allows you to utilize up to four different moving averages simultaneously. You can adjust each MA's period, color, and style to tailor the indicator to your specific trading needs. Whether
FREE
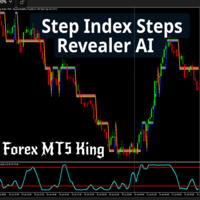
Unlock precision in your trading with the Step Index Steps Revealer AI . This advanced MT5 indicator is your ultimate tool for identifying key price levels on major forex pairs, including GBP/USD, EUR/USD, and others, as well as the step index
Key Features 1. Accurate Price Level Identification Plots precise key levels on major forex pairs like GBP/USD, EUR/USD, USD/JPY, and more. Ideal for traders looking to capitalize on bounce backs and breakouts with accuracy. 2. Optimized for Step Index Ch

O indicador media colors se baseia num canal que pode ser criado a partir de duas médias Media colors é um indicador de tendência utilizado no trading para identificar a direção predominante do mercado. Pode ser baseado na Média Móvel Simples (SMA) e na Média Móvel Exponencial (EMA) que dá mais peso aos preços mais recentes, tornando-a mais sensível às mudanças de preço. Como Funciona: Cálculo: A EMA é calculada aplicando um fator de suavização aos preços de fechamento de um ativo financeir

O Indicador identifica relação do Índice com a soma dos principais ativos, funciona para qualquer mercado do mund o, possui um oscilador WPR com a soma dos principais ativos escolhidos, indicando a antecipação do movimento em relação ao Índice. Características WPR com a soma dos papéis escolhidos - branco WPR do papel atual - vermelho Canal de Tendência O indicador pode indicar movimento de entradas, sendo: cruzamento das linhas cruzamento da linha Multi Symbols no -50 cruzamento entre os canai
FREE

MT5用 サブウィンドウにスプレッドとBUY SWAP(BS)とSELL SWAP(SS)を表示するインジケーターです。
表示の文字フォントの大きさと色の設定、スプレッドの表示をPIPS表示もしくはPOINTS表示切替が可能ですので、チャートの色設定などに合わせて、お好みでご利用いただけます。 サブウィンドウの表示サイズに合わせて、その中央に表示するようになっています。
(ご協力お願いします!) こちらは無料でご利用いただけます。どうぞご自由にご利用ください。 もしよければ MS High Low indicator も紹介していますので、どうぞご参照の上、DEMO版のダウンロードをお試しください!
Happy Trading :)
FREE

Elder Impulse Indicator Overview: The Elder Impulse Indicator is a powerful tool designed for traders who want to combine the strengths of trend-following and momentum strategies. Developed by Dr. Alexander Elder, this indicator helps traders identify potential entry and exit points by analyzing both price direction and momentum. It’s an essential tool for making informed decisions in various market conditions, whether you're trend-trading, swing trading, or looking for momentum shifts. Key Fea
O delta volume é uma ferramenta poderosa utilizada em várias estratégias de operação, especialmente no trading de futuros, ações e criptomoedas. Aqui estão algumas das principais estratégias onde o delta volume é frequentemente aplicado: Identificação de Tendências : O delta volume ajuda a identificar a direção da tendência predominante, mostrando se há mais pressão de compra ou venda. Isso pode ser útil para confirmar a força de uma tendência ou identificar possíveis reversões. Confirmação de B

The MS High Low Lines indicator is a tool designed to enhance trend visualization for MT5. It displays high and low prices as lines, using your preferred Moving Average (MA) settings (either SMA or EMA, with customizable periods). The indicator shows configured signals when prices break above or below these MAs. By setting it up with highly functional MAs, traders can better understand market trends and make trades with a statistical edge. You can modify settings and place multiple indicators o

VolaMetrics VSA | Мощный союзник в техническом анализе VolaMetrics VSA — это индикатор технического анализа, который сочетает в себе методологию Volume Spread Analysis (VSA) с детализированным анализом объема торгов . Он предназначен для идентификации и отслеживания значительных движений цен , используя взаимодействие между объемом и спредом цен , чтобы предоставлять ценные инсайты, которые могут помочь в принятии торговых решений. Основы Volume Spread Analysis (VSA) Volume Spread Analysis

Introducing the BOOM CRASH MASTER Indicator: Unleash the Power of Precision Trading! Step into the world of unparalleled trading with the BOOM CRASH Master Indicator, exclusively designed for the Boom and Crash indices offered by Deriv broker. This cutting-edge tool is your gateway to mastering the art of spike detection and anti-spike entries, ensuring you stay ahead of the market’s every move. Recommendations: Symbols: Any Boom or Crash Index
Timeframe: 1 minute / 5 minutes
Stop Loss: Recent
You can use the indicator in trend following to detect trend changes. Each color change is a trading signal. It should be used on at least 1 hour charts. It is recommended to use it on 1-day charts. However, it should be noted that the number of meaningful candles (without gap) on your chart should be at least 80.
The calculation method is based on ATR, MA and CCI indicators. However, for a significant part of the calculation I have developed my own algorithm based on standard deviation and re

Fractals Aydmaxx 2024 Обзор: Fractals Aydmaxx 2024 – это пользовательский индикатор, разработанный для торговой платформы MQL5, созданный Aydmaxx. Этот индикатор определяет и отображает фрактальные модели на вашем торговом графике, что важно для распознавания потенциальных разворотов рынка. Индикатор выделяет как бычьи, так и медвежьи фракталы, что облегчает трейдерам обнаружение ключевых уровней поддержки и сопротивления. Особенности: Настраиваемые фракталы: Позволяет пользователю установить ко
FREE
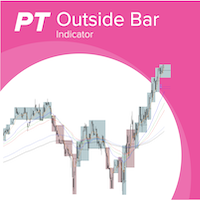
Outside bars (Außenstäbe) are important in professional price action trading and were made popular by Michael Voigt. Highs and lows of outside bars ( Aussenstäbe ) can be utilized as entry and exit for trades following different strategies. With combining different timeframes you can more easily detect the overall trend of the market, see potential resistance and support levels and also detect change in trend and framing of the market. Examples for strategies with inside bars (Innenstäbe) an

Average Session Range: Calculate and Average the Sessions High-Low Range of Specific Time Sessions Over Multiple Days. The Session Average Range is a sophisticated and precise tool designed to calculate the volatility of specific time sessions within the trading day. By meticulously analyzing the range between the high and low prices of a defined trading session over multiple days, this tool provides traders with a clear and actionable average range. **Note:** When the trading platform is closed
FREE
The VSA Scanner Dashboard is a multi-symbol, multi-timeframe scanner that displays VSA signals. It is based on the Volume Plus and VSA Signals indicator. Features Displays the VSA signal of the last closed candle. Monitors 28 customizable instruments (symbols) and up to 21 timeframes at the same time. Easily arrange symbols in any order. Each signal has a tooltip that displays the name and time of appearance. Click on each signal to open a new chart. All types of alerts (sound, pop-up, email,
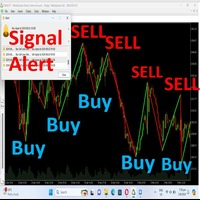
Hello Traders, *-For your bonus one indicator with SL,TP zone* just give your review, comment.Once finish developing I will give you**** Trend identification Indicator This is a indicator that will identify trend zone as bearish and bullish zone . This indicator can use for all pairs and any timeframe you can use it . *Green lime mean buy.Red line mean sell.You will receive alert sound when signal generate. The create best on high, low point and moving average calculation. You can customize valu

This indicator/dashboard , is place on a single symbol. It shows the percentage of movement withing all time frames from M1 to W1.The text will change green if all % are in the positive for a buy signal.The text will change red if all % are below zero and in negative for a sell signal. There are audible notifications, as well as on screen notifications along with push notifications that can be turned on and ON/OFF in the settings.
This is a sure way to Find trends quickly and efficiently, with
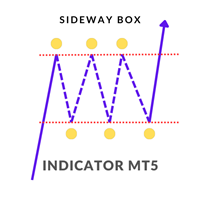
Sideway Box Indicator
The Sideway Box Indicator is an advanced trading tool designed to help traders identify and capitalize on sideways market conditions. This powerful indicator detects periods when the market is in a sideways (ranging) phase, providing traders with clear visual cues. Key Features
Sideways Market Detection : The Sideway Box Indicator accurately identifies sideways market conditions, allowing traders to recognize when the price is consolidating within a specific range. Buy/Sel

This MQL5 Speed Indicator script calculates the average speed of price movements for a selected financial instrument over a specified period. It uses the arithmetic mean to determine the average speed, which is computed by dividing the distance (change in price) by the time interval. The indicator then displays this value as a histogram in a separate window. Average Speed Calculation : The speed is calculated using the formula v = d t v = \frac{d}{t} v = t d , where d d d is the price differen
The "Order Block Indicator for MetaTrader 5" is an advanced trading tool designed to help traders identify key order block zones in the financial markets. Order blocks are areas of institutional buying and selling, often marking significant price levels where market reversals or continuations are likely to occur. This indicator provides a visual representation of these zones directly on the chart, enabling traders to make more informed trading decisions. Key Features: Accurate Order Block Identi
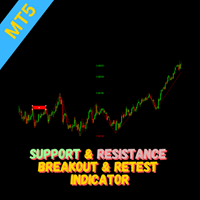
Overview The Breakout and Retest indicator is designed to identify potential trading opportunities by detecting price breakouts from significant support and resistance levels followed by a retest of the broken level. How it Works The indicator analyzes price data to determine key support and resistance areas. When the price decisively breaks through one of these levels and then retest it, then a potential breakout is signaled when it breakout again. To increase the probability of a successful t

Price and Spread Indicator
Version: 1.0 Developer: Creative Tech Solutions Website: https://www.creativetechsolutions.co.uk
Overview The Price and Spread Indicator is a great tool for MetaTrader 5 that displays the Ask and Bid prices along with the spread directly on the chart. This indicator provides real-time updates and allows traders to make informed decisions based on accurate price information.
Features - Real-time Price Updates: Continuously updates Ask and Bid prices. - Spread Disp
FREE
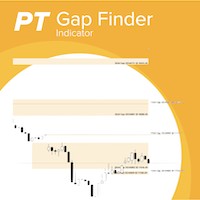
With the gaps finder indicator gaps between trading session are automatically added to you chart and you will never miss a gap which you can use in your trading strategies. Gaps often act as a magnet where the markets returns to or when a gap is closed often constitutes a reversal point.You don't have to draw manually gaps anymore. Key Features: Support for multiple trading sessions in a single chart, e.g market session and future session Configurable number of days to look back for gaps Highly

AtBot: Как это работает и как его использовать ### Как это работает Индикатор "AtBot" для платформы MT5 генерирует сигналы на покупку и продажу, используя комбинацию инструментов технического анализа. Он интегрирует простую скользящую среднюю (SMA), экспоненциальную скользящую среднюю (EMA) и индекс средней истинной амплитуды (ATR) для выявления торговых возможностей. Кроме того, он может использовать свечи Heikin Ashi для повышения точности сигналов. Оставьте отзыв после покупки и получите спе
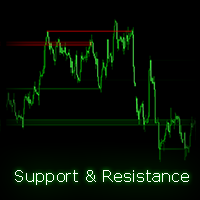
Автоматически находит и отображает каналы поддержки и сопротивления (S/R) на вашем графике, что облегчает идентификацию ключевых уровней. Индикатор поддерживает несколько таймфреймов, позволяя отображать каналы из разных таймфреймов на вашем текущем графике. Кроме того, он предлагает прозрачные цвета для улучшенной визуальной ясности и позволяет настроить цвета каналов по вашему усмотрению. Как работает этот индикатор? Индикатор находит точки разворота (highs и lows) в пределах диапазона, опреде
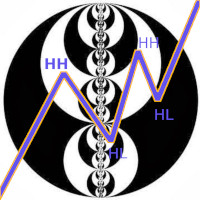
Индикатор структуры рынка на текущем таймфрейме находит: 1. Тенденцию (восходящие и нисходящие волны). Смена направления волны происходит после перебоя экстремума (снятия ликвидности с противоположной стороны). Отрисовка тенденции происходит с учетом внешних баров (на одном внешнем баре может быть 2 экстремума). Тенденция может отрисовываться с учетом минимального количества баров в волне (2 и более). Настраивается параметром QTY_bars_for_wave 2. BoS – слом структуры, обновление структурных ми

Финансовый Индикатор SolarTrade Suite: Jupiter Market Indicator - Ваш Надежный Проводник в Мире Финансовых Рынков!
Это трендовый индикатор, который использует особые инновационные и передовые алгоритмы для рассчета своего значения, а также имеет приятный глазу дизайн.
Понять показания этого индикатора очень просто: синий цвет - покупка, красный продажа.
Проверьте другие наши продукты из серии SolarTrade Suite внизу описания.
Хотите уверенно ориентироваться в мире инвестиций и финансовых рын

Финансовый Индикатор SolarTrade Suite: Saturn Market Indicator - Ваш Надежный Проводник в Мире Финансовых Рынков!
Это индикатор ценового канала, который использует особые инновационные и передовые алгоритмы для рассчета своего значения, а также имеет приятный глазу дизайн.
Понять показания этого индикатора очень просто: торгуйте от границ как на прорыв так и на отскок.
Проверьте другие наши продукты из серии SolarTrade Suite внизу описания.
Хотите уверенно ориентироваться в мире инвестиций

Финансовый Индикатор SolarTrade Suite: Uranus Market Indicator - Ваш Надежный Проводник в Мире Финансовых Рынков! В нашу компьютерную программу для форекса встроен мощный искусственный интеллект, который анализирует рыночные данные в реальном времени. Он точно прогнозирует изменения цен, помогая принимать обоснованные торговые решения. Благодаря продвинутым алгоритмам, наш индикатор оптимизирует стратегии и минимизирует риски для трейдеров. Это две скользящие средние, которые используют особые

Финансовый Индикатор SolarTrade Suite: Neptune Market Indicator - Ваш Надежный Проводник в Мире Финансовых Рынков! В нашу компьютерную программу для форекса встроен мощный искусственный интеллект, который анализирует рыночные данные в реальном времени. Он точно прогнозирует изменения цен, помогая принимать обоснованные торговые решения. Благодаря продвинутым алгоритмам, наш индикатор оптимизирует стратегии и минимизирует риски для трейдеров. Это шесть скользящих средних, которые используют особ

Финансовый Индикатор SolarTrade Suite: Venus Market Indicator - Ваш Надежный Проводник в Мире Финансовых Рынков! В нашу компьютерную программу для форекса встроен мощный искусственный интеллект, который анализирует рыночные данные в реальном времени. Он точно прогнозирует изменения цен, помогая принимать обоснованные торговые решения. Благодаря продвинутым алгоритмам, наш индикатор оптимизирует стратегии и минимизирует риски для трейдеров. Это осциллятор, который использует особые инновационные

Финансовый Индикатор SolarTrade Suite: Mars Market Indicator - Ваш Надежный Проводник в Мире Финансовых Рынков! В нашу компьютерную программу для форекса встроен мощный искусственный интеллект, который анализирует рыночные данные в реальном времени. Он точно прогнозирует изменения цен, помогая принимать обоснованные торговые решения. Благодаря продвинутым алгоритмам, наш индикатор оптимизирует стратегии и минимизирует риски для трейдеров.
Это осциллятор, который использует особые инновационные
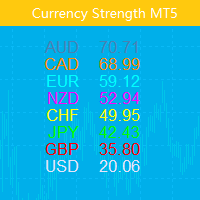
Этот индикатор показывает относительную силу 8 основных валют: USD, EUR, GBP, AUD, NZD, CAD, CHF и JPY. Значение прочности нормировано на диапазон 0-100: Значение выше 60 означает сильный. Значение ниже 40 означает слабость.
Входы Only Show Current Pair - если это правда, отображается только пара текущего графика, в противном случае отображаются все 8 кривых. Bars To Show – количество баров для отображения кривой силы. Ma Periods To Smooth Curves — периоды скользящей средней для сг
MetaTrader Маркет предлагает каждому разработчику торговых программ простую и удобную площадку для их продажи.
Мы поможем вам с оформлением и подскажем, как подготовить описание продукта для Маркета. Все продаваемые через Маркет программы защищаются дополнительным шифрованием и могут запускаться только на компьютере покупателя. Незаконное копирование исключено.
Вы упускаете торговые возможности:
- Бесплатные приложения для трейдинга
- 8 000+ сигналов для копирования
- Экономические новости для анализа финансовых рынков
Регистрация
Вход
Если у вас нет учетной записи, зарегистрируйтесь
Для авторизации и пользования сайтом MQL5.com необходимо разрешить использование файлов Сookie.
Пожалуйста, включите в вашем браузере данную настройку, иначе вы не сможете авторизоваться.