Guarda i video tutorial del Market su YouTube
Come acquistare un Robot di Trading o un indicatore
Esegui il tuo EA
hosting virtuale
hosting virtuale
Prova un indicatore/robot di trading prima di acquistarlo
Vuoi guadagnare nel Market?
Come presentare un prodotto per venderlo con successo
Indicatori tecnici per MetaTrader 5 - 97
Title: MACD Signals Discover the MACD Signals indicator – your reliable assistant in the world of trading! Description: The "MACD Signals" indicator is designed to make your trading more successful and efficient. It displays signals on the main chart as bright vertical lines that are easy to spot. You can customize the color and thickness of these lines to perfectly match your style and preferences. Features: Signals: Vertical lines on the main chart that stand out among other elements.

L'indicatore per MT5 Currency Strength Inspector (CSI) misura e visualizza in modo intuitivo la forza relativa delle singole valute. Viene valutato l'interesse dei grossi investitori sulle principali valute del mercato forex (specificatamente AUD, CAD, CHF, EUR, GBP, JPY, NZD, e USD), considerandone gli andamenti rispetto a tutte le altre nello stesso paniere. Si aiuta in questo modo il trader ad avere una visione globale del mercato e del "sentimento" sottostante, come pure a identificare le m

Support & Resistance Auto Plot Lines Indicator for MT5 – Perfect for Scalping! Make your trading easier with our Support & Resistance Auto Plot Lines indicator for MT5. This powerful tool automatically detects key support and resistance levels on your chart, helping you make better trading decisions with minimal effort. Why Choose This Indicator? Perfect for Scalping – Quickly identify strong price zones for fast, precise entries and exits.
Automatic Level Detection – No need to manually dra

AVVISO IMPORTANTE – LICENZA E ATTIVAZIONE RICHIESTE Istruzioni per l’Attivazione: Dopo aver completato l’acquisto, ti preghiamo di contattarci immediatamente per ricevere la tua chiave di licenza, password o dettagli di attivazione. Senza questi, il software non funzionerà. Siamo qui per garantire un processo di attivazione fluido e assisterti con qualsiasi domanda. Personalizzazione Multilingue
Per migliorare la tua esperienza di trading, offriamo una personalizzazione completa del soft
Nel dinamico mondo del trading, dove caos e schemi si intrecciano, Prime Breakout Convergence si erge come una bussola affidabile, guidandoti verso la fiducia in ogni decisione di trading e la stabilità del mercato. Questo non è solo un sistema manuale; è un assistente analitico intelligente in grado di decifrare tendenze di mercato profonde, trasformando letture complesse di indicatori in decisioni di trading chiare e attuabili. Perché scegliere Prime Breakout Convergence? Adattabilità: Utili

I am a trader specializing in the development of rare , exclusive , high-performance trading bots designed for serious traders who are committed to achieving consistent profitability and success. This free indicator is more than just a visual tool—it powers the Midnight Throttle EA , an automated trading system that executes trades based on the precise market conditions this indicator observes. Midnight Watch : A Pro-Level Tool for Precision Market Analysis. An advanced , multi-functional MetaTr

MURKA Levels PRO.
MURKA Levels PRO - is an indicator for MetaTrader 5, which displays High/Low, Open/Close, ATR levels (set manually) of the day, week, month on the chart. Marks round levels, signs the days of the week, numbers every week (you can set two types of round levels at the same time). ATH (All-time high) и ATL (All-time low). Levels are marked with price tags with a price symbol. Also, the indicator automatically calculates and displays on the chart the distance that the price has p
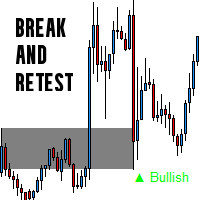
Break & Retest Indicator – Precision Market Structure Tool The Break and Retest Indicator is a powerful trading tool designed to help traders spot high-probability break-and-retest setups based purely on support and resistance levels . This indicator automatically identifies when price breaks a significant level and then retests it, providing clear bullish or bearish signals . Key Features: Automated Break & Retest Detection The indicator scans price action in real time to identify valid breakou

Probabilistic Price Predictor (QuantBreak Probability Suite) – The Bayesian Edge for Smarter Trading Unlock the Power of Probability in Market Forecasting. The Probabilistic Price Predictor is a revolutionary trading indicator that applies Bayes' Theorem to forecast breakout probabilities with mathematical precision. Instead of relying on traditional, rigid indicators, QuantBreak uses adaptive probability calculations to identify high-probability trade setups based on historical price action

Sonic R Indicator Description Overview The Sonic R Indicator for MT5 is designed to help traders analyze market trends using moving averages and volume analysis. This tool assists in identifying potential price movements by displaying trend zones and volume strength, making it suitable for various trading strategies. Key Features Dual EMA Trend Channels – Uses 34-period Exponential Moving Averages (EMA) to visualize price movement. Volume Analysis – A color-coded histogram to indicate changes i

If you are looking for precision in identifying strategic tops and bottoms, the ZigZag SMC/SMT Indicator for MT5 is the tool that will contribute to your technical analysis. Developed based on the advanced concepts of Smart Money Concepts (SMC) and Smart Money Trap (SMT), it offers an insight into market behavior, helping you make decisions.
What will you find in this indicator? Automatic identification of strategic tops and bottoms Based on institutional strategies Ideal for analyzing liqu
Unlock Institutional Trading Insights with Our Advanced Supply & Demand Zone Indicator Harness the power of institutional trading strategies with our cutting-edge Supply & Demand Zone Indicator —a game-changing tool designed to pinpoint high-probability entry and exit points in any financial market. By identifying where institutional buyers and sellers are positioned, this indicator gives you the edge to trade alongside the pros and capitalize on major market reversals. Why This Indicator Is

L'indicatore UzFx-Total TP'SL & Timer-MT5 è progettato per fornire un monitoraggio in tempo reale dei valori totali di Take Profit (TP) e Stop Loss (SL) in tutte le operazioni aperte e in sospeso. Inoltre, include un timer per il conto alla rovescia delle candele che indica il tempo rimanente per la chiusura della candela corrente.
(Visitate il profilo e controllate tutti gli altri prodotti MT4/MT5) (Non dimenticate di dare una recensione)
Caratteristiche principali:
Calcola automaticame

Currency Strength Indicator - Track Market Power
Overview: Gain a competitive edge with the Currency Strength Indicator for MetaTrader 5. This intuitive tool measures the relative strength of 8 major currencies and displays them in a clear, sortable table directly on your chart. Perfect for forex traders looking to identify strong and weak currencies at a glance. Key Features: Dynamic Strength Table: Displays real-time strength for EUR, USD, GBP, JPY, CHF, AUD, CAD, and NZD in the upper-left c
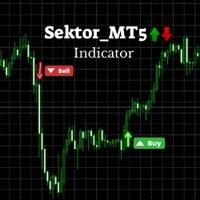
SektorMT5 - Advanced Trading Indicator Specification Automated Buy/Sell Signal Indicator for Meta Trader 5 (MT5)
Setting Description Recommended Value Timeframe (TF) The recommended chart timeframe for optimal signal accuracy. H1 (1 Hour) Symbol The financial instrument on which the indicator works best. XAUUSD (Gold) Lookback Period Number of candles used to determine breakout levels. 24 Candles (Adjustable) Buy Signal Green upward arrow appears when price breaks above resistance. Displayed on

BVP - Scanner Avanzato del Mercato Compratore/Venditore
Sperimenta il sentiment del mercato in tempo reale su più timeframe con il BVP (Pannello Compratore/Venditore) - uno strumento sofisticato di analisi di mercato progettato per i trader moderni. Perché BVP?
Nei mercati dinamici di oggi, comprendere la dominanza di compratori e venditori è cruciale. BVP fornisce un feedback visivo istantaneo su 12 timeframe, da M1 a D1, aiutandoti a individuare i cambiamenti del mercato prima che diventino ev
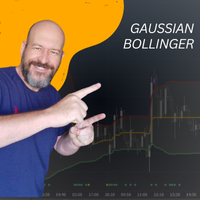
Gaussian Bollinger Bands with Gaussian Moving Average ️ Transform your trading strategy with an innovative indicator that blends the power of Advanced Mathematics with the practical efficiency of technical analysis! ️ Whether you're a beginner or an experienced trader, the Gaussian Bollinger Bands is the perfect solution for those looking to take their market analysis to the next level . This unique indicator replaces the traditional moving average with the Gaussian Moving Average (GMA

This is an indicator to determine when to sell or buy, and it can be combined with other indicators, such as the SND indicator that I also sell. This indicator is very suitable for BTC, XAU, and NAS100. This is an indicator for MT5. It is highly battle-proven if studied properly. Please consult [email protected] before using it. This product is very suitable for XAU, BTC, and NAS100. This product is very limited It is only sold on Gogo Jungle and MQL5.

Nel mondo del trading, dove ogni tick può essere l'inizio di una nuova storia, è fondamentale avere un alleato affidabile. TrendVarianceSpectrum non è solo un robot di trading; è la tua guida nei mercati volatili. Costruito con anni di esperienza e addestrato su oltre 25 anni di dati, combina l'eleganza della matematica con la potenza della tecnologia moderna. Vantaggi chiave di TrendVarianceSpectrum: Drawdown minimo: TrendVarianceSpectrum opera con drawdown significativamente bassi, rendendol

Smart Detector — I segreti dello Smart Money e dell'ICT nelle tue mani! Vuoi fare trading come i grandi player? Smart Detector ti apre le porte del mondo dello Smart Money e delle strategie Inner Circle Trader (ICT) . Questo indicatore per MetaTrader 5 identifica istantaneamente le zone chiave in cui i market maker lasciano le loro tracce: potenti order block e gap nascosti (Fair Value Gaps) . Scopri dove si nasconde la liquidità e sfruttala a tuo vantaggio! Smart Money: Segui le mosse delle ban
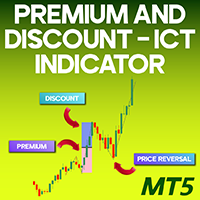
Premium and Discount PDA ICT Indicator for MT5 The Premium and Discount Indicator for MetaTrader 5 is a liquidity-based tool that tracks short-term market movements using a zigzag pattern. It highlights premium and discount zones, assisting traders in identifying optimal entry points and setting Take Profit (TP) and Stop Loss (SL) levels. This indicator is specifically designed to detect minor market shifts, placing a "D" at significant lows and a "P" at key highs. By clicking these markers, tra

TimeView Pro – Visualizzazione del Tempo con Precisione e Stile TimeView Pro è un indicatore avanzato progettato per mostrare l'ora locale direttamente sul grafico di MetaTrader 5. Ideale per i trader che necessitano di un riferimento visivo chiaro del tempo senza distrazioni. Caratteristiche principali Snap to Candle – La posizione del tempo si aggancia automaticamente alla candela più vicina (abilitato di default).
Tasto di attivazione rapida – Mostra o nasconde rapidamente l'orologio prem

JAJ Binary Pro is a precision-driven binary options strategy created by Jamaine Walkin , a full-time trader and investor. Designed for adaptability in Forex and OTC markets , it focuses on high-probability trade setups and disciplined risk management. Optimised for Pocket Option & MT5 , it reflects Jamaine’s structured approach to trading Options, ensuring consistency and confidence in execution.
Always use Proper Risk Management when trading.
Questo indicatore è pensato principalmente per il trading manuale. L'indicatore analizza gli ultimi movimenti dei prezzi. E li elabora utilizzando il proprio algoritmo. Sulla base di questa analisi, l'indicatore calcola i livelli di prezzo più importanti. Questi livelli dividono i valori dei prezzi in tre zone: acquisto, vendita e neutralità. Le nuove posizioni dovrebbero essere aperte solo se il prezzo si trova nella zona appropriata. Se il prezzo è nella zona neutrale, allora bisogna pensare
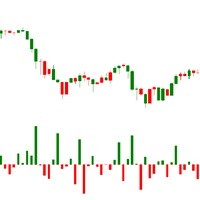
Volume Difference - The indicator is designed specifically to identify and confirm complex behavioral patterns in the market structure based on changes in tick volume. Unlike standard volume tools, Volume Difference focuses on the difference in volumes between bars.
The indicator is designed for use in complex trading models where the dynamics of volume change are important, rather than absolute values.

PipHistogram is an essential tool for traders who want to gain insight into price distribution and concentration. Its customizable, visually appealing histogram allows you to pinpoint key levels and make more informed trading decisions. Enhance your market analysis and improve your trading strategy with PipHistogram —your shortcut to understanding price dynamics in MetaTrader 5. Overview : PipHistogram is a powerful indicator for MetaTrader 5 that visually displays the percentage distribu

The best and the only World Time Display for MT5
Features :
- JAPAN, LONDON & NEW YORK Time Display
- You can customize with different Font, Color And Text Size
- You can customize Box Position and Box Color to meet your satisfaction
- Only For Metatrader 5
- Customize GMT according to your Time Zone
- Simple To Use. Just Attach to your MT5
- No hidden code or no errors

Introduction to the Manual Backtesting Indicator on MQL5 The MetaTrader platform provides an excellent backtesting tool for evaluating Expert Advisors (EAs). However, when it comes to manually backtesting a strategy to assess its effectiveness, this tool has some limitations: You cannot manually draw zones or trend lines while in backtesting mode. You cannot switch timeframes to check time alignment. For example, if my strategy requires additional confirmation from a higher timeframe (HTF), this
Product Name : SII - Synthetic Indices Indicator
Overview :
The SII (Synthetic Indices Indicator) is a specialized trading tool designed to identify high-probability levels in synthetic indices using imbalances. By leveraging the concept of imbalances, SII provides traders with precise insights into potential market reversals and continuations, enhancing trading accuracy and decision-making.
Key Features
1. Imbalance Detection: SII automatically identifies and marks imbalances on the chart,

Candle Reversal , is designed to identify and highlight key candlestick patterns that signal potential trend reversals or continuations in the market. It focuses on two primary types of patterns: 3-Line Strike Patterns (Bullish and Bearish) Engulfing Patterns (Bullish and Bearish) The indicator provides visual cues (arrows and text labels) on the chart to help traders quickly identify these patterns, making it easier to make informed trading decisions. use with MACD or awesome oscilator to

Supertrend is a trend-following indicator based on Average True Range (ATR). The calculation of its single line combines trend detection and volatility. It can be used to detect changes in trend direction and to position stops. History The Supertrend indicator was created by Olivier Seban. Calculations To calculate bands of the Supertrend, use the following formulas: hl2 = (high + low) / 2 basicUpperBand = hl2 + (multiplier × ATR) basicLowerBand = hl2 - (multiplier × ATR) upperBand = basicUpper

PMax is a brand new indicator developed by KivancOzbilgic in earlier 2020. It's a combination of two trailing stop loss indicators; One is Anıl Özekşi's MOST (Moving Stop Loss) Indicator and the other one is well known ATR based SuperTrend. Both MOST and SuperTrend Indicators are very good at trend following systems but conversely their performance is not bright in sideways market conditions like most of the other indicators. PMax tries to solve this problem. PMax combines the powerful sides of

MATRIX Market Scanner
Comprehensive Analytics Without the Complexity Our innovative, cell-based dashboard gives you a panoramic view of the market—letting you monitor multiple instruments and timeframes seamlessly. Its high level of customization delivers an intuitive, dynamic display that adapts to your trading style, empowering you to see the bigger picture and make smarter, faster decisions. New Update The latest update to the Indicator Matrix Market Scanner introduces a powerful new feature

"Unlock deeper market insights with our advanced MQL5 Volume Indicator! This tool combines real-time volume data with an EMA25 overlay, highlighting key zones where volume surges at least 1.5 times above the EMA25—perfect for spotting high-impact trends. Customize colors and opacity effortlessly to suit your style. Plus, streamline your charts by disabling MT5’s default volume display: simply go to the chart settings, uncheck the built-in volume option, and let our indicator take the lead. Prec

A powerful trend-following tool that uses ATR-based volatility to identify market trends across multiple timeframes . This enhanced version allows you to overlay the SuperTrend of a higher timeframe directly on your current chart, helping you align your trades with the dominant trend. How It Works The indicator calculates dynamic support and resistance levels using Average True Range (ATR) : Upper Band = Source Price + (Multiplier × ATR) Lower Band = Source Price - (Multiplier × ATR) In an uptre
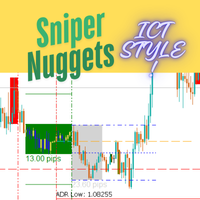
!!!!!!!! Sniper Nuggets !!!!!!!!
Sniper Nuggets is an all-in-one indicator for many things ICT style. It includes the following functionalities: Custom periods : which allow you to set custom daily period start and end times according to your taste. ADR Markers: which plots the average daily range. Worktime: which plots the various boxes on the chart for Asia range (including its high, low and midpoints, standard deviation predictions ), London open, New York open, CME open and London close.

### Introducing the Price Action Ultimate Suite – The Ultimate Trading Tool for Professional Traders!
Are you searching for a powerful tool to elevate your Price Action trading strategy? Look no further than the **Price Action Ultimate Suite** – a comprehensive and intelligent indicator for MetaTrader 5 (MT5) – designed to be your trusted partner in conquering the financial markets! Packed with advanced features and user-friendly functionality, this indicator helps you identify key price patte
Hello, traders! Welcome to the introduction of Multi Timeframe Analyzer v1.0 ! ( MT5 )
This is the Meta Trader 5 version of the "Market Meeter". Click here to Get MT4 version <<---
What is this indicator? Simply put, this indicator analyzes the market across eight different timeframes , from lower to higher, and predicts the next price direction along with an estimated continuation time. It does this by using volume, volatility, and price patterns in its calculations. Let's dive into the inf

A powerful high-frequency tick analysis tool that automatically processes vast streams of market data and provides traders with an accurate picture of market activity to seize trading opportunities. Easily adaptable to any trading style, TickFlow becomes your personal analytical assistant, instantly responding to market changes and helping to identify key support, resistance, and cluster zones. TickFlow is a modern analytical platform that combines intelligent big data processing with intuitive
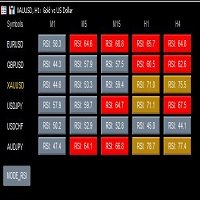
This is a powerful multi cycle, multi currency pair, and multi indicator monitoring tool for MT5 version, with main functions including: 1. Monitor real-time performance of multiple indicators, including RSI, MACD, MA, and STO. 2. Monitor multiple currency pairs, customizable to add or delete currency pairs, and automatically update indicators. 3. Monitor multiple currency pairs over multiple cycles. 4. After clicking, you can directly switch to the chart and cycle you want to view. 5. Click th

This is a custom indicator script for MetaTrader, designed to generate buy and sell signals based on price action relative to Bollinger Bands. It identifies potential trade opportunities when the closing price crosses the lower Bollinger Band, plotting arrows on the chart to highlight entry points. Key Features: Buy and Sell Signals: A buy signal is generated when the closing price moves above the lower Bollinger Band after being below it. A sell signal is triggered when the closing price moves
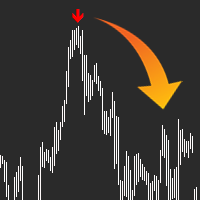
QUICK OVERVIEW: Use AI to predict the markets with AI Arrow, the ultimate trading tool, let it manage the probabilities and send you a simple signal in the form of an arrow, ready to trade, no complex configurations. The indicator will analyze the market and let you know when a potential movement will happen, sometimes it takes some extra bars for the movement to happen as it can't predict the exact top/bottom every time. Arrow will appear at the start of a new bar and alert you, so you have ti

Scalping Signals Pro is a powerful custom indicator designed to help traders identify key market turning points with ease. It provides clear Buy and Sell signals directly on the chart, making it ideal for traders who want to enhance their decision-making process. Key Features:
️ Intuitive and user-friendly interface
️ Non-repainting Buy and Sell signals
️ Works across different timeframes and assets
️ Designed for trend-following and reversal strategies
️ Customizable settings to fit yo

AdaptiveMomentumCCI Indicator
The AdaptiveMomentumCCI is a custom technical indicator for MetaTrader 5 that enhances the traditional Commodity Channel Index (CCI) by incorporating adaptive period adjustments, momentum analysis, and signal filtering. It calculates a smoothed CCI based on a user-defined price source (e.g., HLC/3, OHLC/4, or close), with its period dynamically adjusted using the Average True Range (ATR) to reflect market volatility. The indicator features a dual-line system with

Mini Índice Composition: A Revolução na Análise do Mini Índice! O Mini Índice Composition é um indicador inovador que monitora em tempo real as principais ações que compõem o mini índice, trazendo uma visão quantitativa poderosa sobre o fluxo de ordens do mercado! Como Funciona? Diferente de outros indicadores que utilizam apenas dados históricos, o Mini Índice Composition faz uma leitura ao vivo das ordens que entram e saem das ações, pesando o impacto direto no mini índice. Com

Buy Signal Indicator This indicator generates a Bu y Signal when a potential upward movement is detected. A G reen Arrow appears below the price chart, indicating a possible entry point for a long position. The signal helps traders identify moments of strength in the market.
TIP:- USE 1 HOUR OR BIGGER TIMEFRAMES FOR BETTER RESULTS. TRAIL STOP LOSS BY USING NEAREST SWING HIGHS AND LOWS. NOTE:- THIS INDICATOR GIVES ONLY BUY SIGNALS FOR SELL SIGNAL USE MY OTHER INDICATOR.

Sell Signal Indicator This indicator generates a Sell Signal when a potential downward movement is detected. A Red Arrow appears above the price chart, indicating a possible entry point for a short position. The signal helps traders identify moments of strength in the market.
TIP:- USE 1 HOUR OR BIGGER TIMEFRAMES FOR BETTER RESULTS. TRAIL STOP LOSS BY USING NEAREST SWING HIGHS AND LOWS. NOTE:- THIS INDICATOR GIVES ONLY SELL SIGNALS FOR BUY SIGNAL USE MY OTHER INDICATOR.

Matrix Currency – Multi-Timeframe Analysis Tool The Matrix Currency is an advanced indicator designed to analyze currency strength in the Forex market. It provides efficient monitoring and strategic support for traders seeking clear and actionable insights. Key Features Multi-Timeframe Analysis : Simultaneously monitors multiple timeframes (from M1 to MN1) with real-time updates, displayed in an intuitive matrix format. Alert System : Customizable notifications via pop-up, email, and mobile devi
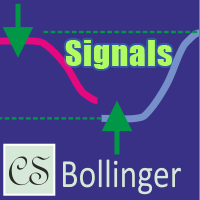
CS Bollinger – è un indicatore di segnali basato sulle Bande di Bollinger, sviluppato per identificare rapidamente livelli chiave di supporto e resistenza con segnali di trading visivi. Grazie a una logica migliorata per il cambio dei livelli, l'indicatore regola automaticamente i livelli sul grafico, mostrando frecce di segnale quando viene confermata un'inversione del prezzo. Ciò consente ai trader di individuare rapidamente i momenti favorevoli per l'ingresso e l'uscita dal mercato. L'indicat

This is a true trend lines indicator for MT4/MT5.
This indicator draw real trend lines.
Usually the trend line is drawn as a solid line.
The next trend line that is likely to be valid is drawn as a dotted line.
The most recent invalidated trend line is drawn as a dashed line.
Three-touch lines is drawn as a bright colors.
If the starting point of the trend line is new, the blue line is displayed(call shortline),
if it is old, the gold line is displayed(call longline).
The number of bars border

Parabolic SAR + Deviation [BigBeluga] is an enhanced Parabolic SAR indicator designed to detect trends while incorporating deviation levels and trend change markers for added depth in analyzing price movements. Key Features: > Parabolic SAR with Optimized Settings: Built on the classic Parabolic SAR, this version uses predefined default settings to enhance its ability to detect and confirm trends. Clear trend direction is indicated by smooth trend lines, allowing traders to easily visuali

L'indicatore mostra i segnali di acquisto e vendita . Il periodo di tempo è Qualsiasi, La coppia di valute è qualsiasi . Parametri : alertsMessage -Disabilita e abilita la finestra di messaggio . alertsSound -disattiva o Attiva l'audio . Arrow Type - per selezionare l'icona delle frecce . Tre semplici modi per filtrare i segnali dell'indicatore : Controllare la direzione con la lettura dell'indicatore da un periodo di tempo più lung
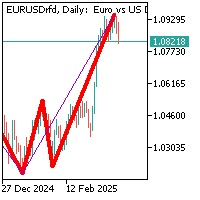
In questo indicatore si formano due zigzag con periodi diversi di 13 e 55.
Quando due segmenti di un indicatore si formano e si uniscono sul posto, formando così il minimo o il massimo di un prezzo in un determinato periodo di tempo, l'indicatore segnala una possibile inversione del prezzo nella direzione opposta. Se, quando si forma uno zigzag con il periodo più piccolo (periodo 13), il periodo più grande (periodo 55) rimane al minimo o al massimo precedente, significa che è possibile un movim

Trend Risk Analyzer intelligently identifies trends, impulses, and corrections, calculating optimal trade volumes and safe levels for stop-loss and take-profit. Increase your accuracy, reduce risks, and boost your trading profits! This product is also available for MetaTrader 4 => https://www.mql5.com/en/market/product/134800 The key feature of Trend Risk Analyzer is its capability to calculate the average range of each market element, enabling traders to set justified stop-loss and take-profi

API BullBearPower mtf MT5 Designed for traders who rely on BullBearPower, this tool provides a multi-timeframe (MTF) view of BullBearPower, helping you identify possible dominant trends. Key Features: Multi-Timeframe Analysis – Analyze BullBearPower across different timeframes in real time. Dynamic Color Changes – Identify possible BullBearPower per individual timeframe with color changes. Volume Integration – Get a picture of possible trend strength with BullBearPower volume of each time

Elite Market Precision Indicator: Outsmart Institutional Manipulation with Fibonacci & Pivot Synergy The Institutional Trap: Why Most Traders Fail The financial markets are a battlefield where institutional traders manipulate price action to create false breakouts, liquidity hunts, and engineered reversals. Most retail traders fall victim to these deceptive moves, leading to emotional trading, fake signals, and capital losses. The Solution: Precision Trading with Fibonacci, Pivot Points & Candle

The indicator is a combination of 3 identical moving averages with a JMA calculation option with different smoothing depth settings. When the fast line crosses the middle and slow lines, the color of all lines changes, and only when the fast line crosses the middle and slow lines in the opposite direction will the color change - a trigger is triggered that does not allow switching directions if only the middle or slow line was crossed, so that the readings do not jump and there is a confident

TickATR Indicator for MT5 Description The TickATR indicator is a powerful volatility measurement tool for MetaTrader 5 that displays the Average True Range (ATR) in terms of actual price ticks. This innovative approach provides traders with a more precise and instrument-independent way to gauge market volatility compared to traditional ATR indicators. By measuring volatility in ticks rather than price units, TickATR offers consistent readings across different instruments regardless of their pric

Gold Rush Scalper The Gold Rush Scalper is a simple yet powerful trading indicator designed for scalping gold (XAU/USD) on the 5-minute chart. It provides clear Buy and Sell arrows, helping traders identify potential trade opportunities with ease.
Key Features:
Buy & Sell Arrows Only: No extra indicators, just precise entry signals. 5-Minute Timeframe : Specifically designed for fast-paced gold trading.
Gold ( XAU/USD ) Only: Not intended for other assets .
No Built-in Risk Management: Trade

FX QUICKSTRIKE Is a high-speed scalping tool designed for gold and forex pairs, providing precise buy and sell arrow signals on the 5-minute timeframe. It leverages momentum shifts, volatility spikes, and price action patterns to detect optimal entry points.
Trade Filtering: Avoids choppy markets by detecting low volatility zones to reduce false signals.
Lot Size Management: Recommends adjusting lot size based on account balance to prevent overexposure.
Spread Protection: Ensures trades are

Spike Hunter B500 A precision trading tool designed exclusively for the B500 1-minute chart. It identifies sharp price movements and potential trade opportunities with built-in risk indication features to help manage volatility. Ideal for traders looking to capitalize on quick market spikes. Alert notifications Push notifications
Disclaimer: Trading involves significant risk of capital loss. You trade at your own risk. Past performance does not guarantee future results. Use proper risk manage

Receive notifications for multi-trendline or single trendline breakout. Yes! You heard us right! You will be notified the moment price crosses any and all the timeframe trendlines that you have chosen. 1. ADDING MULTIPLE OR SINGLE TRENDLINES IN THE SAME DIRECTION To trigger a stronger trading opportunity you can require that price breaks one or more trend lines of different timeframes in the same direction. To do this navigate to the timeframe for which you want to add a trendline and click
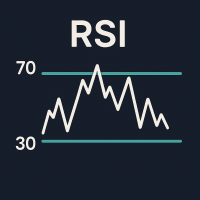
RSI Power Bars – Clear and Precise Momentum Visualization Description: This indicator upgrades the classic RSI into a much more visual and powerful tool. Instead of a flat line, it displays colored bars that instantly show the direction and strength of price movement. Red = bullish momentum
Green = weakness or pullback No more guessing trend shifts or calculating momentum mentally — you see it instantly . Key Benefits: Instantly spot trend reversals Visualize market momentum with bars

Spearman Rank MTF – Momentum Oscillator with Trend Intelligence The Spearman Rank MTF is a powerful oscillator designed to measure trend strength and direction using a statistical approach based on Spearman's Rank Correlation . This indicator excels at detecting trend changes, key reversals, and overbought/oversold conditions with precision and clear visual cues. Key Benefits Multi-Timeframe (MTF) support – analyze higher timeframes without leaving your current chart. Dual smoothing modes –
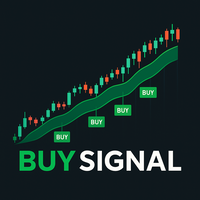
This indicator has been developed as an analytical tool based on exponential moving averages (EMA) . Its purpose is to provide additional insights into market dynamics using two exponential moving averages (EMA) and one smoothed exponential moving average (SMMA) . The indicator can be applied to different financial instruments and timeframes, depending on user preferences. Some traders use it on 30-second charts , complementing it with a 2-minute chart . How the Indicator Works The analysis is b

L’indicatore Stats Probability (CStatsBoard) per MQL5 è uno strumento analitico avanzato progettato per misurare statisticamente le fluttuazioni dei prezzi in percentuale, presentate in una tabella professionale in tempo reale all’interno di una sottofinestra. Con i suoi aggiornamenti rapidi e un’accuratezza eccezionale, questo indicatore è essenziale per i trader che desiderano comprendere il comportamento del mercato e prendere decisioni informate. Caratteristiche principali:
Lo strumento è

Fibo Harmonic Levels Indicator Overview The Fibo Harmonic Levels indicator is a powerful MetaTrader 5 (MT5) tool designed to automatically plot harmonic Fibonacci-based support and resistance levels on your chart. These levels and can be applied to different timeframes (Daily, Weekly, Monthly) either automatically or manually. The indicator also includes an alert system that notifies traders when price touches or crosses any harmonic level, with configurable pause intervals to prevent
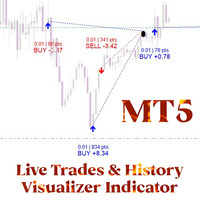
Live Trades and History Visualizer è un potente indicatore MetaTrader 5 progettato per aiutare i trader a monitorare le posizioni aperte e chiuse con indicazioni visive cristalline. Sia che si tratti di monitorare le operazioni in tempo reale o di analizzare le performance passate, questo strumento fornisce visualizzazioni intuitive e personalizzabili dei punti di entrata/uscita, dei profitti/perdite e delle statistiche delle operazioni, direttamente sul grafico.
Visitate il profilo e controll

RTS5Pattern-Profi v9.65 – a professional indicator for MetaTrader 5.
Easily identify price patterns by clicking on the first and last candles of your selected formation. The indicator automatically scans historical data and displays the three most similar past patterns, each with its own forward-looking price prediction. Key features include: Advanced price and volume normalization for accurate similarity detection Visualized predictions and statistical forecasting curve (AStat) Support and re

ReversalRadar: Precision Trend Identification Indicator Trade With Confidence, Trade With The Trend ReversalRadar is a powerful trend identification tool designed to give traders the edge in spotting high-probability trading opportunities. By accurately identifying the current market direction, this indicator allows you to align your trading strategy with the prevailing trend, significantly increasing your potential for profitable trades. Key Features: Real-time Trend Analysis : Dynamic visual s
Il MetaTrader Market offre un luogo pratico e sicuro dove acquistare applicazioni per la piattaforma MetaTrader. Scarica versioni demo gratuite di Expert Advisors e indicatori direttamente dal tuo terminale e testali nello Strategy Tester.
Prova le applicazioni in diverse modalità per monitorare le prestazioni ed effettuare pagamenti per i prodotti desiderati, utilizzando il sistema di pagamento MQL5.community.
Ti stai perdendo delle opportunità di trading:
- App di trading gratuite
- Oltre 8.000 segnali per il copy trading
- Notizie economiche per esplorare i mercati finanziari
Registrazione
Accedi
Se non hai un account, registrati
Consenti l'uso dei cookie per accedere al sito MQL5.com.
Abilita le impostazioni necessarie nel browser, altrimenti non sarà possibile accedere.