Guarda i video tutorial del Market su YouTube
Come acquistare un Robot di Trading o un indicatore
Esegui il tuo EA
hosting virtuale
hosting virtuale
Prova un indicatore/robot di trading prima di acquistarlo
Vuoi guadagnare nel Market?
Come presentare un prodotto per venderlo con successo
Indicatori tecnici per MetaTrader 5 - 100

Progettato per la precisione
Kecia RSI Pro è stato progettato per trasformare le tue capacità di analisi tecnica, offrendo una comprensione senza precedenti della dinamica del momentum e del trend di mercato. A differenza degli indicatori RSI standard che si limitano a un solo approccio analitico, questa suite avanzata fornisce 9 metodologie RSI specializzate in un unico potente strumento, offrendoti una visione completa delle condizioni di mercato da molteplici prospettive analitiche. Ciò che

Phantom Bands – MT5 Indicator Zone-Based Reaction Levels for Price Action Traders Phantom Bands is a MetaTrader 5 custom indicator that draws multiple adaptive bands on your chart. These levels are designed to assist traders in identifying potential price interaction zones based on internal logic — particularly useful for short-term discretionary strategies. Description This indicator creates zone-based bands around internal pivots. The logic behind the bands is based on price interaction

Kecia MA Pro è progettato per trasformare le tue capacità di analisi tecnica, fornendo approfondimenti sulle tendenze di mercato e sulla dinamica dei prezzi. A differenza degli indicatori di media mobile standard, che ti limitano a un solo approccio analitico, questa suite avanzata offre 15 metodologie specializzate di media mobile (MA) in un unico strumento potente, fornendoti una visione completa delle condizioni di mercato da molteplici prospettive analitiche. Ciò che distingue questo indicat

Enhanced Bull-Bear Power Indicator Description The Enhanced Bull-Bear Power Indicator is a custom technical analysis tool designed for MetaTrader 5. It provides a visual representation of the relative strength between bullish and bearish market forces over a user-defined period. By calculating the average percentage change for bullish and bearish bars, the indicator computes a strength ratio that helps traders identify prevailing market sentiment. Features
User-adjustable period for calculatio

Kecia Ichimoku Pro è progettato per trasformare le tue capacità di analisi tecnica, offrendo una comprensione profonda delle dinamiche di mercato grazie a un'implementazione avanzata del sistema Ichimoku Cloud . A differenza degli indicatori Ichimoku standard che si limitano a un solo stile di presentazione, questa suite avanzata offre 10 metodologie di visualizzazione specializzate all'interno di un unico e potente strumento, fornendoti una visione completa delle condizioni di mercato da moltep
Indicatore Tempo Rimanente Candela
Questo indicatore mostra il tempo rimanente per la chiusura della candela attuale in qualsiasi timeframe.
Caratteristiche: - Rilevamento automatico della lingua di MetaTrader - Conto alla rovescia sullo schermo con aggiornamenti in tempo reale - Cambio colore dinamico in base al tempo rimanente (verde, arancione, rosso) - Compatibile con tutti gli strumenti: indici, forex, crypto, ecc. - Visualizzazione immediata senza errore “Label”
Perfetto per scalper

Indicator Name: Fibaction – price action candle Detector Description:
Fibo Signal Boxes is a powerful Smart Money Concept (SMC)-inspired indicator that auto-detects price action candles. bullish hammers and shooting stars, then draws precise Fibonacci entry zones and multiple take-profit levels directly on the chart. as for the SL personally i use 40 pips rules Key Features: Detects bullish hammer and shooting star reversal candles. Automatically draws Fibonacci entry and TP boxes. as
Optimus Time Tracker Indicator User Manual Integrating The Optimus Time Tracker Indicator With Trading Generally: Boosting Precision & Perfomance
The market and trading revolve around the concept of probabilities for certain outcomes, which—when favorable—translate into profitable trades for the speculator. However, how do we quantify probabilities if we are not equipped with data and statistics from the various important segments of the market?
Maintaining the concept of the union of the X a

NOTE: Turn Pattern Scan ON
This indicator identifies Swing Points, Break of Structure (BoS), Change of Character (CHoCH), Contraction and Expansion patterns which are plotted on the charts It also comes with Alerts & Mobile notifications so that you do not miss any trades. It can be used on all trading instruments and on all timeframes. The non-repaint feature makes it particularly useful in backtesting and developing profitable trading models. The depth can be adjusted to filter swing points.

TradeJournal Plus: Auto Session Reports & Built-in PnL Indicator The ultimate automated trading diary for serious traders. Effortlessly log every session, export detailed reports in one click, and always know your real-time profits with the built-in PnL display. Take your trading journal to the next level optimize, review, and improve every trade. Key Benefits
Automated Trade Journal: Forget manual spreadsheets—TradeJournal Plus captures every detail of your trading sessions automatically, from
Ay Signal Trend Indicator Indicatore di generazione segnali di trend Segnali trend in tempo reale e senza repaint! Compatibile con BTCUSD, XAUUSD, USDJPY, GBPJPY e altri principali cross FX/CFD. L’algoritmo originale “Ay Signal” minimizza falsi segnali e ingressi inutili. Molto efficace su mercati ad alta volatilità (Bitcoin, Oro, cross Yen ecc.)
Segnali intuitivi con frecce e punti colorati
Progettato per il timeframe M1 – ideale per scalping e day trading
Operazioni rapide: ingresso/uscita in

This powerful tool spots high-probability trades on major forex pairs (M1 timeframe). It shows clear buy/sell signals (green/blue arrows) and automatically sets profit targets & stop losses for stress-free trading. Key Features:
Clear non-repainting signals (green buy/blue sell arrows)
Auto TP/SL levels for every trade
Instant alerts (push, email, sound)
Works on 1-minute charts for fast opportunities
Covers all major forex pairs : XAUUSD, EURUSD, NZDUSD,
MFI Multi-Scanner Indicator for MT5
The MFI Multi-Scanner Indicator is designed for automatic scanning of multiple currency pairs and timeframes to detect overbought and oversold signals using the Money Flow Index (MFI). It displays MFI values, signal arrows, and an interactive on-chart table. Ideal for traders who want to see the full market picture without constantly switching between windows. Performance Recommendations
For maximum speed and fast testing, it is recommended to: Run the i

Indicatore del percorso di trading: quadro visivo per l'azione algoritmica dei prezzi Trade Path è un indicatore di livello professionale progettato per rivelare i punti decisionali delle strategie di trading algoritmico. Rappresenta la mappa delle aree in cui gli algoritmi sono più attivi (zone di ingresso, livelli di stop e probabili punti di inversione), offrendo ai trader manuali una visione strutturata delle dinamiche di mercato.
Componenti principali spiegati: Linea di segnale (analisi
Il Sigma Level Analyzer è un indicatore di trading progettato per visualizzare la struttura del mercato, i livelli di breakout della volatilità e il comportamento dei prezzi dopo un breakout durante le tre principali sessioni di trading (Asia, Londra, New York). È ideale per i trader che desiderano: Identificare intervalli di prezzo basati sulla sessione Rilevare breakout e misurare reazioni/estensioni Migliorare la precisione delle strategie specifiche per sessione
Caratteristiche principali R

The indicator is designed to display information about current trading. The current information and statistics panel displays data on the number of trading orders, their profit and the number of lots. The equity status as a percentage of the balance of funds and the total profit of all orders on this instrument are also displayed. In the statistics panel, you can see information on closed orders from the beginning of the specified date in the settings. The panels have flexible size and color se

Catch boom spikes like a pro – before they happen! The KarooSpikes Boom Spike Catcher is a powerful MetaTrader 5 indicator designed for traders who want to consistently catch spikes on Boom with precision and confidence. What This Indicator Does: Detects high-probability spike zones using a combination of: RSI + Stochastic crossovers Price action 50 EMA trend filter Plots clear BUY arrows on your chart when spike conditions are met Sends instant mobile + sound alerts so you never miss a
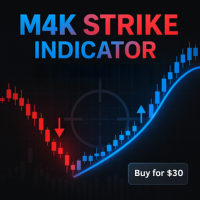
A simple indicator that changes color according to trend direction and marks each turn with an arrow and optional sound alert. Features Dual-Color Blue when the line is rising Red when the line is falling Arrow Signals Up-arrow at the start of an up-trend Down-arrow at the start of a down-trend Configurable Alerts Popup notification on each closed-bar trend change Optional custom WAV file (leave blank to use the MT5 default) Alerts fire once per closed bar to avoid repeats Native MQL5 Implem

VolMoPulse – Segnali di trading basati su momentum e volume Individua in anticipo le tendenze più forti: individua l'esaurimento prima dell'inversione! VolMoPulse è un indicatore MetaTrader progettato per evidenziare movimenti dei prezzi ad alto slancio con chiari segnali visivi. Combinando forza del volume E momentum dei prezzi , aiuta i trader a identificare il inizio di tendenze esplosive e avverte di potenziali inversioni quando i
The SyntheticaFX Pain & Gain Spike Indicator is a specialized tool designed to identify potential spike opportunities in the market, exclusively for traders focusing on Weltrade Pain and Gain pairs. This indicator is optimized to operate on the 1-minute (M1), 2-minute (M2), 3-minute (M3), and 5-minute (M5) timeframes and supports only the following pairs: PainX 1200, PainX 999, PainX 800, PainX 600, PainX 400, GainX 1200, GainX 999, GainX 800, GainX 600, and GainX 400. It will not display signal
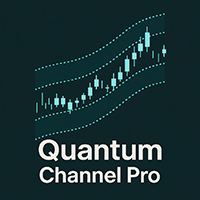
Quantum Channel Pro è uno strumento rivoluzionario di analisi della volatilità multicanal, progettato per identificare trend, punti di inversione e rumore di mercato. Utilizzando canali di deviazione standard adattivi, traccia tre livelli (interno, medio ed esterno) per aiutare i trader a prendere decisioni più precise. Caratteristiche principali: Tre canali intelligenti (1σ, 2σ, 3σ) Statistiche di probabilità in tempo reale Filtraggio adattivo del rumore Compatibile con tutti i timeframe Segnal

Индикатор не перерисовывается так как использует сложную систему расчета. Индикатор послужит вам для принятия решений хеджированный сделок между коррелирующими инструментами, например между GBPUSD и EURUSD, на скриншоте показано где принять решения для открытия и закрытия сделок, верхний нижний канал для открытия сделок на покупку и продажу, и средняя линия для закрытия сделок, можете создать на основе индикатора стратегию с минимальным риском

Discover clear, real-time trend signals with the Ehlers TrendFlex Indicator for MT5 – a zero-lag, momentum-based tool built for fast, accurate entries and exits.
Key Benefits & Features Zero-Lag Trend Detection: Built on John F. Ehlers’s proven digital signal processing techniques, an advanced smoothing algorithm minimizes delay, highlighting true market direction the moment it forms. Momentum Insights: Acts as an oscillator to gauge trend strength and momentum shifts. Fully Customizable: Adjus
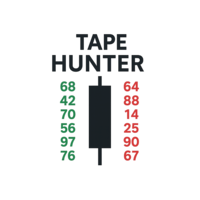
Tape Hunter – Il tuo radar Sforzo vs Risultato su MT5 Tape Hunter è l’indicatore definitivo per i trader che vogliono vedere il vero gioco dei prezzi su MetaTrader 5. Mostra in modo chiaro e intuitivo i volumi aggressivi di acquisto e vendita basati sul POC (Point of Control), permettendoti di visualizzare lo sforzo del mercato e il risultato reale di ogni candela. ️ Perché è importante?
Non tutti i volumi muovono il prezzo! Tape Hunter evidenzia se lo sforzo (volume aggressivo) sta davv
MacD Power Trend — Multi-Timeframe, Color MACD Indicator Designed to help you avoid missing the most critical turning points in the market. Not a simple indicator, it speeds up the decision-making process for both novice and professional traders with its customizable color palette, multi-timeframe support, and clear visual signals. • Multi-Timeframe Support – Track 1-hour, 4-hour, daily, and more beyond your main chart with just one click. • Dynamic Color Coding – MACD line and histogram bars a
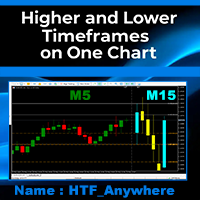
============================================== UNLOCK THE ULTIMATE TRADING EDGE: MULTI-TIMEFRAME ON ONE CHART FOR MT5!
=========================================
FINALLY, THE IMPOSSIBLE IS HERE! Traders, imagine seeing ANY higher timeframe directly on your current chart —without switching screens, without missing a beat. What if you could analyze the daily trend on a 5-minute chart , or spot weekly key levels while trading the 1H on the exact same chart?
INTRODUCING HTF Anywhere,
Alpha Indicator – Precision Trading for Every Market Trade Smarter, Not Harder.
The Alpha Indicator is a non-repainting, high-accuracy trading tool designed for serious traders across all styles — scalping, day trading, and swing trading. Whether you're on Forex, Gold, Crypto, NAS100, GER30, or Deriv Synthetic Indices like Volatility, Boom & Crash, this indicator adapts to your market and strategy. It combines powerful components: Alpha Trend Filter – confirms bullish or bearish momentum

Click2FiboDrawer – Instantly Draw Fibonacci Retracement Lines with 2 Clicks Click2FiboDrawer is a powerful manual drawing tool for discretionary traders who use Fibonacci retracements in their technical analysis.
With just two mouse clicks, you can draw clean and precise Fibonacci levels directly on your chart — no clutter, no menus, no hassle. Even during fast-paced scalping sessions, this tool enables you to quickly add Fibonacci retracement levels and react to market moves in real-time.
It’s
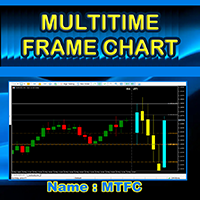
MTFC (Multi Timeframe Chart) – See 2 Timeframes on ONE Chart!
"Trade Smarter, Not Harder – Eliminate Timeframe Switching Forever!" Imagine having the power to see any higher timeframe (M5, M15, H1, H4, D1, MN1, etc.) directly on your current chart. No more flipping between charts, no more guesswork—just pure trading clarity in one place. That’s exactly what the MTFC Indicator delivers! 1. The Problem It Solves As traders, we know context is king . But constantly switching between c

ARIMA Neural Link - Trading Revolution When Mathematics Meets Artificial Intelligence Tired of unpredictable losses? Fed up with guessing market movements like reading tea leaves? While you're losing money on emotional decisions, professional traders are already using tomorrow's technology. Introducing ARIMA Neural Link The world's first hybrid indicator combining the power of classical ARIMA modeling with cutting-edge neural network algorithms. This isn't just another indicator — it's a quantum
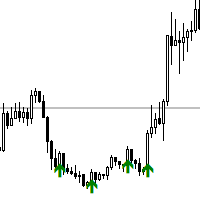
NOTE: Turn Pattern Scan ON
This indicator identifies 11 candlestick patterns, filters them to generate trading signals which do not repaint. This signal are supposed to be high probability setups. It also comes with Alerts & Mobile notifications so that you do not miss any trades. It can be used on all trading instruments and on all timeframes. The non-repaint feature makes it particularly useful in backtesting and developing profitable trading models

What is it? Supreme Trend Pro is an exclusive indicator for MetaTrader 5 that analyzes the current trend using a precise combination of three of the most respected indicators on the market: ️ Moving Averages (MA) ️ MACD ️ ADX
It clearly and visually identifies: When the market is favorable for Buying When it is favorable for Selling When it is still in Analysis / Waiting Features: Chart panel with information: — Trend (Bullish, Bearish, Neutral) — MA status, MACD and ADX strength —

Supreme Multi TF Pro is an advanced indicator for MetaTrader 5 that automatically analyzes multiple timeframes — from M1 to Monthly — using a combination of MA, MACD, and ADX. It clearly displays signals for Buy , Sell , or Hold on each timeframe, and highlights the Best Timeframe to trade . Perfect for traders seeking fast and reliable decisions, with intuitive and color-coded panels. Customize parameters to fit your strategy and trade with greater confidence.
APICT Chart Patterns – AI-Powered Trend Line & Pattern Recognition for MT5 Unlock the power of automated pattern recognition and trend line analysis with the APICT Chart Patterns Indicator an intelligent tool designed to enhance your technical analysis workflow on MetaTrader 5. Key Features AI-Powered Pattern Detection : Automatically identifies over 10 classic chart patterns including pennants, wedges, channels, double tops/bottoms, and more. Real-Time Trend Lines : Instantly draws support
Real Volume N1 – Accurate Volume Insight for Every Candle
The Real Volume N1 indicator works with both real volumes and tick volumes. However, I highly recommend using real volumes only, as tick volumes cannot reliably indicate how much was actually bought or sold.
To get the most accurate results, use this indicator with brokers that provide real volume data, Works on any timeframe from m1 to month
On every candle, the indicator displays the exact volume, helping professional traders make i

ICT Order Blocks Premium Indicator Professional Market Structure Analysis Based on ICT Methodology OrderBlocks ICT is an advanced technical analysis tool that identifies high-probability trading zones based on the Inner Circle Trader (ICT) methodology. This professional-grade indicator detects key market turning points using institutional order block analysis, revealing where smart money is likely accumulating positions. Key Features: Smart Filtering Technology : Eliminates weak and insignific

Indicator Name: Auto Trend Line Description: Automatically draws trend lines with optimized and enhanced trend direction detection. Main Features: 1. Automatic Trend Line Drawing: Two main lines are plotted: Support Line – color: Magenta Resistance Line – color: Cyan Lines are calculated based on: Two extremums (highs/lows) or an extremum and a delta (custom offset) 2. Trend Direction Detection: The indicator determines the current trend as: TREND_UP (Uptrend value = 1) TREND_DOWN (Downtrend val

Un potente indicatore multifunzione progettato per offrire una visione chiara e strutturata della forza del mercato, integrando tre strumenti tecnici in un'unica interfaccia intuitiva: Caratteristiche principali: Heikin Ashi RSI Normalizzato Calcolato sul RSI di medie Heikin Ashi, centrato su una scala da -50 a +50 Visualizzazione con candele colorate (blu/rosso) per una lettura chiara della direzione e del momentum Stocastico Modificato %K e %D convertiti sulla stessa scala -50/+50 Opzio

Questo indicatore avanzato disegna automaticamente pivot High/Low e trendline su un timeframe selezionato (es. H4, D1, ecc.) e li rende visibili su tutti i timeframe inferiori. L'obiettivo principale è fornire un contesto strutturale multi-timeframe unito a segnali di tocco sulle trendline. Caratteristiche principali: Trendline Automatiche : Disegnate tra i pivot High e Low rilevati sul timeframe selezionato.
Classificate in trendline rialziste (UpTrend), ribassiste (DownTrend) e rotte (B
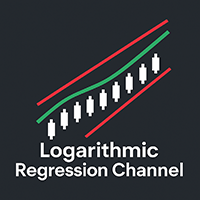
Un indicatore avanzato che combina la regressione logaritmica dinamica con strumenti di analisi trend intelligente , visualizzazioni personalizzabili e filtri avanzati per confermare la direzione del mercato. Come utilizzare l’indicatore Logarithmic Regression Channel - Trend (Disegnato su timeframe superiori) Trend rialzista
(slope ≥ +3) Si può acquistare in due modi: Quando il prezzo rimbalza sulla banda inferiore del canale (trendline bassa). Quando il prezzo supera la linea centrale d

TrendPulse Engulf Pro – Ride the Wave of Precision Trading! TrendPulse Engulf Pro is a futuristic, precision-engineered trend-continuation indicator designed for traders who demand clarity, accuracy, and performance. Built on a 40-period moving average combined with advanced engulfing pattern detection, this tool highlights high-probability market entries that align with momentum and market structure. Whether you're a scalper, day trader, or swing trader, TrendPulse Engulf Pro gives you a clean,
ZeroLag TrendCandle — Sistema di colorazione delle candele e allarmi in tempo reale (Senza Repainting)
ZeroLag TrendCandle è uno strumento di rilevamento del trend in tempo reale che applica una colorazione delle candele senza repaint basata su un'analisi avanzata dell'indicatore Williams Percent Range (WPR). Evidenzia i cambiamenti di trend, le variazioni di momentum e i potenziali inversioni tramite un sistema cromatico dinamico — consentendo ai trader di capire immediatamente la direzione d

Let's follow the trend with the Goby trailing! According to your filters, you can use the arrows (Bullish [start] and Bearish [start]) as entry signals. After making an entry [position], you can use the Bullish [trailing] as a trailing stop for bullish positions and Bearish [trailing] as a trailing for bearish positions. Through the inputs, you can adjust the indicator for better performance in the assets you operate! Enjoy...
Sfrutta la potenza dell'Estensione di Fibonacci per un trading più intelligente
Potenzia la tua strategia di trading con lo strumento di Estensione di Fibonacci, un'aggiunta formidabile al tuo arsenale di analisi tecnica. Questo indicatore, basato sulla rinomata sequenza di Fibonacci, consente di individuare con precisione i livelli chiave di supporto e resistenza. Estendendo i rapporti di Fibonacci del 23,6%, 38,2%, 50%, 61,8% e 100% da massimi o minimi significativi, offre informazioni chiare
VWAP Signal Indicator The VWAP Signal Indicator is an advanced technical analysis tool designed for traders who want to combine institutional-level price action with simple, actionable buy and sell signals. VWAP (Volume Weighted Average Price) is a widely-respected benchmark used by professional traders to identify the true average price of an asset, factoring in both price and traded volume. Key Features: Dynamic VWAP Curves:
Plots daily, weekly, and monthly VWAP lines directly on your chart,

TRADE ASSISTANT PRO – Your Ultimate Manual Trading Companion TRADE ASSISTANT PRO is a powerful all-in-one trading utility designed for manual traders who value precision, control, and efficiency. Whether you’re a scalper, day trader, or swing trader, this tool gives you everything you need at your fingertips to make faster, smarter trading decisions. Key Features: Multi-Timeframe & Multi-Symbol Display
Monitor multiple pairs and timeframes from a single chart. Get real-time info across
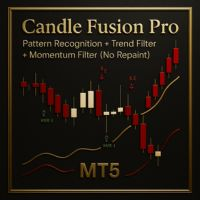
Candle Fusion Pro — Riconoscimento dei pattern + Filtro di tendenza + Filtro di momentum (Nessun repaint) Rileva potenti pattern di candele giapponesi e conferma la loro forza con analisi in tempo reale di trend e momentum. Candle Fusion Pro è lo strumento visivo definitivo per i trader che si affidano a precisione del price action , struttura del trend e conferme multilivello .
Funzionalità principali
Entrata basata su pattern : Rileva oltre 10 pattern avanzati giapponesi , tra cui: Shooting

Introducing “OctoLevels” – Your Deep-Dive Price Navigator Explore the depths of the market with OctoLevels, the ultimate support and resistance indicator inspired by the precision and adaptability of ocean life. Like the intelligent octopus, OctoLevels uses 12 dynamic price levels to track key zones—support and resistance—that remain visible across months of historical data, giving traders a true long-range perspective. Unlike standard indicators, OctoLevels allows you to work with non-standard
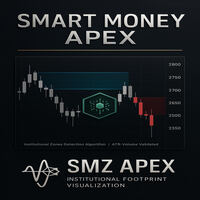
Bu gösterge, yatırımcıların belirli bir temel zaman dilimindeki fiyat hareketleri ve hacim analizine dayanarak grafikte potansiyel kurumsal ilgi alanlarını ve Emir Bloklarını (Order Blocks) belirlemelerine yardımcı olmak için tasarlanmıştır. Bu bölgeler, fiyat tepkisinin muhtemel olduğu önemli destek veya direnç seviyeleri olarak işlev görebilir. ️ Gösterge Yapılandırması Göstergeyi grafiğinize eklediğinizde, çeşitli gruplandırılmış seçeneklere sahip bir yapılandırma penceresi görünecektir. He
This advanced indicator detects high-probability spike entries on PainX 400 & GainX 400 (M1 timeframe), featuring: Clear non-repainting signals (green buy/blue sell arrows)
Auto TP/SL placement for every trade
Instant alerts (push notifications, email & sound)
Real-time performance tracking
Multi-timeframe trend analysis Optimized For:
• PainX 400
• GainX 400
BRAIN Indicator – Smart Buy & Sell Signal Tool (MT5) BRAIN Indicator is a powerful signal generator designed to detect high-probability trade setups based on smart combinations of momentum and price behavior. Built for precision, it displays clear BUY/SELL arrows directly on your chart — no repaint, no confusion. Fully compatible with Volatility Indices (e.g., V75), Forex, Crypto, and more.
Fast. Focused. Built to trade smart — like a brain.
Key Features: Clean signal

Professional Trading Tool for Volatility Markets This advanced indicator detects high-probability entries on Weltrade's synthetic indices (M1 timeframe), featuring: Clear non-repainting signals (green buy/red sell arrows)
Auto TP/SL placement for every trade
Instant alerts (push notifications, email & sound)
Real-time performance tracking
Multi-timeframe trend analysis Optimized For:
• Fx Vol 80 / Fx Vol 99
• FlipX 1 / FlipX 2

ClearView Trend Finder — Lo vedi quanto è chiaro? Hai mai avuto la sensazione che il tuo grafico sia troppo caotico? Troppi indicatori, segnali contrastanti e linee che complicano solo l'analisi?
ClearView Trend Finder elimina completamente questo disordine visivo e ti permette di concentrarti sull’unica cosa che conta davvero: la tendenza chiara .
Questo sistema trasforma il grafico in una vista pulita e precisa, che non si ridisegna né si modifica mai. Ogni candela è filtrata per mostrare so

Trend Pulse Apex — Riconoscimento di Pattern + Filtro di Trend + Filtro di Momentum (No Repaint) Trend Pulse Apex individua formazioni di candele ad alta probabilità e le conferma con controlli in tempo reale di trend e momentum. Tracciando frecce e etichette fisse solo su barre chiuse, l’indicatore fornisce segnali precisi senza repaint né ritardi. Funzionalità Principali
• Rilevamento Pattern: Identifica oltre dieci pattern giapponesi avanzati—come Shooting Stars, Engulfings, Stars, Dojis, H
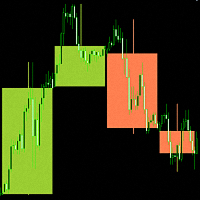
"Today, candle charts are one of the most widely used ways to display the price of certain asset. However, until relatively recently, candle charts were not as widespread in technical analysis as they are today. For example, it was not until the early 1990s, when Steve Nison published the books "Japanese Candlestick Charting Techniques" and "Beyond Candlesticks" in which he introduced and described the concept of candles and candlestick patterns, that candlestick charts became more prominent in

MACD Indicator User Guide The MACD Indicator is a MetaTrader 5 tool that helps traders analyze market trends and momentum. It shows three components in a separate window below the price chart: the MACD Line, Signal Line, and Histogram. What It Shows: MACD Line (Blue): Tracks the difference between a fast and slow moving average. Signal Line (Orange): A smoothed average of the MACD Line. Histogram (Bars): Shows the gap between MACD and Signal Lines with colors: Dark Green : Rising momentum above

Easy! Before opening a trade, the indicator calculates your position size. Just drag one line to your stop level.
A one-line position size calculator based on a percentage of your total account balance. Just drag the SL line below or above your stop level to instantly see the lot size. The information updates automatically as the price changes. Works with Forex, stocks, crypto, and metals.
Enjoy!
How to Use : Attach to the chart Drag the indicator onto your chart. Draw a Stop-Loss Line:
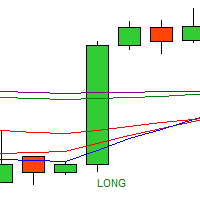
Quad EMA Cross Indicator
- Capture powerful trend changes with precision! - This indicator tracks four EMAs (20, 50, 100, 200) and signals strong LONG/SHORT entries when price crosses all four simultaneously. - Clear visual labels make spotting high-probability trades a breeze. - Perfect for any timeframe or market. - Boost your trading with reliable, filtered signals!

Alert Signal Chess Trading Opening “La strategia degli scacchi applicata al trading nel Forex” La Strategia Immagina il mercato come una scacchiera . Ogni indicatore tecnico è un pezzo , con una funzione unica e potente. Questo sistema combina sei pezzi chiave che lavorano in armonia per rilevare segnali di ingresso con alta probabilità: Pedone (EMA 50): Rileva rapidi cambiamenti di tendenza. Torre (EMA 200): Conferma le tendenze principali, ferma come una muraglia. Cavallo (Bande di Bo
L'indicatore Flower è uno strumento di analisi tecnica utilizzato principalmente per identificare i trend e supportare le strategie di scalping o di trading intraday.
L'indicatore Flower è un indicatore di trend basato sull'analisi tecnica e sulla dinamica dei prezzi. Segnala visivamente i trend utilizzando fiori colorati: i fiori blu indicano un trend rialzista, mentre i fiori rossi indicano un trend ribassista.
Ogni livello può fungere da supporto e resistenza (osservare i livelli +/- 200 e
Dive into the world of highly accurate statistics and dynamic capital allocation with the advanced tool – PCA Arbitrage 3X . This indicator is based on Principal Component Analysis (PCA) , a method used by elite traders to identify hidden patterns in market movements. With the advanced Jacobi algorithm (ML) for calculating eigenvalues and eigenvectors, the system transforms complex historical data into clear signals for entry and position management. It is with this technique that you can make
FREE

Deriv Synthetics Indices Killer MT5 - Ultimate Volatility Trading Tool Our cutting-edge MT5 indicator transforms volatility trading with institutional-grade accuracy, delivering high-probability signals on the world's most popular synthetic indices
Features: Non-repainting buy/sell signals (M1 timeframe) Auto TP/SL placement for every trade Instant alerts : push, email, sound notifications Supports all Deriv volatility indices : V25, V75, V100, V150, V250, Step Index, V150 (1S), V25
Flash Candle – Sistema di Colorazione delle Candele & Avvisi in Tempo Reale (Nessun Repaint) Flash Candle valuta il Williams Percent Range sulla candela chiusa più recente (bar 1) e assegna a essa un colore definitivo. La candela corrente (bar 0) mostra una tonalità provvisoria fino alla chiusura, garantendo che i segnali si basino esclusivamente su dati completi. Nessun Repaint Flash Candle è progettato per eliminare qualsiasi repaint, backpainting o alterazione visiva. I segnali vengono confer

VolumeDiffCandles - is custom indicator designed to display price candles in a separate window, with an emphasis on visual separation depending on the direction of change in trading volume between the current and previous bar. Candles accompanied by an increase in volume compared to the previous one are colored green, and candles with a decrease in volume are displayed in red. This indicator was created to facilitate the visual search for a graphic pattern in which changes in volume, namely its

Volume Profile, Footprint and Market Profile TPO (Time Price Opportunity). Volume and TPO histogram bar and line charts. Volume Footprint charts. TPO letter and block marker collapsed and split structure charts. Static, dynamic and flexible range segmentation and compositing methods with relative and absolute visualizations. Session hours filtering and segment concatenation with Market Watch and custom user specifications. Graphical layering, positioning and styling options to suit the user's a

This is the test product. Please, DO NOT BUY IT! This is the test product. Please, DO NOT BUY IT! This is the test product. Please, DO NOT BUY IT! This is the test product. Please, DO NOT BUY IT! This is the test product. Please, DO NOT BUY IT! This is the test product. Please, DO NOT BUY IT! This is the test product. Please, DO NOT BUY IT! This is the test product. Please, DO NOT BUY IT!
Il MetaTrader Market offre un luogo pratico e sicuro dove acquistare applicazioni per la piattaforma MetaTrader. Scarica versioni demo gratuite di Expert Advisors e indicatori direttamente dal tuo terminale e testali nello Strategy Tester.
Prova le applicazioni in diverse modalità per monitorare le prestazioni ed effettuare pagamenti per i prodotti desiderati, utilizzando il sistema di pagamento MQL5.community.
Ti stai perdendo delle opportunità di trading:
- App di trading gratuite
- Oltre 8.000 segnali per il copy trading
- Notizie economiche per esplorare i mercati finanziari
Registrazione
Accedi
Se non hai un account, registrati
Consenti l'uso dei cookie per accedere al sito MQL5.com.
Abilita le impostazioni necessarie nel browser, altrimenti non sarà possibile accedere.