YouTubeにあるマーケットチュートリアルビデオをご覧ください
ロボットや指標を購入する
仮想ホスティングで
EAを実行
EAを実行
ロボットや指標を購入前にテストする
マーケットで収入を得る
販売のためにプロダクトをプレゼンテーションする方法
MetaTrader 5のためのテクニカル指標 - 100

titoincV11 – Advanced Trend Detection and Tracking Module titoincV11 is a custom-built algorithm that dynamically analyzes price movements and determines market direction based on average values and volatility thresholds. It: Clearly identifies the current directional bias, Continuously tracks the relationship between price and algorithmic threshold, Detects directional shifts without delay, Produces a filtered signal line to act as a precise trigger for automated systems. When the price r
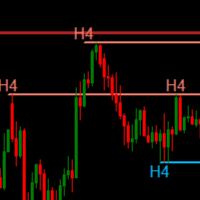
Sniper SR Breakout (Multi-Timeframe) es tu compañero definitivo para atrapar cada giro del mercado con la precisión de un francotirador. Diseñado para traders que exigen exactitud, este indicador: Dibuja líneas nítidas de soporte y resistencia en todas las temporalidades, desde M1 hasta MN1. Actualización dinámica : las líneas se ajustan automáticamente hasta la vela actual, sin necesidad de recargar. Personalización total : elige color, grosor y número de barras a analizar para cada timeframe,

Daily Candlestick Statistics Indicator
Are you concerned about how to interpret market data and make informed decisions? Our 365-day daily candlestick statistics indicator offers you a powerful tool for analysis and forecasting!
What it does:
- Daily candlestick count: The indicator analyzes all candles for the past year, providing extensive statistics for each day of the week. - Day of the week statistics: Get visual data on how the markets closed on different days. For example, you will se
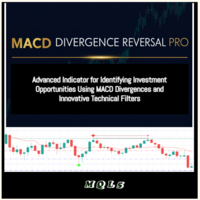
MACD Divergence Reversal PROは、MACDの発散を分析し、革新的な技術フィルターと組み合わせて投資機会を特定するための高度なインジケーターです。これは、ボラティリティのある市場、レンジ相場、または長期トレンドの終盤でトレンド変化を予測したいトレーダーにとって必須のツールです。 主な特徴: MACD 発散検出: 通常の上昇発散: 価格が新たな安値を付けたが、MACD はより高い安値を示す場合(売り圧力の弱さ)。 通常の下降発散: 価格が新たな高値を付けたが、MACD はより低い高値を示す場合(買い圧力の弱さ)。 隠れ発散: 続続戦略向け(オプション)。 シグナル確認のための高度フィルター: ADX フィルター: 平均方向性指標(ADX)を統合して逆転の強度を検証: ADX < 25 → サイドウェイズ市場(レンジ)。 ADX > 40 → トレンドの枯渇。 RSI フィルター: 過買(70)および過売(30)レベルをカスタマイズして信頼できないシグナルをフィルタリング。 ボリュームフィルター: ボリュームが移動平均を超えた場合のみアラートをアクティブにする(設定
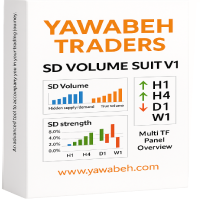
Yawabeh SD Pro – Professional Supply and Demand Indicator Trade Smarter with Volume-Confirmed Supply/Demand Zones Our institutional-grade algorithm identifies high-probability reversal zones before price reacts, giving you the edge in Forex, Crypto, and Stocks. Key Features Multi-Timeframe Confirmation
– View trend strength across multiple timeframes simultaneously
– Align your trades with higher timeframe momentum Smart Alert System
– Real-time notifications for:
– Strong demand/supply zone
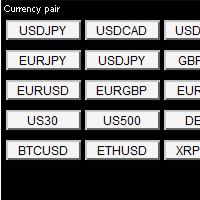
Key Points: One-Click Pair Switching – Instantly change between your favorite currency pairs with a single click, eliminating manual searches. Fully Customizable Layout – Organize up to 8 rows of trading pairs, adjusting button size, spacing, and colors to fit your workflow. Visual Selection Feedback – Clearly highlights the active pair for quick reference, reducing errors in fast-moving markets. Optimized for Speed – Lightweight design ensures smooth performance without

"Manual channel drawing? Not anymore. Let the market structure reveal itself automatically." "Track long-term price zones 24/7, in real-time." Real Trader Pain Points Identifying pivot points manually takes huge time and effort Difficult to adapt to high volatility and pinpoint reliable channels Copy Ideas "Markets never sleep. Why should your analysis stop?" "Dozens of assets a day—how do you keep up?" Core Claim AutoChannels automatically reads market structure , reducin
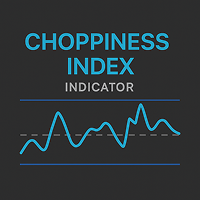
Choppiness Index — Trend or Range Market Indicator(MT5) Analyze market structure with the Choppiness Index. Adjustable settings and band visualization help distinguish between trend and consolidation phases. Overview The Choppiness Index is a volatility-based indicator for MetaTrader 5 that helps traders assess whether the market is currently trending or moving sideways . It does not predict direction but provides a measure of market consolidation or expansion, making it suitable for context-bas

ADR Pro — Auto Adaptive Daily Range & Volatility Indicator (ATR + ADR + Alerts) Auto Adaptation. All Markets. No Guesswork .
Enhance your trading decisions with precise ADR levels — for Forex, Crypto, Stocks, Indices, Metals, Energy, Commodities, and ETFs.
Easy Setup Professional Features Lifetime Free Updates ADR Pro is your personal "volatility compass" that shows the real daily range boundaries for any asset. Forget manual calculations and constant parameter adjustments — the indicator

FVG MASTER Indicator — Smart Money Gaps with Trend, Momentum & Session-Aware Alerts Unlock the Power of Smart Money with Precise Gap Detection Gaps happen all the time — but only a select few matter. The Fair Value Gap (FVG) Indicator is engineered to pinpoint high-probability Fair Value Gaps that align with market structure, trend, and momentum. Using advanced filtering techniques like MACD, ADX (60 angle), and user-defined trading hours, this tool ensures you only get the most meaningful and

Add Logo Watermark – Showcase Your Signals with Clarity This indicator allows you to display a clean and customizable watermark on your chart, helping your audience easily identify what symbol you're currently trading. Display the current symbol as a watermark
Add current symbol text and customize its color
Choose to show only the logo, only the symbol, or both
Add your own custom watermark by placing custom.bmp in the MQL5 > Files directory Perfect for signal providers, educators, and
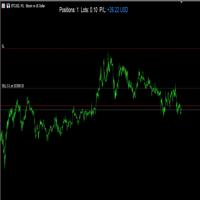
Live P/L Display – Real-time Position Summary
This indicator displays a clean and customizable summary of your current trading position directly on the chart. It shows: Number of open positions Total lot size Real-time profit/loss in USD
The profit/loss section is color-coded: Blue when in profit Red when in loss
Users can freely adjust: Font size X and Y position on the screen Text color for labels Display on/off toggles for each section
Perfect for scalpers and intraday traders w

このインジケーターは、価格統合ゾーン(市場が横ばいになっているとき)を識別し、チャート上に視覚的なチャネルを描画して、ブレイクアウト ポイントを強調表示します。 2 本の水平線が描かれた長方形 (ボックス) が表示されます。1 本は上部 (レジスタンス)、もう 1 本は下部 (サポート) にあります。新しいチャネルが形成されるとすぐに、インジケーターは以前のチャネルを消去し、最新のチャネルのみを表示するため、チャートが整理され、分析しやすくなります。
利点: 視覚的な明瞭さ: 最後のブレイクアウト チャネルのみを表示し、視覚的な混乱を回避します。
ノイズなし: クリアなブレイクアウト セットアップに重点を置きたい場合に最適です。
カスタマイズ可能: 色、キャンドルの数、最小チャネル サイズを調整できます。
軽量かつ高速:バッファなしで動作し、MT5 のパフォーマンスに影響を与えません。

Ultra Band is a trend indicator designed for various type of traders ranging from Scalp to Long Term trader. Because it include the current bar price into the calculation, it looks like the repainting only after the bar closed then it's there forever. Strategy of choices for trading the Ultra Band: BUY at the Lower Band / SELL at the Upper Band then exit when price hit the opposite Band. SELL after retracement into Bearish cloud trend or touching the Upper Band, then target the most recent Low B

Vindicator Scope – Elite Scalping Indicator for MT5 Price: $195.00| Platform: MetaTrader 5 | License: Lifetime | Timeframes: M1–M15 recommended
Works On: Forex, Indices, Crypto, Synthetic Indices Precision. Speed. Structure. Vindicator Scope is your go-to weapon for intraday domination. Designed for scalpers and aggressive day traders, this indicator uses a unique partitioning system to dissect market behavior into actionable insight. No more chasing false breakouts or second-guessing price z

The StrobeIndicatorDynamic is the indicator counterpart to the Strobe Expert Advisor, delivering a sophisticated trading strategy that generates precise entry signals through the integration of multiple technical indicators. Designed for MetaTrader 5, this advanced tool combines robust analytical capabilities with a streamlined user experience, catering to traders seeking both performance and ease of use. Key Features: Optimized Input Presets : Features a simplified input structure with five dis
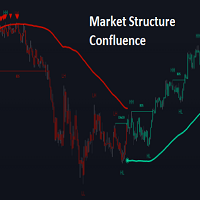
OVERVIEW
This script is called "Market Structure Confluence" and it combines classic market structure analysis with a dynamic volatility-based band system to detect shifts in trend and momentum more reliably. It tracks key swing points (higher highs, higher lows, lower highs, lower lows) to define the trend, then overlays a basis and ATR-smoothed volatility bands to catch rejection signals and highlight potential inflection points in the market.
CONCEPTS
Market structure is the foundation
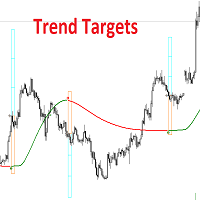
OVERVIEW
This script combines a smoothed trend-following model with dynamic price rejection logic and ATR-based target projection to give traders a complete visual framework for trading trend continuations. It overlays on price and automatically detects potential trend shifts, confirms rejections near dynamic support/resistance, and displays calculated stop-loss and take-profit levels to support structured risk-reward management. Unlike traditional indicators that only show trend direction or s

Price Alerts - Advanced Price Target Notifications
Never miss important price levels again! Price Alert Pro lets traders:
• Set unlimited price target alerts • Receive instant desktop and mobile notifications • Visually track progress to each target • Customize alert sounds and frequencies • Manage all alerts from an intuitive panel
Perfect for: - Breakout traders waiting for key levels - News traders monitoring reaction points - Position traders managing multiple targets - All traders who c

[Ai] Autonomic computing is an intelligent computing approach that autonomously carries out robotic and interactive applications based on goal- and inference-driven mechanisms. 「IB ToolTip X」は、真剣なプロトレーダーの味方となるよう設計されたプレミアムインジケーターです。マルチペア分析を含むあらゆる通貨ペアについて、専門家の洞察をワンストップで提供します。高度な「WYSIWYG」ビジュアルで、初心者から経験豊富なトレーダーまで、退屈な理論を必要とせず、「サブリミナル」メソッドで誰でも簡単に使いこなすことができます。 この「ツールチップ」インジケーターは、取引のための超スマートなアシスタントとして機能し、堅実な計画を作成するのに役立つ貴重な情報を提供します。 これが何をするかは以下の通りです: - 重要な情報を提供することで、トレーダーがより良い意思決定を行うのに役立ちます。 - 数百の自律アル
Clarity Pulse Detector
Clarity Pulse Detector、将確定されたローソク足と対応する出来高バーを分析し、将来のデータに依存せずに真のトレンド転換を識別します。インジケーターは、構成可能なSSP(Signal Strength Parameter)設定に基づいてパルス強度を計算し、直近の高値と安値を比較してブレイクアウトポイントを検出します。
必要な条件が確定したローソク足で満たされると、ツールはそのローソク足に明確な買いまたは売りのマーカーをプロットします。すべての計算は確定したローソク足上で行われるため、過去のシグナルに誤った調整が行われることはありません。
Signal
有効な反転が検出されると、インジケーターは買いシグナルとして強気ローソク足の下に緑色の円を表示し、売りシグナルとして弱気ローソク足の上に赤色の円を表示します。
これらのマーカーはローソク足の確定時に正確に表示されるため、次の始値で迷わずエントリーできます。すべての矢印および円は確定したローソク足にプロットされるため、一度表示されたシグナルが移動したり消えたりするこ
Single TF SR Pro – Support and Resistance Indicator Single TF SR Pro is a technical analysis tool that automatically detects and displays key support and resistance levels on the chart based on local price extremums. The indicator is designed to work on a selected timeframe and shows only significant levels that appear repeatedly. Key Features Extremum- based level detection — the indicator identifies local highs and lows in historical price data, which are then grouped into common level
Overview The Williams Fractals Indicator is a powerful technical analysis tool designed to identify potential reversal points in the market. This optimized version features enhanced visualization and advanced filtering capabilities that help traders identify higher -quality fractal signals .
What Are Fractals? Williams Fractals identify specific chart patterns where a central high (or low) point is surrounded by lower highs (or higher lows) on both sides. These formations

KT Gaussian Trend Filter は、ガウスフィルターと線形回帰スムージングを組み合わせることで、明確かつ正確なトレンド分析を実現します。わかりやすい買いと売りのシグナルを生成しながら、市場の長期的な方向性を効果的に示します。
機能
カスタマイズ可能なガウスフィルター: 期間やポール設定を調整してスムージング精度を高め、トレンドの明瞭さを向上。 線形回帰による強化: ガウススムージングをさらに最適化し、市場のノイズによる誤信号を最小限に抑えます。 マルチタイムフレームスキャナー: 複数の時間軸におけるガウストレンドの方向を自動検出し、わかりやすいダッシュボードに表示します。 トレーリングバンド機能: トレンド中の深い押し目でのエントリーポイントを簡単に把握可能。 カラーカスタマイズ対応: チャートの配色や取引スタイルに合わせて色を自由に設定できます。 内蔵アラート機能: ポップアップ、メール、プッシュ通知、サウンドアラートで即時通知を受け取れます。
使い方 このインジケーターは明確なシグナルを提供し、トレーダーがエントリーやエグジットのタイミングを判断しやすくします
KT Trend Reversal Probability は、改良された RSI ベースのアルゴリズムを使用して、トレンド反転の確率をリアルタイムで計算します。この確率は明確なパーセンテージで表示され、現在のトレンドが弱まっているのか、それとも新たなトレンドが形成されつつあるのかを判断する助けになります。 エントリータイミングの計画や、エグジットの最適化など、どの場面でもこのインジケーターは、データに基づいた優位性をあなたのトレーディングに提供します。
特徴
振動系に直接、明確な反転確率(%)を表示し、トレーダーが事前にトレンドの変化を予測するのに役立ちます。 高速と低速の RSI シグナルを組み合わせた独自のオシレーターを採用し、最小限のラグで反転の可能性を検出します。 直感的なカラーフィルター(グラデーション)を使って反転の強弱を視覚的に表現し、一目で状況を把握できます。 反転の確率が重要な水準に達したとき、または新しいトレンドが始まる兆候が現れたときにアラートを送信し、大きな市場変化を見逃さないようサポートします。 オシレーターの期間や確率のしきい値など、すべてを自由にカス
Take your Boom trading to the next level with the DC Dynamic Scalping Indicator for Boom , engineered specifically for precision scalping and small account growth. This powerful, non-repainting indicator is designed to catch short-term selling opportunities on Boom indices, backed by our proprietary Dynamic Trend Filter that ensures you always trade in the direction of the prevailing trend. With a built-in blue background template , your charts are clean, focused, and ready for action. Key Fe
Unlock profitable buy setups with the DC Dynamic Scalping Indicator for Crash , purpose-built for consistent scalping and small account growth. This expertly crafted, non-repainting indicator detects optimal buy signals on Crash indices , ensuring you're in sync with the trend thanks to the built-in Dynamic Trend Filter . A clean blue background template is also included for seamless charting and visual clarity. Key Features: Trend-Based Signal Logic – The Dynamic Trend Filter ensures all b

Sentiment Market Indicator: Real-Time Trading Insights Introducing our advanced Market Sentiment Indicator - your window into the live pulse of the market! This powerful MQL5 tool displays real-time buy/sell sentiment directly on your chart, giving you a crucial edge in your trading decisions. Key Features: Live buy/sell sentiment percentage visualization Customizable alert system for sentiment thresholds Smart alerts that trigger when buy or sell percentages reach your specified levels Fully co
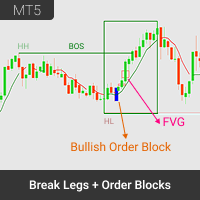
概要 Break Legs and Order Block Finder は、MetaTrader 5 向けの最先端マーケットストラクチャーインジケーターです。スマートマネートレーダー、構造ベースのトレーダー、そして機関投資家スタイルの戦略に最適化されています。 BOS(Break of Structure) 、 MSS(Market Structure Shift) 、 FVG(Fair Value Gap) 、 OB(Order Block) などの重要な市場イベントを自動的にチャート上に視覚化します。プロフェッショナルおよび本気の個人トレーダーのために設計されたこのツールは、リアルタイムで明確な視認性を提供し、重要な構造変化と高確率ゾーンを正確に特定することで、自信あるトレード判断を可能にします。 主な機能 マルチスイングピボット検出: カスタマイズ可能なピボット長により、高値・安値のスイングを自動検出。マーケットストラクチャーを多視点から分析でき、全体の流れと直近のセットアップを両立。 BOS & MSS 検出: チャート上に BOS と MSS の発生を明確に表示。トレンド継

Unlock precision trading with the FVG MUSKX MTF —a next-generation tool engineered to transform your market analysis on MetaTrader 5. Designed with accuracy and usability in mind, this powerful indicator identifies Fair Value Gaps (FVGs) across multiple timeframes, giving traders a clear advantage in spotting institutional footprints and potential price imbalances. Key Features Sharp FVG Detection
Detect Fair Value Gaps with high precision across selected timeframes. Never miss a critical

Malaysian SnR Pro: Advanced Multi-Timeframe Support & Resistance Indicator Professional Support & Resistance Detection with Top-Down Analysis Malaysian SnR Pro is a comprehensive support and resistance indicator that implements advanced price analysis techniques used by institutional traders.
Using a sophisticated multi-timeframe approach, it identifies key market levels with precision and filters out market noise to reveal the most significant trading opportunities.
Key Features • Six Differe

The EMA Signal Display is a non-repainting, multi-EMA crossover indicator that visually tracks market trend changes using three exponential moving averages (EMAs): Fast EMA (7-period) Medium EMA (21-period) Slow EMA (50-period)
It automatically detects momentum shifts and plots BUY / SELL arrows directly on the chart when strong alignment occurs:
Signal Logic: BUY Signal: EMA 7 crosses above EMA 21, and both are above EMA 50 SELL Signal: EMA 7 crosses below EMA 21, and both are below EMA 50

PMAX - Profit Maximizer Indicator for MetaTrader 5 A high-performance trend-following indicator inspired by the original TradingView version by @KivancOzbilgic. This indicator combines a moving average with ATR-based dynamic bands to create a precise, responsive trend system. It is designed to help traders detect early entries, stay in profitable trends longer, and avoid false breakouts. Key Features Fully adjustable MA type (EMA, SMA, SMMA, LWMA) Built-in ATR normalization for better

Phantom Bands – MT5 Indicator Zone-Based Reaction Levels for Price Action Traders Phantom Bands is a MetaTrader 5 custom indicator that draws multiple adaptive bands on your chart. These levels are designed to assist traders in identifying potential price interaction zones based on internal logic — particularly useful for short-term discretionary strategies. Description This indicator creates zone-based bands around internal pivots. The logic behind the bands is based on price interaction

Kecia MA Pro is engineered to transform your technical analysis capabilities by providing insight into market trends and price dynamics. Unlike standard moving average indicators that limit you to a single analysis approach, this advanced suite delivers 15 specialized MA methodologies within one powerful tool, giving you a comprehensive view of market conditions from multiple analytical perspectives. What sets this indicator apart is its ability to adapt to various market conditions through its

Enhanced Bull-Bear Power Indicator Description The Enhanced Bull-Bear Power Indicator is a custom technical analysis tool designed for MetaTrader 5. It provides a visual representation of the relative strength between bullish and bearish market forces over a user-defined period. By calculating the average percentage change for bullish and bearish bars, the indicator computes a strength ratio that helps traders identify prevailing market sentiment. Features
User-adjustable period for calculatio

Kecia Ichimoku Pro is engineered to transform your technical analysis capabilities by providing deep insight into market dynamics through an enhanced implementation of the Ichimoku Cloud system. Unlike standard Ichimoku indicators that limit you to a single presentation style, this advanced suite delivers 10 specialized visualization methodologies within one powerful tool, giving you a comprehensive view of market conditions from multiple analytical perspectives. What sets this indicator apart i
ローソク足残り時間インジケーター – プロ仕様のタイミングツール
このインジケーターは、現在のローソク足が終了するまでに残された時間を正確に表示する高性能なタイミング補助ツールです。時間軸(タイムフレーム)に関係なく、1分足から日足まであらゆるチャート上で使用可能です。
主な機能: - MetaTraderの言語設定に基づいて自動的に日本語表示を切り替え - 残り時間をリアルタイムでカウントダウン表示(00:00形式) - 残り時間に応じた色分け表示(30秒以上=緑、10~30秒=オレンジ、10秒未満=赤) - すべてのチャート商品(FX、株価指数、暗号資産など)に対応 - チャート上にラベルエラーが出ない即時描画処理 - 軽量設計でMT5のパフォーマンスに影響を与えない
このインジケーターは、スキャルパーや短期トレーダーにとって特に有効です。ローソク足の切り替わりタイミングを把握することで、エントリーとエグジットのタイミングをより正確に捉えることができ、ローソク足の形状パターン形成時にも役立ちます。
たとえば、価格反発を狙う際に新しいローソク足が始まるタイミングを事前

Indicator Name: Fibaction – price action candle Detector Description:
Fibo Signal Boxes is a powerful Smart Money Concept (SMC)-inspired indicator that auto-detects price action candles. bullish hammers and shooting stars, then draws precise Fibonacci entry zones and multiple take-profit levels directly on the chart. as for the SL personally i use 40 pips rules Key Features: Detects bullish hammer and shooting star reversal candles. Automatically draws Fibonacci entry and TP boxes. as
Optimus Time Tracker Indicator User Manual Integrating The Optimus Time Tracker Indicator With Trading Generally: Boosting Precision & Perfomance
The market and trading revolve around the concept of probabilities for certain outcomes, which—when favorable—translate into profitable trades for the speculator. However, how do we quantify probabilities if we are not equipped with data and statistics from the various important segments of the market?
Maintaining the concept of the union of the X a

NOTE: Turn Pattern Scan ON
This indicator identifies Swing Points, Break of Structure (BoS), Change of Character (CHoCH), Contraction and Expansion patterns which are plotted on the charts It also comes with Alerts & Mobile notifications so that you do not miss any trades. It can be used on all trading instruments and on all timeframes. The non-repaint feature makes it particularly useful in backtesting and developing profitable trading models. The depth can be adjusted to filter swing points.

TradeJournal Plus:自動セッションレポート & 内蔵PnLインジケーター 本格トレーダーのための究極の自動トレーディング日誌。
すべてのセッションを自動記録、ワンクリックで詳細レポートをエクスポート、さらにリアルタイムで利益状況を常に確認可能。
取引記録を次のレベルへ — 分析・見直し・改善をすべてこのツールで。 期間限定価格:$30! 主な利点: 自動トレードジャーナル :手動スプレッドシートは不要。エントリーから決済まで、すべてを自動で記録。 セッションレポート自動生成 :トレード終了後、構造化されたCSVレポートを即時作成。戦略の見直しに最適。 リアルタイムPnLインジケーター :現在のセッション利益率(%)をチャート上で常時表示。 包括的な分析機能 :セッション時間、取引回数、損益、ドローダウンなどの指標を自動追跡。 簡単セットアップ :MT5チャートに適用するだけ。軽量設計でパフォーマンスへの影響も最小限。 高度な見直しツール :アクティブトレーダーや記録を本格的に行いたい方に最適。 使い方: 任意のMT5チャートにインジケーターを追加。 ポジションを開くとロ
Ay Signal Trend Indicator
トレンドサイン発生インディケーター
ノンリペイント・リアルタイムトレンドサイン搭載! BTCUSD、XAUUSD、USDJPY、GBPJPYほか主要FX/CFD対応。 「Ay Signal式」独自アルゴリズムで、だましや無駄エントリーを最小化。 高ボラティリティ相場(ビットコイン/ゴールド/クロス円)に強い! サイン発生は矢印+ドットで直感的に分かりやすい色分け設計 M1チャート専用・スキャル・デイトレ対応 エントリー~決済は平均10分以内の高速完結型 ノンリペイント方式でサインは絶対に後出しなし 売買サイン同時表示で順張り・逆張り両対応 サイン発生時にメール通知機能付き ツールチップ表示で詳細解説 複数通貨ペア同時利用OK
[使い方]
M1チャートに挿入するだけ。 あとはサイン通りにエントリー&決済!
[こんな方におすすめ] スキャルピング、デイトレ好き 急変動でもだましの少ないインジを探している ゴールド/ビットコイン/クロス円で安定したシグナルが欲しい方

This powerful tool spots high-probability trades on major forex pairs (M1 timeframe). It shows clear buy/sell signals (green/blue arrows) and automatically sets profit targets & stop losses for stress-free trading. Key Features:
Clear non-repainting signals (green buy/blue sell arrows)
Auto TP/SL levels for every trade
Instant alerts (push, email, sound)
Works on 1-minute charts for fast opportunities
Covers all major forex pairs : XAUUSD, EURUSD, NZDUSD,
MFI Multi-Scanner Indicator for MT5
The MFI Multi-Scanner Indicator is designed for automatic scanning of multiple currency pairs and timeframes to detect overbought and oversold signals using the Money Flow Index (MFI). It displays MFI values, signal arrows, and an interactive on-chart table. Ideal for traders who want to see the full market picture without constantly switching between windows. Performance Recommendations
For maximum speed and fast testing, it is recommended to: Run the i

トレードパスインジケーター – アルゴリズムによる価格アクションのビジュアルフレームワーク Trade Path は、 アルゴリズム取引戦略の意思決定ポイントを明らかにするために設計されたプロフェッショナル グレードのインジケーターです。 アルゴリズムが最も活発に活動する場所(エントリーゾーン、ストップレベル、反転ポイントの可能性)をマッピングし、手動トレーダーに市場の動向を構造化したビューを提供します。
コアコンポーネントの説明: シグナルライン(アクティブ解析) 現在のアルゴリズム戦略がシグナルを生成する正確なテクニカル分析レベルを表示します 現時点でアルゴリズムが従っている支配的な技術的バイアスを表す トリガー価格(黄色の線) 臨界価格レベル: アクティブアルゴリズム戦略はポジション(ブレイクアウト注文)を開始する 同時に、反対のアルゴリズム戦略のストップロスレベルとして機能する これにより、競合するアルゴリズムが相互作用する流動性ゾーンが生まれます ストップロスレベル(静的および動的) 以下を表します: 現在のアルゴリズム戦略のストップロスポイント 価格が反転した場合、反対の
The Sigma Level Analyzer is a trading indicator designed to visualize market structure, volatility breakout levels, and post-breakout price behavior during the three major trading sessions (Asia, London, New York). It is ideal for traders who want to: Identify session-based price ranges Detect breakouts and measure reaction/extents Improve precision in session-specific strategies
Key Features Session Detection: Auto-identifies and labels Asia, London, and New York sessions. Range Highlighting:

The indicator is designed to display information about current trading. The current information and statistics panel displays data on the number of trading orders, their profit and the number of lots. The equity status as a percentage of the balance of funds and the total profit of all orders on this instrument are also displayed. In the statistics panel, you can see information on closed orders from the beginning of the specified date in the settings. The panels have flexible size and color se

Catch boom spikes like a pro – before they happen! The KarooSpikes Boom Spike Catcher is a powerful MetaTrader 5 indicator designed for traders who want to consistently catch spikes on Boom with precision and confidence. What This Indicator Does: Detects high-probability spike zones using a combination of: RSI + Stochastic crossovers Price action 50 EMA trend filter Plots clear BUY arrows on your chart when spike conditions are met Sends instant mobile + sound alerts so you never miss a
A simple indicator that changes color according to trend direction and marks each turn with an arrow and optional sound alert. Features Dual-Color Blue when the line is rising Red when the line is falling Arrow Signals Up-arrow at the start of an up-trend Down-arrow at the start of a down-trend Configurable Alerts Popup notification on each closed-bar trend change Optional custom WAV file (leave blank to use the MT5 default) Alerts fire once per closed bar to avoid repeats Native MQL5 Implem

VolMoPulse – モメンタムと出来高に基づく取引シグナル 強いトレンドを早期に捉え、反転前に枯渇を察知しましょう! ボルモパルス MetaTraderインジケーターは、強調するために設計されています 高いモメンタムの価格変動 明確な視覚信号と組み合わせることで ボリュームの強さ そして 価格の勢いは 、トレーダーが 爆発的なトレンドの始まり そして警告する 潜在的な逆転 市場が転換するとき。 主な機能: 明確な勢いのシグナル – 強い買い/売り圧力を視覚化する。
ボリュームによる確認 – ボリューム分析により誤ったブレイクアウトをフィルタリングします。
トレンド枯渇検出 – 勢いが衰えてきたときに警告し、出口の機会を知らせます。
簡単に見つけられる – 複雑な解釈がないので、素早い取引に最適です。 仕組み: グリーンゾーン =強い 強気の勢い (出来高は上昇傾向を裏付けている)。 レッドゾーン =強い 弱気の勢い (
The SyntheticaFX Pain & Gain Spike Indicator is a specialized tool designed to identify potential spike opportunities in the market, exclusively for traders focusing on Weltrade Pain and Gain pairs. This indicator is optimized to operate on the 1-minute (M1), 2-minute (M2), 3-minute (M3), and 5-minute (M5) timeframes and supports only the following pairs: PainX 1200, PainX 999, PainX 800, PainX 600, PainX 400, GainX 1200, GainX 999, GainX 800, GainX 600, and GainX 400. It will not display signal
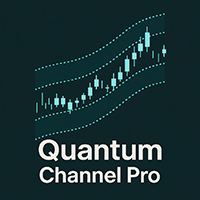
Quantum Channel Pro は、価格トレンド、反転ポイント、市場ノイズを高精度で識別するための革新的なマルチチャネルボラティリティ分析ツールです。適応型標準偏差チャネル技術を採用し、3つの価格帯(内側、中間、外側)を動的に描画することで、トレーダーが市場の状態を視覚的に把握し、高確率な取引機会を捉えることを可能にします。 主な特徴 3段階スマートチャネル 内側チャネル(緑色) : 1σ変動幅、「通常波動ゾーン」を示す 中間チャネル(橙色) : 2σ変動幅、「潜在的反転ゾーン」を示す 外側チャネル(赤色) : 3σ変動幅、「過買い・過売り警戒ゾーン」を示す リアルタイム確率統計
独自の「ゾーン分析システム」が各チャネル内での価格出現頻度を自動計算し、以下を表示: 内側チャネル確率(平常市場) 中/外側チャネル確率(トレンド加速期) 外側チャネル突破確率(極端な反転シグナル) 適応型マーケットノイズフィルタリング
動的に調整される標準偏差計算により、通貨ペア、株式、暗号資産など異なる資産の変動特性に自動適応し、偽信号を削減。 マルチタイムフレーム対応
デフォルト設定(2

Индикатор не перерисовывается так как использует сложную систему расчета. Индикатор послужит вам для принятия решений хеджированный сделок между коррелирующими инструментами, например между GBPUSD и EURUSD, на скриншоте показано где принять решения для открытия и закрытия сделок, верхний нижний канал для открытия сделок на покупку и продажу, и средняя линия для закрытия сделок, можете создать на основе индикатора стратегию с минимальным риском
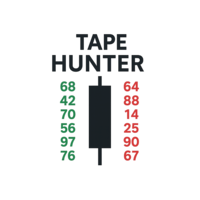
Tape Hunter – MT5で努力と結果を見極めるレーダー Tape Hunterは、MetaTrader 5で価格の裏にある真実の動きを見たいトレーダーのための究極のインジケーターです。POC(ポイント・オブ・コントロール)に基づく買いと売りのアグレッシブな出来高を明確かつ直感的に表示し、各ローソク足の市場の努力と実際の結果を視覚化します。 ️ なぜ重要なのか?
すべての出来高が価格を動かすわけではありません!Tape Hunterは、努力(アグレッシブな出来高)が価格を本当に動かしているかを示し、以下を見極めるのに役立ちます: 本当のアグレッションとトラップの位置 市場が吸収されているのか押し込まれているのか 支配的な出来高と価格の方向性の一致 Tape Hunterを使えば、プロのテープリーディング視点を得て、より精度の高いエントリーとエグジットの判断が可能になります。 関連インジケーター – フロー分析を強化 より効率的なトレードのために、Tape Hunterと以下の強力なインジケーターを組み合わせて使いましょう: Big Player

MacD Power Trend — Multi-Timeframe, Color MACD Indicator Designed to help you avoid missing the most critical turning points in the market. Not a simple indicator, it speeds up the decision-making process for both novice and professional traders with its customizable color palette, multi-timeframe support, and clear visual signals. • Multi-Timeframe Support – Track 1-hour, 4-hour, daily, and more beyond your main chart with just one click. • Dynamic Color Coding – MACD line and histogram bars a
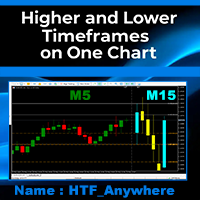
============================================== UNLOCK THE ULTIMATE TRADING EDGE: MULTI-TIMEFRAME ON ONE CHART FOR MT5!
=========================================
FINALLY, THE IMPOSSIBLE IS HERE! Traders, imagine seeing ANY higher timeframe directly on your current chart —without switching screens, without missing a beat. What if you could analyze the daily trend on a 5-minute chart , or spot weekly key levels while trading the 1H on the exact same chart?
INTRODUCING HTF Anywhere,
Alpha Indicator – Precision Trading for Every Market Trade Smarter, Not Harder.
The Alpha Indicator is a non-repainting, high-accuracy trading tool designed for serious traders across all styles — scalping, day trading, and swing trading. Whether you're on Forex, Gold, Crypto, NAS100, GER30, or Deriv Synthetic Indices like Volatility, Boom & Crash, this indicator adapts to your market and strategy. It combines powerful components: Alpha Trend Filter – confirms bullish or bearish momentum
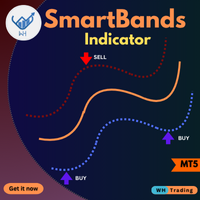
SmartBand is a powerful indicator designed to identify high-probability trade zones using a central reference line and dynamic upper and lower bands. When price reaches one of the bands,
and evaluates specific built-in conditions to trigger precise buy or sell signals — helping you spot potential reversals or breakouts with confidence. *Contact me after purchase for best guide* Key Features: Dynamic Band Structure : Central line with upper and lower bands adapting to price action. Smart Sig

Click2FiboDrawer – 2クリックで即描画、裁量トレーダーのためのフィボナッチ補助ツール Click2FiboDrawer は、裁量トレードを重視する方向けに設計された、
フィボナッチ・リトレースメント(Fibonacci retracement)描画専用のインジケーター です。 [fibo]をクリックしチャート上で始点と終点わずか2回クリックするだけで、美しいFibonacciラインを瞬時に描画できます。 スキャルピングのような高速判断が求められるトレードでも、「Fibo」ボタンを押せば2クリックで即座にFibonacci retracementを引くことができ、
エントリーチャンスを逃しません。 主な機能: チャート上で 2クリックだけでFibonacci retracementを描画 作成順に 1本ずつ削除できるDeleteボタン すべてのFiboを安全に一括削除できるClear Allボタン ラインやラベルの色を チャート背景に合わせて自由にカスタマイズ可能 あらゆるチャート背景でも高い視認性 シンプルで直感的なボタンUI(表示位置や色も調整可能) 仕
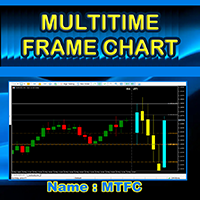
MTFC (Multi Timeframe Chart) – See 2 Timeframes on ONE Chart!
"Trade Smarter, Not Harder – Eliminate Timeframe Switching Forever!" Imagine having the power to see any higher timeframe (M5, M15, H1, H4, D1, MN1, etc.) directly on your current chart. No more flipping between charts, no more guesswork—just pure trading clarity in one place. That’s exactly what the MTFC Indicator delivers! 1. The Problem It Solves As traders, we know context is king . But constantly switching between c
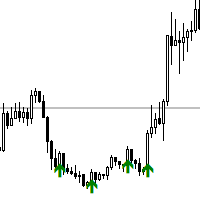
NOTE: Turn Pattern Scan ON
This indicator identifies 11 candlestick patterns, filters them to generate trading signals which do not repaint. This signal are supposed to be high probability setups. It also comes with Alerts & Mobile notifications so that you do not miss any trades. It can be used on all trading instruments and on all timeframes. The non-repaint feature makes it particularly useful in backtesting and developing profitable trading models

What is it? Supreme Trend Pro is an exclusive indicator for MetaTrader 5 that analyzes the current trend using a precise combination of three of the most respected indicators on the market: ️ Moving Averages (MA) ️ MACD ️ ADX
It clearly and visually identifies: When the market is favorable for Buying When it is favorable for Selling When it is still in Analysis / Waiting Features: Chart panel with information: — Trend (Bullish, Bearish, Neutral) — MA status, MACD and ADX strength —

Supreme Multi TF Pro is an advanced indicator for MetaTrader 5 that automatically analyzes multiple timeframes — from M1 to Monthly — using a combination of MA, MACD, and ADX. It clearly displays signals for Buy , Sell , or Hold on each timeframe, and highlights the Best Timeframe to trade . Perfect for traders seeking fast and reliable decisions, with intuitive and color-coded panels. Customize parameters to fit your strategy and trade with greater confidence.

APICT Chart Patterns – AI-Powered Trend Line & Pattern Recognition for MT5 Unlock the power of automated pattern recognition and trend line analysis with the APICT Chart Patterns Indicator an intelligent tool designed to enhance your technical analysis workflow on MetaTrader 5. Key Features AI-Powered Pattern Detection : Automatically identifies over 10 classic chart patterns including pennants, wedges, channels, double tops/bottoms, and more. Real-Time Trend Lines : Instantly draws support
Real Volume N1 – Accurate Volume Insight for Every Candle
The Real Volume N1 indicator works with both real volumes and tick volumes. However, I highly recommend using real volumes only, as tick volumes cannot reliably indicate how much was actually bought or sold.
To get the most accurate results, use this indicator with brokers that provide real volume data, Works on any timeframe from m1 to month
On every candle, the indicator displays the exact volume, helping professional traders make i

ICT Order Blocks Premium Indicator Professional Market Structure Analysis Based on ICT Methodology OrderBlocks ICT is an advanced technical analysis tool that identifies high-probability trading zones based on the Inner Circle Trader (ICT) methodology. This professional-grade indicator detects key market turning points using institutional order block analysis, revealing where smart money is likely accumulating positions. Key Features: Smart Filtering Technology : Eliminates weak and insignific

Indicator Name: Auto Trend Line Description: Automatically draws trend lines with optimized and enhanced trend direction detection. Main Features: 1. Automatic Trend Line Drawing: Two main lines are plotted: Support Line – color: Magenta Resistance Line – color: Cyan Lines are calculated based on: Two extremums (highs/lows) or an extremum and a delta (custom offset) 2. Trend Direction Detection: The indicator determines the current trend as: TREND_UP (Uptrend value = 1) TREND_DOWN (Downtrend val

Un potente indicatore multifunzione progettato per offrire una visione chiara e strutturata della forza del mercato, integrando tre strumenti tecnici in un'unica interfaccia intuitiva: Caratteristiche principali: Heikin Ashi RSI Normalizzato Calcolato sul RSI di medie Heikin Ashi, centrato su una scala da -50 a +50 Visualizzazione con candele colorate (blu/rosso) per una lettura chiara della direzione e del momentum Stocastico Modificato %K e %D convertiti sulla stessa scala -50/+50 Opzio

Questo indicatore avanzato disegna automaticamente pivot High/Low e trendline su un timeframe selezionato (es. H4, D1, ecc.) e li rende visibili su tutti i timeframe inferiori. L'obiettivo principale è fornire un contesto strutturale multi-timeframe unito a segnali di tocco sulle trendline. Caratteristiche principali: Trendline Automatiche : Disegnate tra i pivot High e Low rilevati sul timeframe selezionato.
Classificate in trendline rialziste (UpTrend), ribassiste (DownTrend) e rotte (B
MetaTraderプラットフォームのためのアプリのストアであるMetaTraderアプリストアで自動売買ロボットを購入する方法をご覧ください。
MQL5.community支払いシステムでは、PayPalや銀行カードおよび人気の支払いシステムを通してトランザクションをすることができます。ご満足いただけるように購入前に自動売買ロボットをテストすることを強くお勧めします。
取引の機会を逃しています。
- 無料取引アプリ
- 8千を超えるシグナルをコピー
- 金融ニュースで金融マーケットを探索
新規登録
ログイン