YouTubeにあるマーケットチュートリアルビデオをご覧ください
ロボットや指標を購入する
仮想ホスティングで
EAを実行
EAを実行
ロボットや指標を購入前にテストする
マーケットで収入を得る
販売のためにプロダクトをプレゼンテーションする方法
MetaTrader 5のためのエキスパートアドバイザーとインディケータ - 90

Demo copier of deals from MetaTrader 5 to MetaTrader 5 ( MetaTrader 4<->MetaTrader 4 version is available ; with both versions, you can copy MetaTrader 5<->MetaTrader 4, MetaTrader 4<->MetaTrader 5, MetaTrader 5<->MetaTrader 5, MetaTrader 4<->MetaTrader 4). Works only in the mode of hedging. Spread filter. Select the best price (start copying positions with a profit or loss). Configure the lot size, fixed or ratio-based (provider signals can be copied with an increased lot). Configure order copy
FREE

This utility is the demo version of the Binance Full Trader. This version is provided so the customers can test performance and options of the main version. · This version has these restrictions: 1. Only BTCUSDT is available for price chart and Test Mode. 2. The Real Mode is not accessible. 3. The LIMIT and STOPLOSSLIMIT are not accessible. 4. The Indicator mode is not accessible. · The full version and the instruction of use can be downloadable from t
FREE

My Trading History is a very useful tool for traders to know in which currency pairs, metals, indices, crypto currencies are good for trading , because this tool get all orders that made by you or EA's and organize them by symbols and tell you number of orders that you or EAs made per each symbol and show Portfolio for each symbol
You can customize the dashboard and the dashboard location on the chart as you like.
FREE

Basket Close – Your Smart Trading Assistant for the Perfect Exit!
The Basket Close EA is the ideal solution for traders who want to efficiently manage their open positions. This simple Expert Advisor allows you to close all open positions simultaneously based on a predefined profit or loss target.
Automated Risk Management – Closes all positions as soon as a specific profit or loss (in percentage of the account balance) is reached.
Efficient Trade Control – No more manual monitoring or
FREE

This is a utility created to ease charts watching on tablet PCs. The indicator allows you automatically alternately display "slide show" of all currency charts from "MarketWatch". The user can set the display time interval (in seconds) between charts in indicator settings. In addition, there is an option of selecting the angle of Start/Stop button which starts and stops the display of charts. This function is very useful if a trader noticed a trading signal and would like to study it in more det
FREE
The script removes all of the indicators on the chart with one movement of the hand. There are situations when there are too many indicators on the chart. And it is required to delete all of them without closing the tab. Unfortunately, the settings window doesn't allow us to select all indicators at once and we have to delete one by one. This script will solve this problem. Simply drag the script from Navigator window onto the chart.
FREE

Assistant_for_Reopen - an Expert Advisor that helps to re-set pending orders. Many brokers force the order to expire at the end of the trading session or at the end of the trading day. Therefore, a trader has to restore all pending orders manually every time at the beginning of a new trading session. Assistant_for_Reopen frees the trader from this routine work. It controls expiration by the order expiration time and resets it if the trader ticked the checkbox. The maximum number of orders the EA
FREE

Broker Desynchronization script MT5 is a script in the form of an EA. It will check the desynchronization of a BROKER's server compared to your time at your PC.
Usually BROKER sets time forward to have some space to execute trades.
If you wish to check how big the difference is, please load the EA to any chart.
After loading, it will wait for the first tick to check the desynchronization.
Information will be available for 10 seconds.
NOTE!
If market is closed, you get information to try again la
FREE

JC通用统计脚本 JC通用统计脚本 JC通用统计脚本 JC通用统计脚本 JC通用统计脚本 JC通用统计脚本 JC通用统计脚本 JC通用统计脚本 JC通用统计脚本 JC通用统计脚本 JC通用统计脚本 JC通用统计脚本 JC通用统计脚本 JC通用统计脚本 JC通用统计脚本 JC通用统计脚本 JC通用统计脚本 JC通用统计脚本 JC通用统计脚本 JC通用统计脚本 JC通用统计脚本 JC通用统计脚本 JC通用统计脚本 JC通用统计脚本 JC通用统计脚本 JC通用统计脚本 JC通用统计脚本 JC通用统计脚本 JC通用统计脚本 JC通用统计脚本 JC通用统计脚本 JC通用统计脚本 JC通用统计脚本 JC通用统计脚本 JC通用统计脚本 JC通用统计脚本 JC通用统计脚本 JC通用统计脚本
FREE

BatchLoader for Mobile Traders: The idea of BatchLoader just as the name implies is to enable traders open a single position through their mobile phone and have it duplicated based on the max position such trader set in the "input settings", we have day traders and scalpers who find it difficult to open several position when trying to scalp, with this BatchLoader, you won't have to worry about poor entry execution.. How to Use it; *install the expert on your desired chart you usually trade on(
FREE

The Environment State Info Print is a script to display the constants that describe the current runtime environment of a MQL5 program. General Description
The constants are divided into four groups in the Environment State section of the MQL5 documentation and each group is divided into enumerations/subgroups (with designations “Integer”, “Double” or “String”). The script displays constants in two ways: a single constant or all group constants. The constants are obtained by selecting the
FREE

Demo Version of Strategy Manager Plus ! This Demo is a simply view of the Dashboard with the followings strategy : - if SMA 6 is upper than SMA 18 --> Blue color - if SMA 6 is lower than SMA 18 --> Red Color No need of the external GUI, Load configuration is not available, no manual trading is available. Visit https://www.mql5.com/en/market/product/46420 for full version !
FREE

The trade cost caused by spreads is an important indicator when formulating trade profit-loss ratios. Spread costs info is particularly important for short-term traders, especially scalping traders. This tool can output the spread cost of all Forex currencies (including XAU and XAG) in the platform in different account types (USD account, EUR account, etc.).
Calculation and code See articles: THE TRADE COST OF FOREX CURRENCY Part1 THE TRADE COST OF FOREX CURRENCY Part2 THE TRADE COST OF FOREX C
FREE

The 7 energies of the price.
it is an expert advisor analyst. it analizes the 7 energies of the price which are:
direction
momentum
fractals
cicles
support/resistance
volatility
Amplitudeness
When you have all these energies aligned you have a better understanding of the price movement.
This EA helps students who are learning technical analisys and it keeps new learners away from the bad trades.
give it a try now for free.
FREE

Simple script for Sell by Market Execution on all financial instruments.
Inputs Volume - default: 0.10 Deviation - default: 10 points Stoploss - default: 50 points Takeprofit - default: 50 points Comment - default: Order by Market Confirm - default: false
Inputs Details Type Order Sell Order is preset. Deviation Maximum deviation from quoted price in points. Stoploss & Takeprofit In points value, be careful that this value will be added to minimum stop allowed by the broker. For example if you
FREE

Quickly clear all open charts in MetaTrader 5 with a single script execution. Ideal for traders who want to reset their workspace before starting a new trading session or analysis. Implementation Notes: This script is designed to operate under strict coding standards ( #property strict ) to ensure reliability and efficiency. No user inputs are required, as it automatically processes all open charts.
FREE

Ofir blue is the first full trading application for Telegram. It is proposed in 2 versions : OfirBlueLite (without trading) and OfirBluePro (with trading). The Pro version is still in beta (available on request).
To access Ofir Blue Lite, go to Telegram and open the bot @OfirBlueLite. All demos, tutorials and docs are available in Telegram.
Join the Telegram group @OfirBlueUserGroup to get updated information and support.
Features: Dashboard ️ Account summary ️» Profit of the day ️» Eq
FREE

1-2-3 パターンは、市場で最も基本的で重要な形成です。ほぼすべての大きな市場の動きはこの形成から始まっています。1-2-3 パターンは、トレンドの反転を見つけるために使用され、次の大きなトレンドを検出できます。このパターンは、トレンドが終わりに近づき、新しいトレンドが形成されていることも示します。このパターンは、底、ピークまたは谷、および 38.2% から 71.8% の間のフィボナッチ リトレースメントの 3 つの価格ポイントで構成されます。価格が最後のピークまたは谷を超えたときにパターンが有効であるとみなされ、その時点でインジケーターが矢印をプロットし、EA が取引を行います。 推奨ペア: eurusd、audusd、gbpusd、nzdusd などのすべての主要ペア、および m15 時間枠の audcad、nzdcad、eurnzd、eurcad などのマイナー ペア。 開始時間 – EA の開始時間 開始分 – EA の開始分 終了時間 – EA の終了時間 終了分 – EA の終了分 ロット – 取引を開始する最初のロット 可変ロットの使用 – True/False –

Script for deleting pending orders If you need to delete all pending orders you placed, this script will do it for you! It doesn't have any input parameters. Allow AutoTrading before running the script. Usage:
Run the script on a chart. If you need a possibility to adjust parameters of the script, use the version with input parameters https://www.mql5.com/en/market/product/627 You can download MetaTrader 4 version here: https://www.mql5.com/en/market/product/2782
FREE

Introduction Scruffy Countdown is a utility for MT5 that displays a countdown timer based on the chart's current timeframe. As each new bar (candlestick) appears the countdown is reset. Features include: Countdown based on current chart timeframe Customisable font and size Warning before and after the hour in minutes with customisable colours (optional) About Scruffy Coder We may be scruffy in name and wear a few scruffy clothes but we're dedicated to bring you useful and reliable tools for MT5
FREE
This indicator allows to hide moving average (on all MT4 timeframes) from a date define by the user with a vertical line (Alone) or a panel (with "Hidden Candles"). Indicator Inputs: MA Period MA Shift MA Method MA Apply To Information on "Moving Average" indicator is available here: https://www.metatrader4.com/en/trading-platform/help/analytics/tech_indicators/moving_average ************************************************************* Hey traders!! Give me your feeds! We are a community h
FREE
This indicator allows to hide Stochastic oscillator (on all MT5 timeframes) from a date define by the user, with a vertical line (Alone) or a panel (with "Hidden Candles"). Indicator Inputs: % K Period % D Period Slowing Apply To Method Information on "Stochastic Oscillator" indicator is available here: https://www.metatrader4.com/en/trading-platform/help/analytics/tech_indicators/stochastic_oscillator ************************************************************* Hey traders!! Give me your f
FREE

The GRat_OrderExport EA exports trades made in the MT5 (manual or any other Expert Advisor), which can later be imported by: GRat_BinanceImpor t or GRat_BybitImport or GRat_Crypto tool in order to copy trades to the crypto exchange; using the GRat Order Exchange library (in particular, by the GRat_OrderImport EA) in order to copy trades to another MT5 terminal or to another correlating symbol of the same MT5 terminal; using GRat_OrderImport (MT4) in order to copy trades to MT4 termina
FREE

The CloseByPercentLossOrProfit Expert Advisor closes all positions as the total profit of loss for the entire account reaches a specified value. The profit or loss is specified as percentage of the account balance. In addition, the Expert Advisor can delete pending orders. Allow AutoTrading before running the Expert Advisor. Instructions: Run the Expert Advisor on the chart. Input parameters: Language of messages displayed (EN, RU, DE, FR, ES) - the language of output messages (English, Russian,
FREE

Test Trade Saver Script
Application Type: Script
Application Functions: Saves test results cache file data into text files
About the Application The script extracts trading results from a test system cache file and saves them into text files for further analysis. How to Use Parameters: LOG_LEVEL - Logging level in the Experts terminal section. DEBUG provides the most detailed information, while ERROR gives the minimum. CUSTOM_MAGIC_NUMBER - The system identifier (Magic Number) used to save resu
FREE

The Market Surfer Demo is a tool for manual traders who want to trade fast markets efficiently. All trading actions, like Buy, Sell, Buy/Sell Limit/Stop, Close, switch, double, half, etc. can be done with just one click.
Features Open, close, switch, switch half, switch double, double, half, etc. position with only 1 click. Quick selection of lot size, maximum deviation, stop and target pips. Convenient overview of most account, position and risk data. Risk and Target from entry and current mar
FREE

150+ Ways to manage your trade www.marginkeys.com It is a mobile application, You can manage trade on your chart from mobile app Connect 'Margin Keys' with your Laptop/Desktop through Bluetooth Manage your trade in MT4, MT5 and cTrader 100+ Ways to manage your trade Calculate lot, SL, TP, automatically Open, modify and close your trade in 100+ ways Handle multi platform account from a single app Steps To Use : 1. Go to www.marginkeys.com , make purchase, you will get login details Use Coupo
FREE
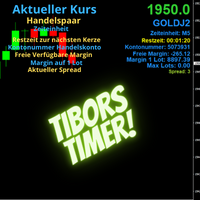
Indikator mit den Notwendigen Anzeigen im Chart - Als Expert installieren !
Dieser Indikator wurde von mir Entwickelt damit die Anzeige der relevanten Parameter klar und deutlich im Chart ist. Er dient zur Information und ist ohne Gewähr. Folgende Parameter werden angezeigt:
- Aktueller Kurs - Das Aktuelle Handelspaar - Die Restzeit zur nächsten Kerzenbildung / Zum Abschluss der Aktuellen Kerze - Die Kontonummer des Handelskontos - Die Frei Verfügbare Margin - Die Margin auf 1 Lot - Der
FREE

Hi you, I need your help! Be my Patron, let's make it possible!
https://www.patreon.com/joaopeuko https://github.com/Joaopeuko/Mql5-Python-Integration
Esse Expert Advisor copia os dados("symbol,last,bid,ask") dos ativos que foram colocados na lista e só funciona enquanto o mercado esta aberto.
Esse EA não é um link DDE ou RTD, as informações não são passadas em tempo real ao excel. O EA tem um delay de 30 segundos e o Excel tem um delay de 1 minuto.
A vantagem desse EA é que ele dispensa o
FREE

Shows various helpful informations lik: ATR (in Pips) Spread (in Pips) Spread in percent of ATR (very helpful when your SL/TP is based on ATR Time left to next candle period Change in percent of last X candles (configurable) Spread warning, when its higher then 1/3 of the ATR Next-candle warning, when it appears shortly (2.5% of period) Please follow me on Twitter https://twitter.com/semager and stay up to date with the newest Indicators and EAs.
FREE
Clean all symbols from a chart to get a better view. We all love to draw a chart, but it's hard to get the unwanted objects away that we don't need anymore. With this script, you simply remove ONLY SYMBOLS. All others will stay on the chart. In my eyes, a must-have tool in case you need to clean quick up to continue observations or strategy finding. Just pull it onto the chart.
KEEP IT GROWING! Happy Trading
FREE

This indicator displays the Daily Range of a selected pair directly on your chart, providing a clear and concise view of the pair’s movement for the day. It simplifies tracking how far a pair has moved, offering traders a practical advantage in analyzing market activity. This feature is especially useful for making faster and more accurate trading decisions. Whether you’re a beginner or an experienced trader, it helps streamline your strategy by highlighting key market insights in real-time.
FREE

This script calculates the SQN (System Quality Number) value of your account within a time interval that you will set. Keep in mind that trades with no initial stoploss value won't be calculated because of the nature of the system! The calculations will be made on your current account.
What is SQN? Van K. Tharp proposed a formula for System Quality Number (SQN) that measured strategy performance and could be used as a custom objective for optimizing strategy parameters. The formula was present
FREE

The Scientific Calculator is a script designed to compute science, engineering and mathematics expressions. General Description
The expression to calculate must obey syntax rules and precedence order, being constituted by the following elements: Integer and real numbers. Mathematical operators for addition (+), subtraction (-), multiplication (*), division (/) and exponentiation (^). Mathematical and trigonometric functions . Curved parentheses (()) to define the precedence and contain
FREE

The current expert advisor is accomplished as a Telegram-bot. The purpose of the EA is to provide information about any country, event or values retrieved from thу database of the economic calendar . It is necessary to allow the following URL in the options in the tab "Expert Advisors": https://api.telegram.org There's ony 1 input parameter "User name". The Telegram username must be added here as @name. After starting the Expert Advisor onto the chart one needs to open Telegram app and find t
FREE

Utility for know all informations and settings of terminal where the utility is loaded. The informations that you can know are for example:
- The path of folder where the terminal start
- The path of folder where the terminal store the indicators, experts advisors etc
- The path of common folder
- The permission to use DLL, to automated trading etc
- The permission to send email, FTP or notifications to smartphone
and many other informations
FREE

G Trade Broker Check – Instantly Evaluate Broker Performance Across Multiple Accounts and Leverage Settings
Take your trading to the next level by analyzing your broker’s performance in real time! With G Trade Broker Check , traders can effortlessly track their broker’s behavior over the past 24 hours on any symbol added to the Market Watch in MT5. Whether you’re comparing multiple brokers, testing different account types, or analyzing varying leverage setups, this powerful Expert Advisor prov
FREE

Trade Saver Service
Application Type: Service
Application Features: Automated search and saving of trading results for multiple systems into text files for further analysis About the Application The service automatically saves the results of closed positions for a list of trading systems into text files, creating a personalized file for each system. How to Use Parameters: LOG_LEVEL - Logging level in the terminal’s Experts section. DEBUG provides the most detailed logs, while ERROR provides m
FREE
Горячие клавиши плюс клик левой кнопки мыши на графике.
Советник открывает сделки, выставляет лимитные и стоповые ордера, удаляет ордера и закрывает позиции, также делает реверс открытых позиций, выставляет прописанные в настройках стоп лосс и тейк профит.
(реверс только на неттинговых счетах)
При запуске советника можно посмотреть подсказку как действует советник при нажатии клавиши + клик на графике.
Правее последнего бара, ниже цены Ctrl+ЛКМ - OpenSell
Правее последнего бара, выше
FREE
Optimize Your Imported Data – Reduce Spread Effectively! When importing data, especially from sources like Ducas Copy , you may notice that the spread is significantly higher than usual. This free MQL5 script is designed to help you adjust and reduce the spread for more accurate backtesting and analysis. How It Works: Import the script into MetaTrader 5 . Open the chart where you want to apply the adjustment. Drag and drop the script onto the chart. A window will appear, asking how much (%) you
FREE
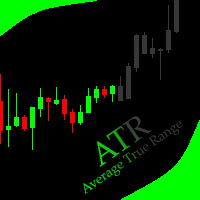
This indicator allows to hide ATR oscillator (on all MT5 timeframes) from a date define by the user, with a vertical line (Alone) or a panel (with "Hidden Candles"). Indicator Inputs: Period Information on "Average True Range" indicator is available here: https://www.metatrader4.com/en/trading-platform/help/analytics/tech_indicators/average_true_range ************************************************************* Hey traders!! Give me your feeds! We are a community here and we have the same o
FREE

What is Risk of Ruin? Risk of ruin is the probability of an individual losing substantial amounts of money through investing, trading or gambling, to the point where it is no longer possible to recover the losses or continue. Risk of ruin is typically calculated as a loss probability, also known as the "probability of ruin."
Input Parameters StartPeriod: Set the first date from where you like the program to calculate. Your current account performance will be measured. EndPeriod: Set the last da
FREE

Script to Delete Pending Orders
Sometimes you placed many Pending Orders and then you want delete certain kind of these orders, this script can help you! Usage:
Download and drag and drop this script to the chart. Check "Allow AutoTrading" in "Common" tab and set input parameters in "Inputs" tab. Input Parameters: TypeOfPending: which type Order you would delete. mySymbol: which Symbol you would delete. The input format of the Symbol is such as "EURUSD" or "eurusd".

The script allows to easily watch the date and time of several cities selected by the user from more than 30 important cities all over the world. It also shows GMT, Server time and Local time. The cities on the screen are automatically sorted by the date and time. You can save your setting on the Inputs tab and use them in future. Notice: Daylight saving time is not considered.
Some trading strategies are suitable for the quiet market with less volatility, while others are suitable for the volatile and violent market. Either way, traders should have a clear measure of how hot or cold the market is. This product is convenient for traders to compare the degree of cold heat of different trading varieties, or the trading heat of the same trading variety in different time periods. You can put it on different charts to get the intuition. It's easy to see which is more hot an
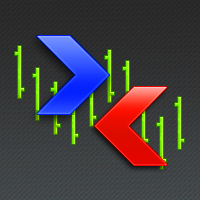
Painting Deals on active chart. It allows analyzing trade history on an account to which you have an investor (read only) password. Type of the arrow displayed indicated the deal type: Right Arrow means In and In/Out deals Arrow Left Left means Out deals. Blue arrows are for Buy deals and Red arrows are for Sell deals. The indicator displays deals in the real time mode, it also displays their Stop Loss and Take Profit levels. Put the mouse over the arrows to see the details of deals including op

The script shows statistics of trades for the specified period. For example, if you want to know the details of trades of the ATC2010 Winner ( bobsley ): Login with his account using the investor (read-only) password (MetaTrader5); Open the chart of his trading symbol (EURUSD); Run this script on the chart; Specify 2010.10.1 in "date from", and the diagram will be shown.
The Synchronized Charts script allows comparing bars of different symbols or different periods of the same symbol. Attach the script to a chart and move bars or change the scale, all opened charts will move synchronously with the current one. The bars on different charts aligned to the border according to their open time. Please be sure the relevant history datas have been downloaded before synchronize charts.

Expert Advisor removes a group of pending orders. Orders are grouped by type. Orders are grouped by entry.
It is possible to form groups arbitrarily directly in the table. Эксперт удаляет группы отложенных ордеров. Ордера группируются по типам. Ордера группируются по направлениям.
Есть возможность формировать группы произвольно непосредственно в таблице.

Expert Advisor to change the Stop Loss and Take Profit levels. It is possible to set stop levels according to the specified profit/loss. You can set the price level directly. Эксперт для изменения уровней Stop Loss и Take Profit открытой позиции. Есть возможность задавать уровни стопов в соответствии с заданной прибылью/убытком. Можно задать непосредственно ценовой уровень ордеров Stop Loss и Take Profit.

The Expert Advisor performs closure of several positions. Positions are grouped by type. You can select the position of largest profit(losses). It is possible to form groups at random. Эксперт выполняет торговые операции группового закрытия позиций. Позиции группируются по типу. Можно выбрать один из трех параметров: filter Off. Buy only. Sell only.
Можно отбирать позиции по величине прибыли(убыткам). filter Off. Wins only. Losses only. и/или задать порог по достигнутой прибыли(убыткам). Есть в

This script allows traders to easily close positions if their profit/loss reaches or exceeds a value specified in pips.
The script allows users to easily close positions if their profit/loss reaches or exceeds a value specified in pips. Please set slippage value first. Sometimes some positions do not close due to high volatility of the market. Please set larger slippage or restart the script.
............................................................................................

Info tool helps to estimate the current risks of open positions and orders. It allows to analyze open positions or/and pending orders, also there are USD/Percentage modes. Expands the margin load and the share of profit participation for individual positions. Информационная панель помогает оценить текущие риски по открытым позициям и ордерам. Есть возможность отдельного анализа рисков по позициям/отложенным ордерам, а также в режимах USD/Percentage. Раскладывает маржинальную нагрузку и долю учас

TimeFilter indicator allows to select visually bit masks (GoodHourOfDay, BadHoursOfDay, GoodDayOfWeek, BadDaysOfWeek), used in the Intraday Time Filter module of the Standard Library. The use of time filters allows to take into account the details of trade sessions. Parameters: GoodHourOfDay Number of the only hour of day (from 0 to 23) when trade signals will be enabled. If the value is -1, the signals will be enabled through the whole day. BadHoursOfDay The bit field. Each bit of this field c

This script notifies a user about different events by playing sounds, sending emails and text messages to a mobile device. The following events are supported: New deals (in/in out/out). Expiration of Pending orders. The terminal disconnected. The terminal or the script closed. Please set a notification type for each event separately. If you need notifications via Email, please make sure that the settings on the Email tab are correct. If you need to receive notifications on a mobile device, pleas

This utility is used to visually choose an indicator for trailing stop and select its parameters. The Expert Advisor modifies the Stop Loss order position opened for the instrument of the current chart based on indicator values. Uses indicators Parabolic SAR , NRTR (Nick Rypock Trailing Reverse) , Moving Average or linear regression channel. The indicators are added to or removed from the chart using the 'show' checkbox.
The following options are available: Parabolic - trailing stop based on th

The Chandelier Exit, introduced by Charles LeBeau, is described in "Come into My Trading Room" book.
It calculates each stop on a long position in an uptrend from the highest point reached during that rally, and gets its name from the chandelier, which hangs from the highest point in the room. The Chandelier Exit uses a multiple of the Average True Range (ATR), subtracting it from the highest high since the trade was entered. It creates a new trade whenever the previous trade is stopped out. Cha

One of the key rules in trading is never move your stops in such a way that your risk increases. Our stop sequence shows the automatic tightening of stops. They appear as a series of decreasing risk points until the trade is eventually stopped out.
The problem is that if you enter a trade at any other point than the initial dot of the sequence, you may be placing the stop too close. Stop-entry plots show you the initial value for the stop for each bar. You can use them when you put on a trade, a

The Chandelier Exit, introduced by Charles LeBeau, is described in "Come into My Trading Room" book. It calculates each stop on a short position in a downtrend from the lowest point reached during that decline. The Chandelier Exit uses a multiple of the Average True Range (ATR), adding it to the lowest low since the trade was entered. It creates a new trade whenever the previous trade is stopped out. Chandelier Stops differ from traditional stops by having the ability to move against you if the

One of the key rules in trading is never move your stops in such a way that your risk increases. Our stop sequence shows the automatic tightening of stops. They appear as a series of decreasing risk points until the trade is eventually stopped out.
The problem is that if you enter a trade at any other point than the initial dot of the sequence, you may be placing the stop too close. Stop-entry plots show you the initial value for the stop for each bar. You can use them when you put on a trade, a

Elder-Ray is made of both Bulls Power and Bears Power as described in "Come into my Trading Room" book. It is tracking the relative power of bulls and bears by measuring how far the high and the low of each bar get away from the average price. Elder-ray is an indicator developed by Dr. Elder and named for its similarity to x-rays. It shows the structure of bullish and bearish power below the surface of the markets. Elder-ray combines a trendfollowing moving average with two oscillators to show w

インパルスシステムは、「Come into myTradingRoom」の本で最初に説明されました。 MACDヒストグラムと価格の指数移動平均(EMA)の両方の方向を使用して、インパルスを定義します。 ルールは衝動に逆らって取引することは決してありません。
そのカラーコードはあなたにいくつかの信号を与えます: EMAとMACD-ヒストグラムの両方が上昇している場合、インパルスシステムはバーの色を緑色にします(短絡は許可されません)。 EMAとMACD-ヒストグラムの両方が低下している場合、インパルスシステムはバーの色を赤に着色します(購入は許可されていません)。 EMAとMACD-ヒストグラムが異なる方向を指している場合、インパルスシステムはバーの色をシアンに着色します(長くても短くてもかまいません)。
パラメーター: MACD_Short_Length (12)–MACD計算用の短いEMA。 MACD_Long_Length (26)–MACD計算用の長いEMA。 MACD_Smoothing_Length (9)–信号線の平滑化値。 Short_EMA_Length (13)

The MACD XOver indicator was developed by John Bruns to predict the price point at which MACD Histogram will reverse the direction of its slope.
The indicator is plotted one day ahead into the future, allowing, if your strategy depends on MACD Histogram, to predict its reversal point for tomorrow (or the next bar in any timeframe). If the closing price tomorrow is above the value of this indicator, then MACD Histogram will tick up. If the closing price tomorrow is below the value of this indicat

SafeZone is a method for setting stops on the basis of recent volatility, outside the level of market noise. It is described in "Come into my Trading Room" book. In an uptrend, SafeZone defines noise as that portion of the current bar that extends below the low of the previous bar, going against the prevailing trend. It averages the noise level over a period of time and multiplies it by a trader-selected factor.
For long trades, SafeZone subtracts the average noise level, multiplied by a factor

One of the key rules in trading is never move your stops in such a way that your risk increases. Our stop sequence shows the automatic tightening of stops. They appear as a series of decreasing risk points until the trade is eventually stopped out.
The problem is that if you enter a trade at any other point than the initial dot of the sequence, you may be placing the stop too close. Stop-entry plots show you the initial value for the stop for each bar. You can use them when you put on a trade,

SafeZone is a method for setting stops on the basis of recent volatility, outside the level of market noise. It is described in "Come into my Trading Room" book.
In a downtrend, SafeZone defines noise as the portion of the current bar that extends above the high of the previous bar, against the downtrend. It averages the noise level over a period of time and multiplies it by a trader-selected factor. For short trades, it adds the average noise level, multiplied by a factor, to the latest high t

One of the key rules in trading is never move your stops in such a way that your risk increases. Our stop sequence shows the automatic tightening of stops. They appear as a series of decreasing risk points until the trade is eventually stopped out.
The problem is that if you enter a trade at any other point than the initial dot of the sequence, you may be placing the stop too close. Stop-entry plots show you the initial value for the stop for each bar. You can use them when you put on a trade,

The Smoothed ROC indicator, developed by Fred Schutzman, is described in "Trading for a Living" book. It is created by calculating the rate of change for an exponential moving average of closing prices. When it changes direction, it helps identify and confirm trend changes. Parameters Smoothing_EMA_Length (13) – The length of the EMA used for smoothing; ROC_Period (21) – The length of the rate of change calculation.
This script alerts a user via sounds and alert box at the end of a countdown. It is like an alarm clock. There are 2 ways to start counting down: Set a value of remaining minutes. Example: if you need an alert after 1 hour, set it to 60. Set countdown end time. If you like to use a custom sound for the alert, copy your sound files to "terminal_path\Sounds" folder and set the exact file name in the input parameters. The sound file must be in *.wav format.

The Reverse Bar indicator paints the reversal bars according to trade strategy, described by Bill Williams in "Trading Chaos. Maximize Profits with Proven Technical Techniques" book. The bearish reversal bar has red or pink color (red-stronger signal) The bullish reversal bar has blue or light blue color(blue - stronger signal) It is recommended to use it on hourly timeframe (H1) and higher.
MetaTraderマーケットは、履歴データを使ったテストと最適化のための無料のデモ自動売買ロボットをダウンロードできる唯一のストアです。
アプリ概要と他のカスタマーからのレビューをご覧になり、ターミナルにダウンロードし、購入する前に自動売買ロボットをテストしてください。完全に無料でアプリをテストできるのはMetaTraderマーケットだけです。
取引の機会を逃しています。
- 無料取引アプリ
- 8千を超えるシグナルをコピー
- 金融ニュースで金融マーケットを探索
新規登録
ログイン