• 概要
  • レビュー
  • コメント (4)
  • 最新情報

Fast Switching Symbols Periods Keyboard MT5

The indicator allows you to quickly switch from one instrument to another, from one time period to another using the keyboard or buttons on the monitor. Each command can be assigned a hot key from 0-9, a-Z (case-insensitive) and VK_OEM_COMMA ("<" on the keyboard) and VK_OEM_PERIOD (">" on the keyboard).

This can help you to operate the maximum number of instruments that are available at your broker, analyze more instruments/periods in less time.

This product cannot be tested in the tester, because the tester does not have the ability to change the symbol and period of the chart(on the chart where the test is already running).
All the functionality is shown in full in the video, description, and screenshots.

You can also save a default template with the added buttons, then they will be automatically added to the newly opened charts.

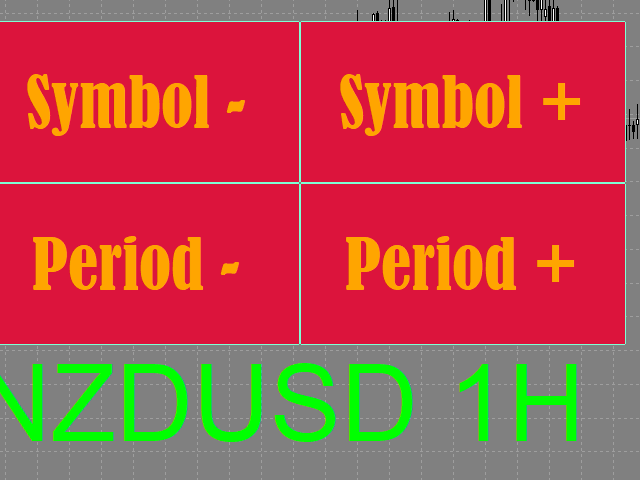
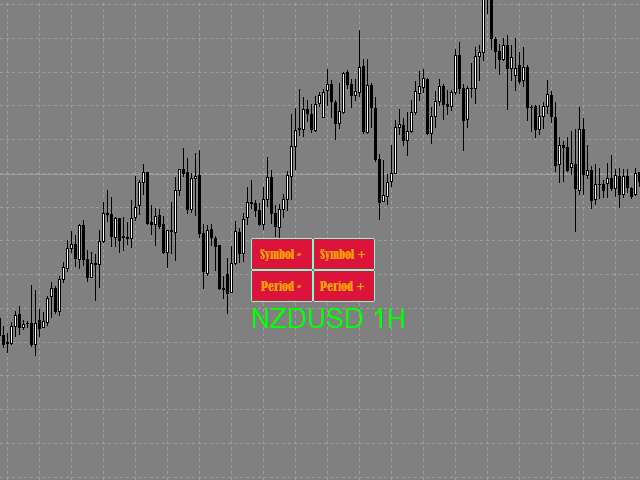
You can use the on-screen buttons or keyboard buttons to switch between different tools and time periods.
On-screen buttons can be dragged with the mouse. The text label "tool/period" moves along with the buttons.
You can hide on-screen buttons. In this case, the text label is moved to the upper-left corner. you can select the text label with the mouse and move it to any convenient location.
The size of on-screen buttons depends on their font and font size.
Keyboard shortcuts work regardless of whether there are on-screen buttons.


Settings

  • Buttons_Hide - hide/display on-screen buttons.
  • Button_Text_Color - the text color of the buttons.
  • Button_Background_Color - buttons background color (if Button_Background_Color=clrNONE, the buttons background is the same as the graph background color).
  • Button_Border_Color - the border color of the buttons.
  • Button_FontSize - button font size.
  • Button_Font - the font of the buttons.
  • Tag_Symbol_Period_Color - color of the caption on the chart of the current symbol/time period.
  • Tag_Symbol_Period_FontSize - font size of the caption on the chart of the current symbol / time period.
  • Tag_Symbol_Period_Font font of the caption on the chart of the current symbol / time period.

Description of the actions performed by the hot keys:

Each action can be assigned a hot key from 0-9, A-Z (case-insensitive) and VK_OEM_COMMA ("<" on the keyboard) and VK_OEM_PERIOD (">" on the keyboard).

  • Prev_Symbol (< by default) - switches the instrument to the next one (listed in Market Watch) from bottom to top (if the instrument is the first, switches to the last one, thus cycling in a loop).
  • Next_Symbol (> by default) - switches the instrument to the next one (listed in Market Watch) from top to bottom (if the instrument is the last, switches to the first one, thus cycling in a loop).
  • Period_Down (Z by default) - switches the time frame from the higher to the smaller (month - minute).
  • Period_Up (X by default) - switches the time frame from the smaller to the higher (minute - month).
    おすすめのプロダクト
    Introducing   Order Blocks Breaker , a brand-new way to identify and leverage order blocks in your trading strategy. After developing multiple order block tools with unique concepts, I’m proud to present this tool that takes things to the next level. Unlike previous tools,   Order Blocks Breaker   not only identifies order blocks but also highlights   Breaker Order Blocks —key areas where the price is likely to retest after a breakout. MT4 -  https://www.mql5.com/en/market/product/124101/ This t
    Real-Time Spread Display Tool A   real-time spread display tool   is a specialized software or application designed to provide traders and investors with instant, live data on the   spread —the difference between the bid price (the price at which buyers are willing to purchase an asset) and the ask price (the price at which sellers are willing to sell it)—for various financial instruments. This tool is critical in markets such as forex (FX), stocks, futures, and cryptocurrencies, where price f
    MultiTradeNews
    Leeank Andres Fernandez Molano
    This script is designed for traders who need to quickly place trades across multiple currency pairs during critical news releases, where every second counts. With this tool, you can pre-select your desired currency pairs and assign independent volumes for each one. When a major news event hits, such as Non-Farm Payroll (NFP) or PMI data releases, the script allows you to execute all your trades instantly without the need to open each pair manually. Key Features: Customizable Pairs : Choose from
    FREE
    This indicator is especially for the binary trading. Time frame is 1 minutes and exp time 5 or 3 minutes only. You must be use martingale 3 step. So you must put lots size is 10 % at most. You should use Mt2 trading platform to connect with my indicator to get more signal without human working. This indicator wining rate is over 80% but you may get 100% of profit by using martingale 3 step. You should use MT2 Trading Platform to connect meta trader platform and binary platform . You can get mt2
    FREE
    Telegram message group
    Maria Graciela Galvez Barrera
    Telegram Trading Robot for MetaTrader 5 This robot is designed to send notifications to a Telegram group when trades are opened or closed in MetaTrader 5. Below, I'll explain how to configure it step by step. Input Parameters Before starting the robot, you must configure these parameters in the Expert Advisor (EA): Parameter Description InpToken: Token of the Telegram bot (obtained from @BotFather). Example: 123456789:ABCdef_GHIJKL... InpChatId: ID of the Telegram chat where notifications w
    Description:  For a comprehensive understanding of our indicators, we invite you to explore the entire Q&A section within this MQL5 blog post   here . The "Currency Strength Meter Strategy" Indicator is a cutting-edge technical analysis tool that offers traders a unique perspective on the forex market. By analyzing the relative strength of different currencies, this indicator provides valuable insights into the market's dynamics, allowing traders to make informed decisions. Understanding Curren
    Object Synchronizer MT5 : Better focus/analysis of the price chart in many timeframes. Are you bored to save and load template many times for the same symbol for many chart timeframes? Here is the alternative. With this indicator, you enjoy creating objects across many charts, you can modify the same object in any chart, you can delete the same object in any chart. All objects you created/modified are always synchronized across all chart windows (with the same symbol). Save your time, you can fo
    It has never been so easy to manage the risk of your account until now, this tool will allow you to have full control of your capital and manage your entries in the synthetic index derivative markets, in an easy, practical and safe way. The available input and configuration parameters are as follows :  RISK MANAGEMENT 1. Value of your account: Here as its name says you will place the value corresponding to the size of your account, for example if your account is 150 dollars the corresponding val
    インジケーターについて このインジケーターは、金融商品の終値に対するモンテカルロシミュレーションに基づいています。モンテカルロ法とは、以前の観測結果に基づくランダムな数値を使用して、さまざまな結果の確率をモデル化するための統計的手法です。 どのように機能しますか? このインジケーターは、歴史的データに基づき、時間の経過とともにランダムに価格が変動する複数の価格シナリオを生成します。各シミュレーション試行は、 終値 の変動を考慮するためのランダム変数を使用し、与えられた期間における将来の市場変動を効果的に模倣します。 モンテカルロシミュレーションの利点 - モンテカルロシミュレーションは、複数の将来のシナリオに対して戦略をテストすることで、さまざまなトレード戦略のリスクを分析するのに役立ちます。 - 稀な極端なイベント(テールリスク)を含むさまざまな市場状況で戦略のパフォーマンスを把握することができます。 - 単一の予測に依存するのではなく、モンテカルロ法は関連する確率を伴う潜在的な結果の範囲を提供します。これにより、利益や損失の可能性を理解するのに役立ちます。 モンテカルロ法は、
    Risk Manager Pro
    Jhojan Alberto Tobon Monsalve
    Risk Manager Pro is a simple utility that calculates the necessary lots with the risk percentage and the pips of stop loss, before opening positions. The web calculators can be useful in some cases but they are not efficient to open operations in real time. In the trading days, there are few opportunities to open positions and when the opportunity arises, the seconds make the difference. This is not possible with conventional web calculators, since to calculate the size of an operation regarding
    Trade Many Indicators/indicator combiner is a tool that enables you combine and use   up to   30 indicators at the same time without the confusion or cluttering up your chat . It has a risk reward tool and auto-lots calculation for easy position placement . You receive a bullish signal when most of the indicators you turned ON indicate bullish and you receive a bearish signal when most or the indicators you turned ON give a bearish signal. All the indicators are customizable to your own needs. I
    MQL Tool "Ofir Email to Telegram": Never Miss a Trading Alert Again! Tired of missing important alerts from your indicators and Expert Advisors (EAs)? Ofir Email to Telegram is the solution you've been waiting for! This revolutionary MQL tool automatically forwards all email alerts from your indicators and EAs directly to your Telegram account. Never again will you miss a trading opportunity or important notification! Here are just a few of the benefits of Ofir Email to Telegram: Quick and easy
    This service is designed to stream online cryptocurrency quotes   from the Binance exchange to your MetaTrader 5 terminal. You will find it perfectly suitable if you want to see the quotes of cryptocurrencies in real time — in the Market watch window and on the MetaTrader 5 charts. After running the service, you will have fully featured and automatically updated  cryptocurrency charts in your MetaTrader 5. You can apply templates, color schemes, technical indicators and any non-trading tools to
    XCalper CandleTimer
    Aecio de Feo Flora Neto
    4.62 (13)
    This auxiliary indicator displays time left before closing on the current timeframe with continuous update . It also shows the last trade price and variation from a previous day close in percentage and points. This indicator is pretty handy for daytraders and scalpers who want to precisely monitor closing and opening of candles. Indicator parameters Show in shifted end - Default: False. Display time and values on screen. If True, Displays only time to close aside last candle. Distance from the
    FREE
    My take on "The Strat" by  Rob Smith. The Strat is a method of candle sticks interpretation. It is based on directional displacement and reversal formations. The EA looks for actionable patterns on a given timeframe, and then execute trades as per the pic below. SL is calculated as an ATR multiplier. No averaging, no martingale, no dubious techniques, just straight trades with a Take Profit and a Stop Loss. You can not go wrong here. It really works. It does especially well on indices, like NAS1
    Do you, like me, like to trade with the trend? Then this indicator will help you! Rainbow Trend is a trend indicator, which uses several Moving Averages on the chart. It measures different trend strenght zones for different periods: very long term, long term, mid term, short term and very short term. Each zone has its color, and it is possible to have sound alert when the prices leaves a zone and enters another. Its configuration is very simple. If you find any bug or have any suggestions, conta
    The Emerald is a Comprehensive utility integrated with a number of tools including the Currency Strength Meter, Trade/directional signal, signal strength, Current bar countdown timer, Forex market sessions time converter and many more. Can be used in all time frames and all markets The currency strength meter helps you identify which currencies are strong and which currencies are weak. All the 10 major currencies are monitored in real-time. The Emerald can used to predict currency movements whe
    Powerful trend indicator provided with all necessary for trade and it is very easy to use. Everyone has probably come across indicators or Expert Advisors that contain numerous input parameters that are difficult to understand. But here, input parameters are simple and it is no need to configure anything — neural network will do all for you. Difference from a classic version The real-time multi time frame panel is added, so you can check a trend for other timeframes without switching the schedu
    Indicator Values Panel MT5
    AL MOOSAWI ABDULLAH JAFFER BAQER
    Indicator Values Panel – Your Ultimate Indicator Monitoring Solution! Are you tired of constantly switching between indicators to check values? Want a simple, elegant, and real-time solution that puts all key indicator readings in one place? Indicator Values Panel is the ultimate utility for traders who want a clear and concise display of important indicator values – directly on their chart! What is Indicator Values Panel? Indicator Values Panel is a sleek, easy-to-use utility that provides rea
    Order Book, known also as Market Book, market depth, Level 2, - is a dynamically updated table with current volumes of orders to buy and to sell specific financial instument at price levels near Bid and Ask. MetaTrader 5 provides the means for receiving market book from your broker, but in real time only, without access to its history. The indicator OrderBook Cumulative Indicator accumulates market book data online and visualizes them on the chart. In addition, the indicator can show the market
    Forex Factory Calendar Indicator MT5 The Forex Factory Calendar Indicator MT5 integrates real-time macroeconomic updates directly into MetaTrader 5 charts. This powerful MT5 news tool keeps traders informed of impactful economic announcements—such as interest rate decisions, CPI data, and jobless claims—that often drive significant market volatility. By utilizing the Web Request feature, it seamlessly pulls updated data from Forex Factory and visualizes it within the trading platform. «Indicato
    FREE
    インディケータは現在のクオートを作成し、これを過去のものと比較して、これに基づいて価格変動予測を行います。インジケータには、目的の日付にすばやく移動するためのテキスト フィールドがあります。 オプション: シンボル - インジケーターが表示するシンボルの選択; SymbolPeriod - 指標がデータを取る期間の選択; IndicatorColor - インジケータの色; HorisontalShift - 指定されたバー数だけインディケータによって描画されたクオートのシフト; Inverse - true は引用符を逆にします。false - 元のビュー。 ChartVerticalShiftStep - チャートを垂直方向にシフトします (キーボードの上下矢印)。 次は日付を入力できるテキストフィールドの設定で、「Enter」を押すとすぐにジャンプできます。
    For contact, free connect to signal, PARTNER PROGRAM and detailed info :  Facebook Welcome. This tool is designed to help traders monitor the critical price level at which the account's margin level reaches 100%, providing valuable insights for risk management in trading. Advisor Description The "Margin Level 100%" indicator is a custom technical indicator for MetaTrader, designed to calculate and display the critical price level for a specific symbol where the account's equity equals it
    FREE
    The indicator detects and displays М. Gartley's Butterfly pattern. The pattern is plotted by the extreme values of the ZigZag indicator (included in the resources, no need to install). After detecting the pattern, the indicator notifies of that by the pop-up window, a mobile notification and an email. The pattern and wave parameters are displayed on the screenshots. The default parameters are used for demonstration purposes only in order to increase the amount of detected patterns. Parameters z
    Have you ever take a long time to watch a Symbol when the network link is not good ? Have you ever wait for a long time when you switch chart between different Symbols or different TimeFrames ? If you do long-term backtesting , Have you ever to be downloaded datas for a long time ? Yes, If there is no data in the system, those will happen.  1. What is this: Download all the Symbol data in Market Watch to the system. PS: This is not outputting data to Files. This Link go to Demo version: https:/
    Pro Minimalist Trade Assistant : Focusing on Risk Management and Strict Trade Discipline for Each Trading Style The benefits of this Utility: 1.Intuitive Graphical Interface:  Take control with an excellent graphical dashboard featuring outstanding parameters for swift order execution. Enjoy a sleek and customizable interface with the option to switch between dark and light themes. 2.Support for Cultivating Trading Discipline Habits Adhering to your trading style is essential. Each Trading styl
    The script allows to easily watch the date and time of several cities selected by the user from more than 30 important cities all over the world. It also shows GMT, Server time and Local time. The cities on the screen are automatically sorted by the date and time. You can save your setting on the Inputs tab and use them in future. Notice: Daylight saving time is not considered.
    Time to Close Candle
    German David Nino Cifuentes
    TimeToClose The "TimeToClose" indicator is an essential tool for traders who need to monitor the remaining time before a candle closes. This indicator displays the remaining time directly on the BID line, providing a clear and precise reference during real-time trading. Key Features: Displays the remaining time for the current candle to close. Direct integration on the BID line for better visualization. Simple and user-friendly configuration. Ideal for all types of traders, from beginners to pro
    FREE
    The   Close script   is a simple tool that allows traders to close their trades by three methods. Just run the script and choose the close method. Closing methods Symbol  - Allows closing all open trades for a specific symbol. All_Trades  - Allows closing all open trades. Magic_Number  - Allows closing all open trades according to their magic number. Recommendation AutoTrading functions must be activated.  If the AutoTrading function is disabled, the script will not work. EA should be stopped.
    FREE
    Online monitoring of forex accounts fxmon.io The application helps track real-time accounts from your forex terminals Metatrader 4/5 around the clock. List of main features: The state of your accounts in the moment Profitability on each account and on all together Metrics for currency pairs Screenshots of pairs from the terminal Fine-tuning of notifications for any indicators Access to statistics via Telegram, Android app, iOS app If you use Expert Advisors and robots, this app is for you Monit
    FREE
    このプロダクトを購入した人は以下も購入しています
    Trade Assistant MT5
    Evgeniy Kravchenko
    4.42 (185)
    取引 ごとのリスクの 計算、新規注文 の 簡単 な 設置、部分的 な 決済機能 を 持 つ 注文管理、 7 種類 のトレーリングストップなど 、便利 な 機能 を 備 えています 。 追加の資料と説明書 インストール手順   -   アプリケーションの手順   -   デモアカウント用アプリケーションの試用版 ライン機能 チャート上にオープニングライン、ストップロス、テイクプロフィットを表示します。この機能により、新規注文を簡単に設定することができ、注文を出す前にその特徴を確認することができます。   リスク計算 リスク計算機能は、設定されたリスクとストップロス注文のサイズを考慮して、新規注文のボリュームを計算します。ストップロスの大きさを自由に設定できると同時に、設定したリスクを守ることができます。 Lot calc ボタン - リスク 計算 を 有効 / 無効 にします 。 Risk フィールドでは 、必要 なリスクの 値 を 0 から 100 までのパーセンテージまたは 預金通貨 で 設定 します 。 設定」 タブで 、 リスク 計算 の 種類 を 選択 します :「 $ 通
    Trade Manager EAへようこそ。これは、取引をより直感的、正確、そして効率的にするために設計された究極の リスク管理ツール です。これは単なるオーダー実行ツールではなく、包括的な取引計画、ポジション管理、リスク管理のためのソリューションです。初心者から上級者、迅速な実行を必要とするスキャルパーまで、Trade Manager EAはあらゆるニーズに対応し、為替、指数、商品、暗号通貨などさまざまな市場で柔軟に対応します。 Trade Manager EAを使用すると、複雑な計算が過去のものになります。市場を分析し、エントリーポイント、ストップロス、テイクプロフィットのレベルをチャート上のラインでマークし、リスクを設定するだけで、Trade Managerが最適なポジションサイズを即座に計算し、SLとTPをピップ、ポイント、口座通貨でリアルタイムに表示します。すべての取引が簡単かつ効果的に管理されます。 主な機能: ポジションサイズ計算機 :定義されたリスクに基づいて取引サイズを瞬時に決定します。 簡単な取引計画 :エントリー、ストップロス、テイクプロフィットを設定するためのド
    EASY Insight AIO – スマートで手間いらずな取引のオールインワンソリューション 概要 数秒で市場全体——FX、ゴールド、暗号資産、指数、さらには株式まで——を、手作業のチャート確認や複雑なセットアップ・インジケーター導入なしにスキャンできたらどうでしょうか? EASY Insight AIO はAIトレードのための究極のプラグ&プレイ型エクスポートツールです。市場全体のスナップショットを、クリーンなCSVファイルで一括出力。ChatGPT、Claude、Gemini、Perplexityなど、さまざまなAIプラットフォームで即座に解析できます。 ウィンドウの切り替えやグラフのごちゃごちゃしたオーバーレイはもう不要。自動エクスポートされる純粋で構造化されたインサイトだけで、無駄なチャート監視に悩まされず、スマートなデータ主導の判断に集中できます。 なぜEASY Insight AIOなのか? 本当のオールインワン • セットアップ不要、インジケーターのインストール不要、チャートへのオーバーレイ不要。インストールして起動し、エクスポートするだけです。 マルチアセット対
    Grid Manual MT5
    Alfiya Fazylova
    4.89 (18)
    「Grid Manual」は、注文のグリッドを操作するための取引パネルです。 ユーティリティはユニバーサルで、柔軟な設定と直感的なインターフェイスを備えています。 それは、損失を平均化する方向だけでなく、利益を増やす方向でも注文のグリッドで機能します。 トレーダーは注文のグリッドを作成して維持する必要はありません。 すべてが「Grid Manual」によって行われます。 注文を開くだけで十分であり、「Grid Manual」は注文のグリッドを自動的に作成し、非常に閉じるまでそれに付随します。 完全な説明とデモバージョン ここ。 ユーティリティの主な機能と機能 ユーティリティは、モバイル端末から開かれた注文を含め、あらゆる方法で開かれた注文を処理します。 「制限」と「停止」の2種類のグリッドで機能します。 グリッド間隔の計算には、固定と動的(ATRインジケーターに基づく)の2つの方法で機能します。 オープンオーダーグリッドの設定を変更できます。 チャート上の各注文グリッドの損益分岐点を表示します。 各注文グリッドの利益率を表示します。 ワンクリックでグリッドから収益性の高い注文を閉じるこ
    TradePanel MT5
    Alfiya Fazylova
    4.86 (134)
    Trade Panel は、多機能の取引アシスタントです。このアプリケーションには手動取引用の 50 を超える取引機能が含まれており、ほとんどの取引操作を自動化できます。 注意、アプリケーションはストラテジー テスターでは動作しません。購入する前に、デモアカウントでデモ版をテストできます。デモ版 ここ 。 完全な手順 こちら 。 取引。 ワンクリックで取引操作を実行できます: 自動リスク計算を使用して未決の注文とポジションをオープンします。 ワンクリックで複数の注文とポジションをオープンします。 注文グリッドを開きます。 未決の注文とポジションをグループごとにクローズします。 ポジション反転 (買いを閉じて売りを開く、または売りを閉じて買いを開く)。 ポジションをロックします(買いポジションと売りポジションの量を均等にする追加のポジションをオープンします)。 ワンクリックですべてのポジションを部分的にクローズします。 すべてのポジションのテイクプロフィットとストップロスを同じ価格レベルに設定します。 すべてのポジションのストップロスをポジションの損益分岐点レベルに設定します。 注文とポ
    あなたがメンバーである任意のチャネルから(プライベートおよび制限されたものを含む)シグナルを直接あなたのMT5にコピーします。  このツールは、トレードを管理し監視するために必要な多くの機能を提供しながら、ユーザーを考慮して設計されています。 この製品は使いやすく、視覚的に魅力的なグラフィカルインターフェースで提供されています。設定をカスタマイズして、数分で製品を使用を開始できます! ユーザーガイド + デモ  | MT4版 | Discord版 デモを試してみたい場合は、ユーザーガイドにアクセスしてください。 Telegram To MT5 受信機は、ストラテジーテスターで動作しません! Telegram To MT5の特徴 複数のチャネルから一度にシグナルをコピー プライベートおよび制限されたチャネルからシグナルをコピー BotトークンまたはChat IDは必要ありません   (必要に応じて使用することができます) リスク%または固定ロットを使用して取引 特定のシンボルを除外 すべてのシグナルをコピーするか、コピーするシグナルをカスタマイズするかを選択 すべてのシグナルを認
    The product will copy all telegram signal to MT5 ( which you are member) , also it can work as remote copier.  Easy to set up, copy order instant, can work with almost signal formats, image signal,  s upport to translate other language to English Work with all type of channel or group, even channel have "Restrict Saving Content", work with  multi channel, multi MT5 Work as remote copier: with signal have ticket number, it will copy exactly via ticket number. Support to backtest signal. How to s
    Exp COPYLOT CLIENT for MT5
    Vladislav Andruschenko
    3.91 (32)
    MT5のトレードコピー機は、МetaТrader5プラットフォームのトレードコピー機です 。 それは間の 外国為替取引をコピーします   任意のは 、MT5 - MT5、MT4 - MT5   COPYLOT MT5版の アカウント (またはを MT4 - MT4   MT5 - MT4   COPYLOT MT4版用) 信頼できるコピー機! MT4のバージョン 完全な説明   +DEMO +PDF 購入する方法 インストールする方法     ログファイルの取得方法     テストと最適化の方法     Expforex のすべての製品 МТ4ターミナルでトレードをコピーすることもできます(   МТ4   -   МТ4、МТ5   -   МТ4   ):   MT4のCOPYLOT CLIENT このバージョンには、端末間 МТ5   -   МТ5、МТ4   -   МТ5が含まれ ます。 ディールコピー機は、2/3/10端末間でディール/ポジションをコピーするために作成されます。 デモ口座と投資口座からのコピーがサポートされています。 プログラムは、複数の端末バインデ
    EASY Insight – スマートなトレードはここから始まる 概要 もし数秒で市場全体(FX、ゴールド、暗号通貨、指数、株式まで)を、手作業のチャート確認なしでスキャンできたらどうでしょう? EASY Insight は、インジケーターデータを実践的なトレードインテリジェンスに変換する、AI対応のエクスポートツールです。無駄な推測や視覚的な混乱に疲れたトレーダーのために設計されており、市場全体のスナップショットを1つのクリーンなCSVファイルで提供します。 これまでとは全く違う新しいトレード体験です。ウィンドウの切り替えも、グラフのごちゃごちゃしたオーバーレイもありません。FX Power (FXP)、FX Volume (FXV)、FX Dynamic (FXD)、FX Levels (FXL)、そして非FX資産用のIX Power (IXP) ― あなたがすでに知っているツールから得られる、純粋に構造化されたインサイトだけ。 さらに便利さを求めるなら、 EASY Insight AIO を選んでください。すべてが1つのインストールに含まれ、設定不要。チャート上にインジケータ
    Trade Manager は、リスクを自動的に計算しながら、取引を迅速に開始および終了するのに役立ちます。 過剰取引、復讐取引、感情的な取引を防止する機能が含まれています。 取引は自動的に管理され、アカウントのパフォーマンス指標はグラフで視覚化できます。 これらの機能により、このパネルはすべてのマニュアル トレーダーにとって理想的なものとなり、MetaTrader 5 プラットフォームの強化に役立ちます。多言語サポート。 MT4バージョン  |  ユーザーガイド + デモ Trade Manager はストラテジー テスターでは機能しません。 デモについてはユーザーガイドをご覧ください。 危機管理 % または $ に基づくリスクの自動調整 固定ロットサイズを使用するか、ボリュームとピップに基づいた自動ロットサイズ計算を使用するオプション RR、Pips、または価格を使用した損益分岐点ストップロス設定トレーリングストップロス設定 目標に達したときにすべての取引を自動的に終了するための 1 日あたりの最大損失 (%)。 過度のドローダウンからアカウントを保護し、オーバートレードを防ぎます
    Instead of sticking to the Charts,let's use ALL IN ONE KEYLEVEL Announcement: We are pleased to announce the latest version 14.02 of the One In One Keylevel product. This is a reliable product that has been upgraded with many new features and improvements to make your work easier and more efficient. Currently, we have a special promotion for this new version. The current discounted price is $500, and there are only 32 units left. After that, the price will increase to $1000, and will continue to
    多機能ツール 搭載機能: ロット計算機、プライスアクション、リスク/リワードレシオ、トレードマネージャー、需要供給ゾーンなどをはじめ65以上の機能。 バージョ:デモ版   |   ユーザーマニュアル   |    MT4版 このユーティリティはストラテジー テスターでは機能しません。 ここからデモ   バージョンをダウンロードして製品をテストできます。 ご不明な点や改善提案、バグの発見などございましたら、 連絡してください 。 取引プロセスを簡素化、高速化、自動化します。このダッシュボードで標準端末機能を拡張します 1. 新しい取引を開始します : ロット / リスク / RR の計算 1. Lot計算機(リスクサイズに基づく取引量計算 2. リスク計算機(ロットサイズに基づくリスク量) 3. リスク/リワードレシオ (R/R) 4. 注文のアクティベーション トリガー + Buy StopLimit / Sell StopLimit 5. 仮想 SL / TP レベル (隠しSL、TP: ブローカーには見えない) 6.  Smart SL / エントリー レベル: バーがそれを超
    Custom Alerts: 複数の市場を同時にモニターし、重要なチャンスを逃さない 概要 Custom Alerts は、複数の銘柄で発生する潜在的なセットアップを統合して追跡したいトレーダーに向けたダイナミックなソリューションです。FX Power、FX Volume、IX Power などの主力ツールから得られるデータを統合することで、 Custom Alerts は、複数のチャートを切り替えたり、絶好の機会を逃したりするリスクなしに、市場での重要な変化を自動的に通知します。よりスマートかつ効率的にトレードしたい方は、 Custom Alerts を活用してモニタリング能力を大幅に向上させましょう。 1. なぜ Custom Alerts がトレーダーにとって非常に有益なのか 全てを一括管理するマーケットモニタリング • Custom Alerts は、主要8通貨、ゴールド、および最大7つの指数や商品など、さまざまな銘柄からのシグナルを集約・統合します。 • 多数のチャートを切り替える手間を省き、明確かつ一元化された通知を受け取ることが可能です。 戦略に合わせたカスタムア
    Easy Trade – シンプルかつ強力なスマートトレード管理 Easy Trade は、リスクを適切にコントロールし、スムーズな取引執行を実現したい MetaTrader ユーザーのためのオールインワン・トレードマネジメントソリューションです。 トレーダーの声をもとにゼロから設計された Easy Trade は、複数シンボルの取引を簡単に実行・監視・管理できるようにし、作業フローを複雑にしません。 手動スキャルピングでも、少数のセットアップを管理するポートフォリオでも、Easy Trade は賢明な判断と安定した成果に集中できるようサポートします。 ⸻ なぜ Easy Trade を使うべきか? 精密なリスク管理:固定ロットサイズまたはパーセンテージによるリスク設定が可能。リアルタイムでリスクとリワード情報を確認。 バスケット型トレーリング:複数の取引の利益を監視。目標到達で部分利益を自動確保。 取引の自動記録:各取引をスクリーンショットで記録。ジャーナル記録やパフォーマンス分析に最適。 時限クローズ機能:指定日時での自動クローズ設定が可能。週末前や取引終了時に便利。 カス
    MT5 to Telegram Signal Provider は、Telegramのチャット、チャンネル、またはグループに 指定された シグナルを送信することができる、完全にカスタマイズ可能な簡単なユーティリティです。これにより、あなたのアカウントは シグナルプロバイダー になります。 競合する製品とは異なり、DLLのインポートは使用していません。 [ デモ ] [ マニュアル ] [ MT4版 ] [ Discord版 ] [ Telegramチャンネル ] セットアップ ステップバイステップの ユーザーガイド が利用可能です。 Telegram APIの知識は必要ありません。必要な全ては開発者から提供されます。 主な特長 購読者に送信する注文の詳細をカスタマイズする機能 例えば、Bronze、Silver、Goldといった階層型のサブスクリプションモデルを作成できます。Goldサブスクリプションでは、すべてのシグナルが提供されます。 id、シンボル、またはコメントによって注文をフィルターできます 注文が実行されたチャートのスクリーンショットが含まれます 追加の確認のために
    The most advanced news filter on MQL market - free demo available Take a Break has transformed from a basic news filter into a comprehensive account protection solution. It seamlessly pauses any other Expert Advisors during news events or based on your custom filters, all while safeguarding your EA settings - restoring them automatically when trading resumes for complete peace of mind. Typical use cases: A single news filter for all your EAs. Stop trading during news/high volatility (+ close all
    TelegramからMT5へ: 究極のシグナルコピーソリューション Telegram to MT5 を使えば、取引がシンプルになります。DLL を必要とせず、Telegram のチャンネルやチャットから MetaTrader 5 プラットフォームに取引シグナルを直接コピーできる最新ツールです。この強力なソリューションは、正確なシグナル実行、豊富なカスタマイズオプション、時間の節約、そして効率性の向上を実現します。 [説明書 ] [   デモ ] 主な特徴 直接的なTelegram API統合 電話番号とセキュアコードで認証します。 ユーザーフレンドリーな EXE ブリッジを通じてチャット ID を簡単に管理できます。 複数のチャネル/チャットを追加、削除、更新して、同時に信号をコピーします。 高度なフィルターによる信号解析 例外的な単語 (例: 「レポート」、「結果」) を含む不要な信号をスキップします。 柔軟な SL および TP 形式 (価格、ピップ、ポイント) をサポートします。 価格ではなくポイントを指定するシグナルのエントリ ポイントを自動的に計算します。 注文のカスタマイズ
    DrawDown Limiter
    Haidar, Lionel Haj Ali
    5 (20)
    Drawdown Limiter EA You are in the right place if you were searching for Drawdown control, Drawdown limiter, Balance protection, Equity Protection or Daily Drawdown Limit related to Prop Firm, FTMO, or Funded account trading, or if you want to protect your trading account. Have you suffered from controlling your drawdown when trading funded accounts? This EA is meant for you. Prop firms usually set a rule called “Trader Daily Drawdown”, and if it is not respected, you are disqualified.  I am an
    Advanced trading tool: One click smart orders that execute under your conditions Developed by trader for trading community:  position size calculator (lot size), open position after price action, strategy builder, set and forget trading, mobile notifications... Risk Management -  Risk percentage position size calculator, gain percentage, target risk reward ratio, spread and commissions are included in calculations 7 Advanced order types  - Set and forget trading with price action automation (OC
    Everything for chart Technical Analysis indicator MT5 in one tool Draw your supply demand zone with rectangle and support resistance with trendline and get alerts to mobile phone or email alert -  Risk reward indicator mt5 Video tutorials, manuals, DEMO download   here .   Find contacts on my   profile . 1.   Extended rectangles and trendlines Object will be extended to the right edge of the chart when price will draw new candles on chart. This is rectangle extender or trendline extender. 2. Pri
    ************************************************ *********************************************** GoldMine Train は、ゴールドのトレンド取引戦略 EA です。 オペレーターは主要なトレンドの方向を決定し、トレインに指示を出します。 トレインはその方向で継続的に売買します。ロット数は、アカウント残高と事前設定されたレバレッジ比率によって異なります。 オペレーターがトレンドの方向を変更すると、トレインは停止し、利益を固定します。 ユーザーはチャート上のボタンを使用してトレンドの方向を簡単に選択できます。 ************************************************ ***********************************************
    Remote Trade Copier is an advanced tool designed for efficiently copying trades between accounts in both local and remote modes. It allows for lightning-fast order replication from a master account to a slave account. In local mode, trades are copied instantly, while in remote mode, the copying process takes less than 1 second. Local mode refers to both MetaTrader platforms being installed on the same system, whereas remote mode enables copying between MetaTrader installations on separate syste
    RSI Divergence Scanner is a multi-timeframe and multi-symbol dashboard and alert that checks all timeframes and symbols to find regular and hidden divergences between price chart and RSI indicator. This divergence scanner is integrated with support and resistance zones so you can check the RSI divergences in the most important areas of the chart to find trend reversals in price chart. Download demo version   (works on M4,M6,M12,M20,H3,H8 timeframes of 20 symbols of Market Watch window) Full desc
    「Entry In The Zone」と「SMC Multi Timeframe」は、スマートマネーコンセプト(SMC)に基づいたリアルタイム市場分析ツールです。このツールは、反転信号を効果的に統合し、マルチタイムフレーム構造検出を通じて主要な反転ゾーンを自動的に識別します。また、注目すべきポイント(POI)の識別も行います。これにより、トレーダーはより自信を持って、より構造化されたアプローチで取引計画を立て、意思決定を行うことができます。 主な機能: 自動市場構造検出(BOS  CHoCH、mBOS  mCHoCH) オーダーブロック、供給と需要ゾーン、フェアバリューギャップ(FVG)の識別 流動性ゾーン、プレミアムおよびディスカウントエリア、同一高値および同一安値 注目すべき同一高値 & 同一安値イント(POI) 取引セッションのタイミング(東京、ロンドン、ニューヨーク) 独自の取引スタイルに合わせたカスタマイズ可能なダッシュボード リアルタイムでの動作、シグナルの再描画なし。完全なマルチタイムフレームカバレッジで 自信を持った取引決定をサポートします。 さらに、リスク・パー・
    A "simple design" trading panel, which is characterized by small byte size, low CPU usage, simple steps, and quick operation, 1 to 2 clicks to complete a functional operation, saving time and increasing efficiency . The panel is easy to use, and it is not complicated to set parameters, which is in line with traders' habits. At the same time, its compact- design, clear at a glance, and comprehensive functions are a powerful tool for manual trading! Key features of the panel:   Click "Bid/Ask Pri
    Trader Evolution
    Siarhei Vashchylka
    5 (6)
    " Trader Evolution " - A utility designed for traders who use wave and technical analysis in their work. One tab of the utility is capable of money management and opening orders, and the other can help in making Elliott wave and technical analysis. Manual (Be sure to read before purchasing) | Version for MT4 Advantages 1. Trading in a few clicks. Immediate and pending orders are available in the panel 2. Money management. The program automatically selects the appropriate lot size 3. Simplifies
    コピー機->便利で高速なインターフェースインタラクション、ユーザーはすぐに使用できます     ->>>> WindowsコンピュータまたはVPS Windowsでの使用を推奨 特徴: 多様でパーソナライズされたコピー取引設定:1. 異なるシグナルソースに異なるロットモードを設定できます。2. フォワードコピー取引とリバースコピー取引に異なるシグナルソースを設定できます。3. シグナルはコメントで設定できます。4. 契約ロットに応じてロットを調整するかどうか 多様でパーソナライズされたコピー注文設定2:1.品種ごとに異なるロットモードを設定できます2.順方向コピー注文と逆方向コピー注文に異なる品種を設定できます3.コメントでシグナルを設定できます4.契約ロットに応じてロットを調整するかどうか コメントフィルタリング、MAGICフィルタリング、シグナルロットフィルタリング、ローカル製品フィルタリング 勤務時間設定 逆同期SLAVE終了 注文バインド機能: 任意の注文を設定されたシグナルソース注文にバインドできます (テーブルをダブルクリックして編集します) アカウントリスク管理 基本
    注意 :このエキスパートアドバイザーはストラテジーテスターでは動作しません。試用版をご希望の方は、私のプロフィールをご覧ください。 取扱説明書 自動ジャーナルをダウンロードするには、私のプロフィールをご覧ください RiskGuard Management – プロフェッショナルトレーディング、妥協なし RiskGuard Management は、利益を最大化し損失を最小限に抑えるために高度なリスク管理を活用したいすべてのトレーダーにとって、究極のパートナーです。ただのツールではなく、トレーディングプランの遵守、感情的なミスの回避、最大限の効率での運用をサポートする インテリジェントなシステム です。 資金を完全に保護 ロットサイズを動的に計算する高度なリスク管理 毎日のトレードプランに従って自動でポジションをクローズ 各取引のリスクを最適化するQuantumテクノロジー データのエクスポートと自動ジャーナル機能付きのプロフェッショナルな分析とレポート Quantum:トレーディングの常識を変える革新機能 Quantumはあなたのトレーディング統計と現在のドローダウンを分析し、各トレ
    MT5 To Notion
    Levi Dane Benjamin
    5 (3)
    このプログラムを使用すると、非常に使いやすいユーザーインターフェースを使用して、MetaTraderアカウントからすべての取引を直接Notionにエクスポートできます。 MT4バージョン  |  ユーザーガイド + デモ 開始するには、ユーザーガイドを使用してNotionテンプレートをダウンロードしてください。 デモをご希望の場合は、ユーザーガイドにアクセスしてください。ストラテジーテスターでは機能しません! 主な機能 取引アカウントからすべての取引をNotionにエクスポート 実行中の取引および保留中の注文をNotionにエクスポートし、更新 テンプレートを作成する 前日からの取引をエクスポート 前週からの取引をエクスポート 前月からの取引をエクスポート カスタム時間範囲からの取引をエクスポート 新しいクローズされた取引をすべて自動的にNotionに送信 エクスポートに含めるフィールドを選択します。注文タイプ、ボリューム、オープン時間、クローズ時間など 開始方法 上記のユーザーガイドに移動するか、EAを起動して「接続ヘルプを取得」をクリックします 接続後、「開始:すべての取引をエク
    Features   With MT5 to Interactive Brokers(IB) Trader, you can: 1. Load chart data from IB to MT5, and Analyze with all standard or customer Indicators. 2. Place Orders to IB Account Directly in MT5. 3. Make your Own EAs upon IB Securities by only making minus changes of the trading function. Usage 1) Installation Copy the "Mt5ToIBTraderEn.ex4" and sample files to [MT5 Data Folder]->MQL5->Experts.  2)  MT5 Settings Add the IP Address to the MT5 Allowed URLs in 'Tools->Options->Expert Adviso
    作者のその他のプロダクト
    The indicator shows the trend of 3 timeframes: higher timeframe; medium timeframe; smaller (current) timeframe, where the indicator is running. The indicator should be launched on a chart with a timeframe smaller than the higher and medium ones. The idea is to use the trend strength when opening positions. Combination of 3 timeframes (smaller, medium, higher) allows the trend to be followed at all levels of the instrument. The higher timeframes are used for calculations. Therefore, sudden change
    The indicator shows the market turning points (entry points). Reversals allow you to track rebound/breakout/testing from the reverse side of the lines of graphical analysis or indicators. Reversals can be an independent signal. The indicator allows you to determine reversals taking into account the trend and without it. You can choose a different period for the movement preceding the reversal, as well as the volatility coefficient. When plotting reversals, the indicator takes into account volati
    Measures the length of the selected movement in points, shows the duration of the movement, as well as the speed of movement.   Outputs the average value of each dimension. It is designed to calculate the expected target based on typical market movements. The intended goal will provide information about the ratio of the stop size to the possible profit and will allow you not to open positions with a small expected profit. It will also help you determine the point at which it is more logical to c
    The indicator allows you to quickly switch from one instrument to another, from one time period to another using the keyboard or buttons on the monitor. Each command can be assigned a hot key from 0-9, a-Z (case-insensitive) and VK_OEM_COMMA ("<" on the keyboard) and VK_OEM_PERIOD (">" on the keyboard). This can help you to operate the maximum number of instruments that are available at your broker, analyze more instruments/periods in less time. This product cannot be tested in the tester , beca
    This indicator allows you to measure the profitability of each specific transaction (the ratio of Stop and Profit). The indicator allows you to adjust the ratio by step size and number of steps. You can build an unlimited number of ratios to compare the risks from different movements. Note: in MT4, the number of horizontal lines in a single ratio cannot exceed 32. Building a line : click the " Ratio " button and draw a line (mouse click - the first point of the line, where the mouse is release
    The script displays info about the share's corporate reports and dividends. The data is downloaded from   investing.com : Report date Profit per share (EPS) Revenue Market capitalization Amount of dividends Date of payment of dividends Dividend income The product cannot be tested in the tester (since it is not possible to receive data from the Internet). Before launching:  Add 2   URL   https://ru.investing.com/earnings-calendar/Service/getCalendarFilteredData  and   https://ru.investing.com/di
    The Envelopes indicator determines the presence of a trend or flat. It has 3 types of signals, shows the probable retracement levels and levels of the possible targets. The Fibonacci coefficients are used in the indicator's calculations. Signals (generated when touching the lines or rebounding from lines): Trend - the middle line of the Envelopes has a distinct inclination; the lines below the channel's middle line are used for buy trades, the lines above the middle line and the middle line itse
    The indicator shows and highlights the chart candles, which are formed as a result of large players entering the market in large volumes. Such candles can also be formed after achieving a certainty on the market, when most of the participants hold positions in the same direction. The movement is likely to continue in that direction after such candles. The indicator highlights the significant candles from the existing ones on the chart; The indicator allows identifying the trends based on candles
    The indicator identifies the most suitable moment for entering the market in terms of market volatility, when the market has the strength to move (the signal is indicated by an arrow under the candle). For each of the signals, the presence of trends on the current and higher timeframes is determined, so that the signal is in the direction of the majority of positions opened on the market (denoted near the signal by abbreviations of timeframes with a trend present). The signal appears after the c
    The indicator displays the key support and resistance levels on the chart. The significance of these levels lies in that the price may reverse or strengthen the movement when passing such levels, since they are formed as a consequence of the natural reaction of market participants to the price movement, depending on which positions they occupied or did not have time to occupy. The psychology of the level occurrence: there always those who bought, sold, hesitated to enter or exited early. If the
    This indicator is a multitimeframe trading strategy. It has the levels for stop loss, take profit and entry point. The order level can also be set manually. The indicator uses the regularity of the market, which manifests itself on all instruments, and does not require adjustment of the parameters. The strategy uses a proprietary approach to determining: trend, volatility, hierarchy of timeframe significance, the size of the history period (the number of candles), which is important for making a
    Trend Sync
    Pavel Verveyko
    5 (1)
    The indicator shows the trend of 3 timeframes: higher timeframe; medium timeframe; smaller (current) timeframe, where the indicator is running. The indicator should be launched on a chart with a timeframe smaller than the higher and medium ones. The idea is to use the trend strength when opening positions. Combination of 3 timeframes (smaller, medium, higher) allows the trend to be followed at all levels of the instrument. The higher timeframes are used for calculations. Therefore, sudden change
    The indicator detects important peaks and troughs (extremes) on the chart. These points can be used to plot support/resistance levels and trend lines, as well as any other graphical analysis. These points can serve as reference points for setting trading orders. The indicator does not redraw . Settings: Size_History  - the size of the calculated history. Num_Candles_Right  - number of candles to the right of the peak or trough. Num_Candles_Left  - number of candles to the left of the peak or
    The indicator draws support and resistance lines on an important part of the chart for making decisions. After the trend line appears, you can trade for a breakout or rebound from it, as well as place orders near it. Outdated trend lines are deleted automatically. Thus, we always deal with the most up-to-date lines. The indicator is not redrawn . Settings: Size_History  - the size of the calculated history. Num_Candles_extremum  - the number of candles on each side of the extremum. Type_Arrow
    The indicator shows key volumes confirmed by the price movement. The indicator allows you to analyze volumes in the direction, frequency of occurrence, and their value. There are 2 modes of operation: taking into account the trend and not taking into account the trend (if the parameter Period_Trend = 0, then the trend is not taken into account; if the parameter Period_Trend is greater than zero, then the trend is taken into account in volumes). The indicator does not redraw . Settings History_S
    This trading system is based on market impulses of varying complexity.   To generate a signal, the indicator uses the moments when the direction of the pulse and the necessary section of the trend coincide. The indicator also takes into account the current market volatility. Stop_loss tags can be set with the parameter "0" or "1", then Stop_Loss will take into account market volatility.   Take_Profit tags can be set with the parameter "0", then Take_Profit will take into account market volatil
    The stocks that make up the index are one of the drivers of the movement. Analyzing the financial performance of all elements of the index, we can assume further development of the situation. The program (script) displays corporate reports of shares that are part of the index selected in the settings.   "Indexes" cannot be tested in the tester (since there is no way to get information from the Internet). Information is downloaded from the site investing.com: Report Date Earnings per share (E
    The indicator builds a graphical analysis based on the Fibonacci theory. Fibo Fan is used for the analysis of the impulses and corrections of the movement. Reversal lines (2 lines at the base of the Fibonacci fan) are used to analyze the direction of movements. The indicator displays the of 4 the target line in each direction. The indicator takes into account market volatility. If the price is above the reversal lines, it makes sense to consider buying, if lower, then selling. You can open posi
    The indicator determines the state of the market: trend or flat. The state of the market is determined by taking into account volatility. The flat (trading corridor)is displayed in yellow. The green color shows the upward trend. The red color shows the downward trend. The height of the label corresponds to the volatility in the market. The indicator does not redraw . Settings History_Size   - the amount of history for calculation. Period_Candles  - the number of candles to calculate the indicat
    The indicator plots flexible support and resistance levels (dots). A special phase of movement is used for construction. Levels are formed dynamically, that is, each new candle can continue the level or complete it. The level can provide resistance or support to the price even where it is no longer there. Also, support and resistance levels can change roles. The importance of levels is affected by: the amount of time the level is formed and the number of touches. The significance of these lev
    The indicator is a trading system for short-term trading. Scalper Assistant helps to determine the direction of the transaction, and also shows the entry and exit points. The indicator draws two lines (possible points for opening positions). At the moment of the breakdown of the upper line up (and when all trading conditions are met), an up arrow appears (a buy signal), as well as 2 goals. At the moment of the breakdown of the lower line down (and when all trading conditions are met), a down ar
    The trading system is designed to work with gold on time periods: 30M, 1H. The indicator allows you to adjust to the market situation. Parameters for 1H :   PERIOD=9F ,   FILTER=300 .   Parameters for  30M :   PERIOD=22B ,   FILTER=450 .   A small adjustment to a specific broker is allowed .   If you change the amount of history displayed, you may also need to adjust the parameters. The indicator is not redrawn.     "Gold n XAU" uses different rules for entering a trade and different rules fo
    The indicator builds "psychological levels": levels of round numbers and intermediate levels of round numbers. Round numbers play an important role in forming support and resistance levels. There is a pattern in which the decline or growth of the price can stop at round numbers. The level whose price ends at 0 is the level of a round number of the first order. Intermediate level, this is the level between two round levels, for example, between 10 and 20 this is level 15. In the " Num_Zeros "
    Ichimoku Map (instant look at the markets) - built on the basis of the legendary Ichimoku Kinko Hyo indicator. The task of the Ichimoku Map is to provide information about the market strength on the selected time periods and instruments, from the point of view of the Ichimoku indicator. The indicator displays 7 degrees of buy signal strength and 7 degrees of sell signal strength. The stronger the trend, the brighter the signal rectangle in the table. The table can be dragged with the mouse. The
    The indicator displays a stock chart of a non-standard type, in which the price and time have the same value. The usual chart of Japanese candlesticks does not take into account all the information that the time analysis can give. Renko charts do not use all the information that price can give in relation to time. The "Chart Price and Time" indicator takes into account price and time equally and shows the predominance of price or time. Taking into account price and time equally gives an idea
    The indicator tracks sharp volatility (moments when the market has shown increased activity and movement may occur), on the selected instruments and time periods. The information is displayed as colored rectangles. Thus, it is possible to assess at a glance which tool should be given priority attention. The indicator will be useful for scalpers when they need a quick reaction or for traders working with a large number of instruments. The indicator does not redraw. The indicator displays 8 degree
    The Alert Creator indicator is designed to create alerts for selected conditions. You can select one or several indicators for the notification. If several conditions are selected, the alert is triggered when all the selected conditions are met. The signals can be configured separately for buying and separately for selling. Example, a buy alert: the closing price is above the moving average, the RSI is below 20. (In this example, 2 indicators are used to generate an alert: MA and RSI) At the
    The indicator determines the strength of the trend and its possible reversal points, based on the author's arithmetic approach . Each new peak or trough is a trend development. Such peaks and troughs are numbered so that the strength of the trend development can be seen. Attempts to change the trend are also numbered. This gives an understanding of a possible change in the direction of the trend. Indicator signals are generated when trying to change the trend . In the settings, it is possible
    The indicator draws potential levels that may become significant support and resistance levels in the future. The longer the line, the higher the probability of a price reversal or an increase in price movement after the breakdown of this level. With a decrease in the probability of the formation of a level, the length of the line is reduced. The indicator does not require adjustment. In the settings, you can change the design of the indicator. The "L ine_Length " button is placed on the ch
    The indicator defines a trading corridor, a flat market, and corrections. Allows you to compare the significance of different flat and trend areas (by time of existence and by volatility). This makes it possible to assess the market cycle and its mood at a glance. That is, how long does the flat last on average, and how long is the trend and what kind of volatility they have in points. As a rule, the longer the flat lasts, the more likely it is to accumulate the potential for a strong movem
    フィルタ:
    レビューなし
    レビューに返信
    バージョン 1.4 2020.12.09
    Added on-screen buttons.
    On-screen buttons can be dragged with the mouse. The text label "tool/period" moves along with the buttons.
    Now you can also assign numbers 0-9 to on-screen buttons.
    You can hide on-screen buttons. In this case, the text label is moved to the upper-left corner. you can select the text label with the mouse and move it to any convenient location.
    The size of on-screen buttons depends on their font and font size.
    Keyboard shortcuts work regardless of whether there are on-screen buttons.
    バージョン 1.2 2020.06.09
    Recompilation.
    バージョン 1.1 2017.06.29
    Fixed minor error.