Conheça o Mercado MQL5 no YouTube, assista aos vídeos tutoriais
Como comprar um robô de negociação ou indicador?
Execute seu EA na
hospedagem virtual
hospedagem virtual
Teste indicadores/robôs de negociação antes de comprá-los
Quer ganhar dinheiro no Mercado?
Como apresentar um produto para o consumidor final?
Indicadores Técnicos para MetaTrader 5 - 22

Transforme sua análise de gráficos financeiros com nosso inovador Indicador de Coloração de Candles. Este poderoso recurso permite que você visualize instantaneamente as tendências de mercado com base nos preços de fechamento em relação a uma média personalizada. Coloração Personalizada: Escolha as cores que melhor se adequam ao seu estilo de análise. Destaque candles acima da média em uma cor vibrante de sua escolha e os candles abaixo da média em outra cor distintiva. Média Ajustável: Adapte
FREE

Investment Castle Support and Resistance Indicator has the following features: 1. Dictates the direction of Buy or Sell trades based on Support and Resistance Levels automatically . 2. Candles stick colors will change to Red for Sell and Blue for Buy (Default settings, user can change from the inputs). 3. This indicator is built-in the Support & Resistance based Investment Castle EA which works with Psychological Key Levels "Support & Resistance".
FREE

O Verve AI Reversal Pro Indicator Pro é o companheiro de trading definitivo para quem exige precisão absoluta e uma compreensão inigualável da dinâmica do mercado. Aproveitando o poder da inteligência artificial de última geração, esta ferramenta sofisticada analisa continuamente a ação do preço, o volume e a volatilidade para identificar pontos de reversão de alta probabilidade antes mesmo de se formarem completamente. Ao combinar de forma fluida algoritmos avançados de machine learning com pr

MyHistogram MT5 O indicador MyHistogram é uma ferramenta de análise técnica poderosa projetada para ajudar os traders a visualizar a distância entre os extremos de preço e uma média móvel. Ao calcular e exibir essa distância em um formato de histograma, o indicador MyHistogram permite que os traders avaliem rapidamente as tendências do mercado, identifiquem reversões potenciais e tomem decisões de negociação mais informadas. O indicador MyHistogram é altamente personalizável, permitindo que os u
FREE

Channels indicator does not repaint as its based on projecting the falling and raising channels. As a trader you need a path to be able to place your buy and sell trades such as: Supply and Demand , Falling & raising channels. Falling and raising channels can be in any time frame and also can be in all time frames at the same time and the price always flows within these channels. Experienced trades will draw the key levels and channels around the time frames. But, they will not be able to draw
FREE
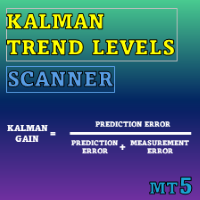
Special offer : ALL TOOLS , just $35 each! New tools will be $30 for the first week or the first 3 purchases ! Trading Tools Channel on MQL5 : Join my MQL5 channel to update the latest news from me Kalman Trend Levels é um indicador avançado de acompanhamento de tendências que utiliza a tecnologia de ponta do filtro de Kalman para fornecer aos traders sinais analíticos poderosos. Projetado para precisão e adaptabilidade, esta ferramenta não apenas identifica zonas críticas de supor

Initiated in 1995 by the physicist and technical analyst Paul Levine, PhD, and subsequently developed by Andrew Coles, PhD, and David Hawkins in a series of articles and the book MIDAS Technical Analysis: A VWAP Approach to Trading and Investing in Today's Markets.Latterly, several important contributions to the project, including new MIDAS curves and indicators, have been made by Bob English, many of them published in the book.
FREE

Topos e Fundos Indicator GRATUITO Topos e Fundos: Um eficaz indicador para suas negociações
O indicador de topos e fundos lhe ajuda a perceber as formações de canais ascendentes e descendentes com indicações de topos e fundos ascendentes e/ou descendentes. Além disto ele informa possíveis oportunidades sinalizando com um pequeno círculo amarelo quando o indicador encontrar uma formação de impulso. Com este indicador terás mais segurança e rapidez em suas tomadas de decisão de entradas. Teste
FREE

Dark Breakout is an Indicator for intraday trading. This Indicator is based on Trend Following strategy, providing an entry signal on the breakout. The signal is provided by the arrow, which confirms the breaking of the level. We can enter in good price with this Indicator, in order to follow the main trend on the current instrument. It is advised to use low spread ECN brokers. This Indicator does Not repaint and N ot lag . Recommended timeframes are M5, M15 and H1. Recommended working pairs

Signal provider based on RSI Divergences
from a higher timeframe.
First 3 buffers export a signal.
Timeframe for which divergences are detected is optional, see
'RSI divergences timeframe' parameter.
The indicator uses different algorithms for divergences detection:
'Fast' algorithm is the simplest solution that works the fastest.
'Strict' algorithm filters out more noise but works slower than the previous one.
'Full' algorithm uses recursive functions and provides with lots of divergences
FREE

Push Notif for Mobile Trading: Detect Trend and Consolidation Overview Push Notif for Mobile Trading: Detect Trend and Consolidation is a custom MetaTrader 5 (MT5) indicator developed by Ritz_EANEHA that intelligently detects whether the market is in a trend (bullish/bearish) or in consolidation (sideways) . It uses a proprietary comparison of Standard Deviation (StdDev) and Average True Range (ATR) to assess volatility and market structure, and sends mobile push notifications to alert t
FREE

O Trend Panel é uma ferramenta simples e conveniente que exibirá uma direção de tendência confirmada dos timeframes M1 - D1 usando dez pares escolhidos pelo usuário.
O indicador foi projetado para adicionar confirmação de direção em qualquer estratégia/modelo e também funcionar como uma interface interativa limpa para alterar rapidamente o gráfico para um par ou período de tempo diferente. Bate-papo em grupo: https://www.mql5.com/en/users/conorstephenson Entre em contato comigo após a compra
FREE

What are Donchian Channels? Donchian Channels are three lines generated by moving average calculations that comprise an indicator formed by upper and lower bands around a mid-range or median band. The upper band marks the highest price of a security over N periods while the lower band marks the lowest price of a security over N periods. The area between the upper and lower bands represents the Donchian Channel. Career futures trader Richard Donchian developed the indicator in the mid-twentieth c
FREE

If you love this indicator, please leave a positive rating and comment, it will be a source of motivation to help me create more products <3 Key Takeaways Fisher is a repaint indicator. It recalculates previous bars when new bars become available. Modified to avoid repainting to accommodate some merchants. Fisher indicator is quite a simple histogram indicator that detects the trend's direction and strength and signals about trend changes. Traders look for extreme readings to signal potential p
FREE

QuantumAlert CCI Navigator is a free indicator available for MT4/MT5 platforms, its work is to provide "alerts" when the market is inside "overbought and oversold" regions in the form of "buy or sell" signals. This indicator comes with many customization options mentioned in the parameter section below, user can customise these parameters as needful. Join our MQL5 group , where we share important news and updates. You are also welcome to join our private channel as well, contact me for the pri
FREE

Wyckoff fans, enjoy!
Ideally to be used with the Weis Waves indicator, but it can be easily used alone, the Waves Sizer puts the range (in resulting Price movement) done by the Price on its market swings. You can control how accurate or loose will be the swings. This tool is very helpful for visually know how much the Price has traveled in your Timeframe. This way you can confront this level of effort with the resulting Volume, etc... Weis Waves indicator:
https://www.mql5.com/en/market/produc
FREE

Este é um indicador de agressão comprador e vendedor que analisa o formato de cada vela e projeta esses dados em forma de histograma.
Há 4 histogramas em um só. Na parte frontal temos dois: Superior - força compradora Inferior - força vendedor Na parte de trás temos também dois histogramas, ambos da mesma cor. Eles medem a força conjunta dos compradores e vendedores. Esses histogramas podem ser desativados nos Parâmetros de Entrada. É possível também ter o volume real ou de tick para fazer essa
FREE

This indicator show Gann Swing Chart (One Bar) with multi layer wave. 1. Wave layer F1: Gann waves are drawn based on candles. SGann wave(Swing of Gann) is drawn based on Gann wave of wave layer F1. 2. Wave layer F2: Is a Gann wave drawn based on the SGann wave of wave layer F1. SGann waves are drawn based on Gann waves of wave layer F2. 3. Wave layer F3: Is a Gann wave drawn based on the SGann wave of wave layer F2. SGann waves are drawn based on Gann waves of wave layer F3. ---------Vi
FREE

This indicator identifies and highlights market inefficiencies, known as Fair Value Gaps (FVG), on price charts. Using a custom algorithm, the indicator detects these areas of imbalance where the price moves sharply, creating potential trading opportunities. Indicator Parameters: Bullish FVG Color (clrBlue) : Color used to highlight bullish inefficiencies. The default value is blue. Bearish FVG Color (clrRed) : Color used to highlight bearish inefficiencies. The default value is red. Bullish FVG
FREE
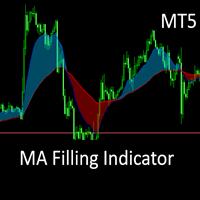
This is the MT5 converted Version of the The MA Filling Indicator, developed by Scriptong, is an advanced technical analysis tool designed for MetaTrader 4 (MT4) that enhances the traditional Moving Average (MA) indicator by incorporating a visually intuitive filling feature. The MA Filling Indicator is a versatile tool suitable for both novice and experienced traders seeking to enhance their trend-following strategies with a clear, color-coded representation of market dynamics Settings: Upward
FREE
A Renko Tick chart based on continuously adjusting percentage.
Live Renko bricks formed by tick data
Adjustable brick width expert for indicator attached Scalp with a Renko, get weird.
The settings can and will break the script if you turn them up too high. Turning off outline mode will not look as nice, but can potentially allow for a larger number of bricks.
FREE

Description: For a comprehensive understanding of our indicators, we invite you to explore the entire Q&A section within this MQL5 blog post here . The "Live Account Statistics" Indicator is a powerful technical analysis tool that provides real-time insights into the performance of your trading account. With this indispensable tool, you can access crucial account statistics, such as balance, equity, drawdown, and more, allowing you to make data-driven trading decisions. Key Features: Real-Ti
FREE
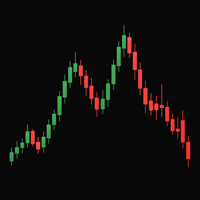
Simple Strategy Indicator
The Simple Strategy Indicator is a powerful yet easy-to-use tool designed to identify the current trend direction with high confidence. It combines three well-known indicators: MACD , RSI , and Stochastic Oscillator to provide clear and reliable signals.
Trend Detection Logic:
Buy Signal : When MACD crosses above its signal line, RSI > 50, and Stochastic > 50. Sell Signal : When MACD crosses below its signal line, RSI < 50, and Stochastic < 50. Features:
Works on a
FREE

Este indicador desenha o Parabolic SAR. Linhas superior e inferior com cores personalizáveis. Com um parâmetro adicional denominado “Validate Signals”, que identifica falsos rompimentos e altera a cor da linha para cinza.
Parâmetros de Entrada: Step (padrão é 0.02 ) Maximum (padrão é 0.2 ) Applied Price High (padrão é High price) Applied Price Low (padrão é Low price) Validate Signals (valor booleano para filtrar falsos rompimentos, padrão é true)
FREE

Swiss CandleTime What ist CandleTime for This indicaor just displays the remaining time for a candle to build. It is best used if you trade with timframes from 3 minutes. I use it in M3 to keep postions. If I have two following red candles i usually liquidate the position. Timeframes M1 to H1 Inputs Arrow displayed => Edit your arrow string Arrow for waiting conditions => Arrow if chart is offline Text Color => color of the text Tell if there is a trend change => tells you, if the two preciding
FREE

The "Matrix Series" indicator is a technical analysis tool designed to identify potential support and resistance zones by visualizing overbought/oversold conditions and trend direction using a combination of price data and customizable parameters, incorporating Commodity Channel Index (CCI) to highlight potential reversal points within the market.
Key features of the Matrix Series indicator: Dynamic Zones: Calculates support and resistance levels based on CCI values, allowing users to adjust th
FREE

This indicator demonstrates the probable dynamic support and resistance levels of EMA, Ichimoku lines, and Key OHLC levels for different timeframes on one chart. This can drastically reduce the time and effort needed for switching between different timeframes.
EMA and Ichimoku Levels are drawn for the M1, M5, M15, M30, H1, H4, and D1 timeframes, and the Key OHLC levels of the last periods are drawn for the H4, D1, W1, and MN1 timeframes.
FREE

Индикатор PivotPointSuperTrend отлично показывает данные Тренд на основе мат данных от Pivot и ATR и очень удобен для входа в сделку и выставления стопов. Если кто то сможет добавить в код мултитаймфрем, я и многие пользователи будут очень Благодарны, то есть чтобы ондикатор показывал значение старшего таймафрема на графике младшего таймфрема, Заранее Спасибо!
FREE
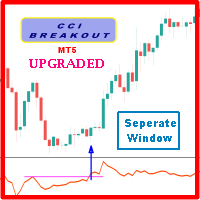
Probability emerges to record higher prices when Commodity Channel Index breaks out oscillator historical resistance level when exhibit overbought values. Since, oscillator breakout of support and resistance have similar effect as price breaks support and resistance levels, therefore, its highly advised to confirm price breakout with oscillator breakout; certainly, will have the same output in short trades. Concept is based on find swing levels which based on number of bars by each side of peak
FREE

Este é um indicador de pregões que pode exibir todos os níveis (Aberto-Alto-Baixo-Fechar) durante quatro sessões. O indicador também pode prever os níveis da sessão. As sessões podem ser desenhadas com linhas ou retângulos (vazios ou preenchidos), as linhas podem ser estendidas para a próxima sessão. Você pode facilmente ocultar/mostrar cada sessão pressionando teclas de atalho (por padrão '1', '2', '3', '4').
Você pode ver linhas ASR (intervalo médio de sessão) (tecla de atalho padrão 'A'
As the suggested, with this indicator you are able to switch from one symbol or timeframe to another in the same single chart. So forget about opening tons of chart on your screen! It's not designed for ICT or SMC trader, but if you are that kind of trader you still can use it. Imagine you have a strategy containing various indicators and settings, on a single chart you can screen the entry opportunity then move to the next symbol or timeframe.
FREE

If you love this indicator, please leave a positive rating and comment, it will be a source of motivation to help me create more products <3 How to use Aroon Indicator? The AroonUp and the AroonDown measure the strength of the uptrend and the strength of the downtrend, respectively. These lines fluctuate between zero and 100. Values close to 100 indicate a strong trend and values near zero indicate a weak trend where the lower the AroonUp, the weaker the uptrend and the stronger the downtrend,
FREE

The Magic LWMA indicator is of great help in determining trend direction. It can be an excellent addition to your existing strategy or the basis of a new one. We humans can make better decisions when we see better visually. So we designed it to show a different color for rising and falling trends. Everyone can customize this in the way that suits them best. By setting the Trend Period, we can optimize it for longer or shorter trends for our strategy. It is great for all time frames.
IF YOU NEE
FREE

About testing Mode: You should download the version for MT4 to test instead. https://www.mql5.com/en/market/product/109093?source=Site+Market+My+Products+Page#description
1. Compound Drawings (1) Line segment with arrow (2) Continuous line segment (broken line) (3) Parallelogram (4) Polygon (5) Profit and loss ratio measurement tools
2. Backtracking By the Z key in the process of drawing the line Line types that support Z-key backtracking: continuous line segments (broken line) ,

Análise de trading precisa na ponta dos dedos: software de análise de trading de última geração O software de análise de trading convencional disponível no mercado geralmente fornece apenas estatísticas de índice de lucro e perda por hora ou semana, o que não atende à necessidade de uma análise de trading mais precisa. No entanto, no mercado de trading real, cada dia apresenta circunstâncias únicas. As segundas-feiras são tranquilas, as quartas-feiras são ativas com juros noturnos triplos e as
FREE
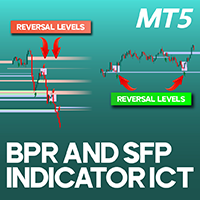
BPR + SFP Indicator in ICT MT5
The BPR + SFP Oscillation Breakout Indicator merges BPR and SFP patterns within technical analysis to detect market trends and highlight optimal trade entry points. This synergy relies on market dynamics and trader responses to significant price zones such as support and resistance levels, liquidity accumulation areas, breakout and pullback zones, and market highs and lows . This indicator assesses oscillation breakouts, verifies breakout and pullback movements at
FREE

Introduction
The RSI Plus is an innovative technical analysis tool designed to measure the strength and direction of the market trend. Unlike the traditional RSI indicator, the RSI Plus boasts a distinctive ability to adapt and respond to market volatility, while still minimizing the effects of minor, short-term market fluctuations.
Signal
Buy when the RSI plus has been in the oversold (red) zone some time and it crosses above the 20 level on previous candle close
Sell when the RSI plus ha
FREE
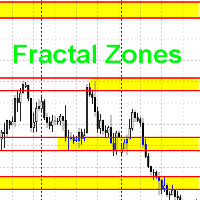
Данный индикатор рисует торговые зоны по фракталам со старших периодов, что упрощает торговлю по уровням.
На одном графике данный индикатор рисует два типа торговых зон. Например если текущий период - H1, то торговые зоны будут искаться по фракталам с H4 и с D1. В стандартных настройках фрактальные зоны с H4 будут рисоваться желтым цветом, а с D1 - зеленым. При наложении зон, происходит смешивание цветов в месте пересечения зон. Как данную вещь поправить, я не знаю в данный момент.
Принцип пои
FREE
Introducing the Fair Value Gap Indicator : A Simple and Effective Trading Tool The Fair Value Gap Indicator is designed to help traders easily identify and utilize Fair Value Gaps (FVGs) in their trading strategies. FVGs highlight price imbalances that the market often revisits, offering potential trade entry or exit opportunities. Whether you're a beginner or an experienced trader, this indicator simplifies the process of spotting these valuable zones, allowing you to trade with clarity and co
FREE

Ultron Candle Timer
Used for any timeframe to keep track of time remaining on current candle. User can change inputs and colors. Never wonder again about the time remaining until the next candle. Will work on any market and any chart. Adjust the color to blend in with any of your current chart template. Its a very simple and easy to use indicator but it comes in handy
FREE

Versión Beta El indicador técnico Non Lag MA MTF (Non-Lagged Moving Average Multi-Time Frame) es una versión avanzada del Non Lag MA que permite visualizar la media móvil en varios marcos temporales simultáneamente. Pros: - Visión integral: Proporciona una visión más completa al mostrar la media móvil en diferentes marcos temporales en un solo gráfico. - Anticipación de tendencias: Ayuda a anticipar cambios de tendencia al observar la convergencia o divergencia de las medias móviles en distint
FREE

Here is the boom and crash crazy Ma scalper a secretly coded color MA that is 1000% NON-REPAINT Works best on boom and crash 1000 Can be used on all timeframes from the 1 Minute timeframe to the Monthly timeframe The indicator is also a multi-time frame indicator you can select which timeframe to use The indicator is made for scalping purposes. as the trend changes the color of the indicator changes all well

MetaCOT 2 is a set of indicators and specialized utilities for the analysis of the U.S. Commodity Futures Trading Commission reports. Thanks to the reports issued by the Commission, it is possible to analyze the size and direction of the positions of the major market participants, which brings the long-term price prediction accuracy to a new higher-quality level, inaccessible to most traders. These indicators, related to the fundamental analysis, can also be used as an effective long-term filter
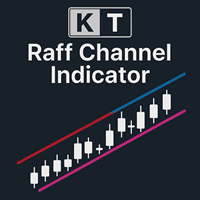
O KT Raff Channel é uma versão aprimorada e refinada do conceito original do canal Raff, desenvolvido por Gilbert Raff em 1996. Este indicador expande o trabalho inicial de Raff, incorporando modificações e avanços para oferecer aos traders uma ferramenta mais sofisticada e poderosa. Gilbert Raff, um nome renomado na área de análise de mercados financeiros, é o criador do Canal de Regressão Raff. Esta ferramenta técnica foi projetada para identificar e validar possíveis tendências de preços de
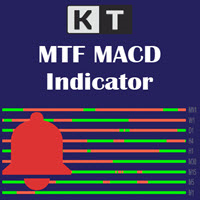
Como trader, monitorar vários períodos de tempo simultaneamente ajuda você a entender melhor a tendência do mercado e identificar quando os diferentes períodos estão alinhados ou em desacordo. O KT Multiple Time Frame (MTF) MACD exibe a direção geral de um ativo em um único gráfico ao mostrar o MACD (convergência/divergência de médias móveis) de todos os timeframes. O indicador apresenta uma tabela simples com a tendência do MACD para cada período. Também permite visualizar se o MACD está ganhan

The DR IDR Range Indicator PRO plots ADR, ODR and RDR ranges for a given amount of days in the past. A key feature that appears is that it calculates the success rate of the ranges for the shown days. This indicator is perfect for backtest since it shows ranges for all of the calculated days, not just the most recent sessions. In the PRO version you can now: use fully customizable advanced statistics to base your trades on get an edge via calculating statistics on up to 3 different day period
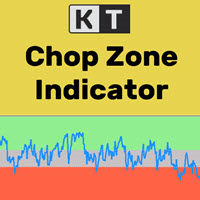
É um fato bem conhecido que os mercados financeiros tendem apenas cerca de 30% do tempo, enquanto nos outros 70% movimentam-se dentro de uma faixa lateral. No entanto, a maioria dos traders iniciantes tem dificuldade em identificar se o mercado está em tendência ou preso em um movimento lateral. O KT Chop Zone resolve esse problema ao destacar claramente a fase do mercado em três zonas: Zona de Baixa, Zona de Alta e Zona de Consolidação (Chop Zone).
Recursos
Melhore instantaneamente sua negocia

Smart Drawing Assist PRO MT5. Buttons will appears next to the selected object. The buttons are straightforward and amazingly easy to use. Features are as follow: Draw zigzag . Enabling you to draw patterns, draw zigzag, and draw shapes. All you have to do is click the button and start clicking point to point and it will draw automatically. Change object color . Rectangle/Trendline/HLine/Vline/Text/Price Arrow/Arrowed Line/ and your suggestion please. Flatten trendline . make a perfect flat line
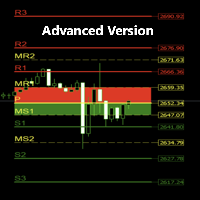
Detailed Description: The Pivot Points Buy Zone Advanced Indicator takes the concept of pivot points to a whole new level, providing traders with enhanced functionality, customizations, and in-depth visualizations. Unlike the free basic version, this advanced indicator allows users to customize more settings, analyze current and historical pivot points, enable potential buy (green) and sell (red) set-ups on the chart, use alerts and pop-up messages, ... etc. Extra Key Advanced Features: Fully C

Volume Delta Candles: A Comprehensive Tool for In-Depth Trading Analysis Unlock a seamless way to interpret trading experience within each candle. With Volume Delta Candles, there's no need for additional volume indicators—everything you need is built in. This advanced tool utilizes lower timeframes or live market data to present the percentage of buying versus selling volume within each candle as an intuitive color-coded bar. Before diving in, ensure you’re familiar with Volume and Volume Delta
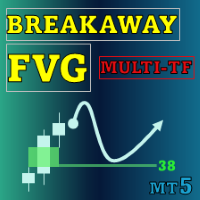
Special offer : ALL TOOLS , just $35 each! New tools will be $30 for the first week or the first 3 purchases ! Trading Tools Channel on MQL5 : Join my MQL5 channel to update the latest news from me A ferramenta Breakaway Fair Value Gaps (FVG) é uma solução inovadora projetada para ajudar traders a identificar áreas onde o preço se afastou do equilíbrio, fornecendo insights detalhados sobre as probabilidades de mitigação. Esta ferramenta não apenas destaca sinais críticos, mas també

Display your Local Time on your charts
Now available for MT5 with new features! Display your local time instead of (or along with) MT5 server time.
Display crosshair to highlight current candle time.
Automatically adjusts based on chart zoom (zooming in or out).
Displays on every timeframe (M1 - Month, including all MT5 timeframes), and auto-adjusts as chart timeframe is changed.
Handles special ½ hour time zones , such as India.
Renders fast (no lag) as you scroll charts.
Custom

Indicator introduction: The indicator draws wave lines and histograms, It has small price lag, and the signal will not drift. The indicator can send emails, alerts and notifications to you when previous k line has an up arrow and it is under the histogram sections or it has a down arrow. you can choose whether or not to send the two kind of alerts, the alerts repetition times can also be changed. If the indicator appears red and green histograms, this is a buy zone. It can be used to analyze mar
FREE

VolumeFlow é um indicador rastreador Acumulação/Distribuição de Volume de determinado ativo. Trabalha de forma similar ao OBV, porém é muito mais requintado e contempla as opções de se usar: Abordagem Clássica = OBV; Abordagem do Volume Útil; Abordagem de Gail Mercer; Parâmetros de Entrada: Tipo de Abordagem : Explicado acima; Tipo de Volume : Real ou Ticks; Recomendações: Lembre-se: Os PICOS ou FUNDOS deixados pelo indicador são bons pontos de Trade Location. Isso por que os players que ficaram
FREE

Este indicador para MetaTrader 5 identifica e exibe visualmente os horários de funcionamento dos principais mercados financeiros (Europa, EUA e Ásia) no gráfico. Através de preenchimentos coloridos personalizáveis, marca os períodos de negociação de cada mercado, respeitando os horários do servidor (GMT+2) e excluindo finais de semana. Os nomes dos mercados são exibidos próximos ao topo do gráfico em fonte Arial Black, também com cor personalizável. O indicador ajusta-se automaticamente à escala
FREE

Channel Vertex is a price action pattern formed by price Chanel and a triangle pattern . Price channels basically indicates possible support and resistance zones around a price movement and retracement or breakout at these levels can indicate possible trend continuation or reversal .
Majority of the times price fluctuations forms triangle patterns defined by 3 vertexes , these triangle patterns most times defines a trend continuation. A triangle pattern is a trend continuation pattern that
The indicator shows the trend of 3 timeframes: higher timeframe; medium timeframe; smaller (current) timeframe, where the indicator is running. The indicator should be launched on a chart with a timeframe smaller than the higher and medium ones. The idea is to use the trend strength when opening positions. Combination of 3 timeframes (smaller, medium, higher) allows the trend to be followed at all levels of the instrument. The higher timeframes are used for calculations. Therefore, sudden change

The Pairs Spread indicator has been developed for the popular strategy known as pairs trading, spread trading, or statistical arbitrage. This indicator measures the distance (spread) between prices of two directly (positively) correlated instruments and shows the result as a curve with standard deviations. So, traders can quickly identify when the instruments are too far apart and use this information for trade opportunities.
How to use the Pairs Spread indicator Best results are attained

Session Box Indicator for MetaTrader 5
Description: The SessionBox indicator is designed to visually represent the trading sessions on a chart, specifically the Asian, European, and American sessions. This indicator draws customizable rectangles around each session, allowing traders to easily identify different trading periods. It also includes labels to denote each session, enhancing clarity.
Users only need to input the session start and end hours in their server time. Please note, the Asia
FREE

I present the well-known Moving Average indicator.
This indicator is presented as a channel, where the upper and lower lines are equidistant from the main line by a percentage set by the user.
The indicator is easy to use. The basic settings of the moving average have been saved and a percentage parameter (Channel%) has been added.
Basic parameters:
Channel% - shows how much we want to deviate from the main line.
The indicator is freely available.
FREE
GapDetector Pro - Intelligent Multi-Timeframe Gap Detection
Unlock trading opportunities with this powerful MetaTrader indicator that detects price gaps in real-time
Key Features:
GapDetector Pro is an advanced tool that identifies: - Potential gaps (yellow signal) based on low volume, wide spreads, and low-liquidity sessions - Confirmed gaps (white signal) when price jumps significantly between candles - Customizable filters to adapt to any trading strategy and currency
FREE

Este indicador multi-quadro de tempo e vários símbolos identifica os padrões duplo superior / inferior, cabeça e ombro, flâmula / triângulo e bandeira. Também é possível configurar alertas apenas quando uma ruptura do decote / triângulo / mastro tiver ocorrido (ruptura do decote = sinal confirmado para parte superior / inferior e cabeça e ombros). O indicador também pode ser usado no modo de gráfico único. Por favor, leia mais sobre esta opção no produto blog . Combinado com suas própria

Certainly! Let me introduce you to a powerful tool for MetaTrader 5 (MT5) that can automatically identify and draw support and resistance (S&R) levels on your trading charts. This tool is called the “Support and Resistance Levels Guru” . Support Resistance Levels Guru The Support & Resistance Indicator automatically displays essential S&R levels on your chart. These levels are crucial for technical analysis and are used by many traders. Resistance levels (zones) are shown in R ed , while suppo
FREE
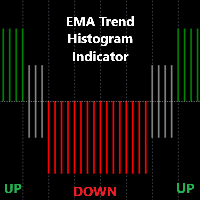
Detailed Description: The EMA Trend Histogram Indicator is a powerful tool for traders seeking clear trend identification based on the widely-used Exponential Moving Averages (EMAs).This indicator provides an easy-to-interpret histogram and helps you simplify trend identification by using the 50 EMA and 200 EMA on two crucial timeframes: H1 and H4. By observing the relationship between short-term and long-term EMAs on multiple timeframes, this indicator provides a quick and clear view of mark
FREE

O indicador Martinware Manual Trading Helper (Auxiliar de Negociação Manual) tem por objetivo ajudar as pessoas a iniciar suas vidas na especulação manual. Ele pode ser usado para exibir tanto algumas imagens genéricas no lado direito do gráfico, onde observações operacionais personalizadas podem ser exibidas, quanto apenas um retângulo em branco que oculta o gráfico durante o backtest. Além disso, pode reproduzir periodicamente uma lista de sons. Para mostrar um retângulo em branco, deixe o pr
FREE

El indicador técnico propuesto es un sistema de medias móviles de múltiples marcos temporales diseñado para ayudar a los operadores del mercado financiero a seguir de cerca los movimientos tendenciales. Al combinar medias móviles de diferentes períodos, este indicador ofrece una visión más completa de la dirección de la tendencia, lo que permite a los traders identificar oportunidades de trading con mayor precisión. Al utilizar este indicador, los operadores pueden maximizar sus ganancias al tom
FREE

Este indicador serve como alerta para regiões de clímax.
Como funciona? Quando a média móvel aritmética de 20 períodos vai de encontro à média móvel aritmética de 200 períodos, forma-se uma região de conflito com duas grandes forças opostas brigando. Isso faz com que o preço apresente repiques aleatórios até que se defina um lado vencedor, o que pode ser perigoso. Portanto, o indicador pinta a região entre as médias móveis para alertá-lo.
Como usar? Pode ser usada para estratégias específica
FREE

O indicador que mostra o tempo atual nos principais mercados do mundo. Ele também exibe a sessão atual. Muito fácil de usar. Ele não ocupa muito espaço em um gráfico. Ele pode ser usado em conjunto com Expert Advisors e outros painéis, como o VirtualTradePad . A versão do estilo clássico. Outras características: Há uma opção nos parâmetros de entrada: exibir/esconder dicas quando o mouse está sobre um botão, você também pode selecionar o idioma das dicas Inglês/Russo; O botão Close pára a aplic
FREE
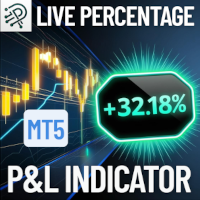
Quickly monitor your floating profit or loss as a percentage of your account balance live and always visible right on your chart! Key Features: Real-Time Calculation: Instantly calculates the combined floating profit or loss from all open trades as a percentage of your current account balance. Easy On-Chart Display: The result is conveniently shown as a label in the lower-right corner of your chart no distractions, always visible. Clear Color Coding: Green for profit, red for loss for immediate
FREE

For traders, monitoring price movements is a constant activity, because each price movement determines the action that must be taken next.
This simple indicator will helps traders to display prices more clearly in a larger size.
Users can set the font size and choose the color that will be displayed on the chart. There are three color options that can be selected to be displayed on the chart.
FREE
O Mercado MetaTrader é a única loja onde você pode baixar um robô demonstração de negociação gratuitamente para testes e otimização usando dados históricos.
Leia a visão geral e opiniões de outros clientes sobre os aplicativos, faça o download para o seu terminal e teste um robô de negociação antes de comprá-lo. Apenas no Mercado MetaTrader você pode testar um aplicativo de forma absolutamente gratuita.
Você está perdendo oportunidades de negociação:
- Aplicativos de negociação gratuitos
- 8 000+ sinais para cópia
- Notícias econômicas para análise dos mercados financeiros
Registro
Login
Se você não tem uma conta, por favor registre-se
Para login e uso do site MQL5.com, você deve ativar o uso de cookies.
Ative esta opção no seu navegador, caso contrário você não poderá fazer login.