Смотри обучающее видео по маркету на YouTube
Как купить торгового робота или индикатор
Запусти робота на
виртуальном хостинге
виртуальном хостинге
Протестируй индикатор/робота перед покупкой
Хочешь зарабатывать в Маркете?
Как подать продукт, чтобы его покупали
Технические индикаторы для MetaTrader 5 - 22

Super Zone Несколько лет наблюдений за принципами работы рынка Super Zone работал, как тогда так и сейчас, потому что индикатор позволяет увидеть торговый диапазон недели и даже месяца, который используют крупные участники рынка. Очень прост в использовании работаем на H4 в недельном диапазоне ( в тестере на демо режиме не работает ) - от верхних зон продаем, от нижних покупаем. Отмечает зоны от начала недели (месяца) которые не перерисовываются , работает почти на всех валютных парах, отра

Real Spread Monitor — это мощный индикатор, который предназначен для точного измерения и анализа реальных спредов, предоставляя трейдерам возможность сравнивать торговые условия различных брокеров. Данный продукт также доступен для терминала MetaTrader 4 => https://www.mql5.com/ru/market/product/125769 Основные особенности Real Spread Monitor:
1. Два режима работы: Режим записи: В этом режиме индикатор собирает данные о реальных спредах выбранного торгового инструмента и записывает их в файл.

PA Touching Alert избавит вас от необходимости днями напролет следить за ценой в ожидании ее касания важных ценовых уровней. Индикатор позволяет установить два ценовых уровня: верхний и нижний, которые должны быть выше/ниже текущей цены соответственно. Как только цена коснется одного из них, сработает алерт и/или уведомление. Уровни можно использовать в качестве сильной поддержки/сопротивления. Отзывы и пожелания приветствуются.
Входные параметры upper_pa: верхний ценовой уровень lower_pa: нижн
FREE

I am a trader specializing in the development of rare , exclusive , high-performance trading bots designed for serious traders who are committed to achieving consistent profitability and success. This free indicator is more than just a visual tool—it powers the Midnight Throttle EA , an automated trading system that executes trades based on the precise market conditions this indicator observes. Midnight Watch : A Pro-Level Tool for Precision Market Analysis. An advanced , multi-functional MetaTr
FREE

This MT5 chart trend checker cuts through the noise of market volatility to provide a clearer picture of trends and price movements. It includes the following features that can provide more clarity during market assessments: 1 customizable multi-period moving average Optional Heikin-Ashi candles 3 switchable focus modes Distinct colors for easy analysis
Link to MT4 version: https://www.mql5.com/en/market/product/106708/
This indicator shows your preferred moving average from multiple time fram
FREE

Smart Fibo Zones are powerful, auto-generated Fibonacci Retracements that are anchored to key market structure shifts . These zones serve as critical Supply and Demand levels, guiding you to identify potential price reactions and confirm market direction. Fibonacci calculations, widely used by professional traders, can be complex when it comes to identifying highs and lows. However, Smart Fibo Zones simplify this process by automatically highlighting order blocks and key zones, compl

The HighsAndLowsPro indicator for MetaTrader 5 marks local highs and lows in the chart. It distinguishes between weak and strong highs and lows. The line thicknesses and colours can be individually adjusted. In the default setting, the weak highs and lows are displayed thinner, the strong ones thicker. Weak highs and lows have 3 candles in front of and behind them whose highs are lower and lows are higher. The strong highs and lows have 5 candles each.
FREE
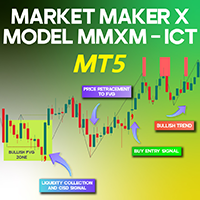
Market Maker X Model Indicator MMXM MT5 The Market Maker X Model Indicator (MMXM) is a strategic trading tool designed to detect price movement patterns and trend reversals. This indicator analyzes market flow, tracking the interaction between buyers and sellers to help traders understand liquidity shifts and key price zones more effectively. «Indicator Installation & User Guide» MT5 Indicator Installation | Market Maker X Model mmxm ICT MT4 | ALL Products By TradingFinderLab | Best MT5 In
FREE

ATR MTF indicator means ATR in ALL TIME FRAMES
By running this indicator, you can see the current ATR number of all time frames on your chart, and you do not need to change the time frame .
The main ATR indicator of MetaTrader is not required anymore because by ATR MTF all your requirements to the average of the true range are solved and all ATR numbers will be shown in the optional position of the screen .
This indicator is published for free and it is forbidden to sell it to others.
If it
FREE

Indicator developed in order to notify the user when the RSI enters and leaves the overbought and oversold regions, the information is shown in the form of audible and text alerts. Notifications can be disabled at any time. The indicator period can be changed by the user, and it is possible to insert the RSI indicator in the graph through the alerts. Aurélio Machado
FREE

Хотели бы вы знать какое влияние окажет экономическое событие на цену ? Что произойдет с рынком после наступления новостей? Как экономическое событие влияло на тики в прошлом? Этот индикатор поможет вам в этом. Вы любите технический анализ? Вам нравится изучать прошлое, чтобы предсказать будущее? Но, как думаете, что может быть важнее технического анализа, что могло бы улучшить технический анализ? Ну конечно же, это фундаментальный анализ! Ведь новости непосредственно влияют на рынок, а значит
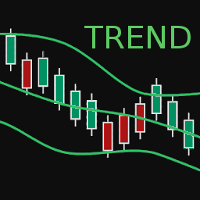
BBTrend – относительно новый индикатор, разработанный Джоном Боллинджером для работы с полосами Боллинджера (Bollinger Bands). Это один из немногих индикаторов, которые могут сигнализировать о силе и направлении, что делает его очень ценным инструментом для трейдеров.
Расчет Расчеты довольно просты. Отображаются периоды по умолчанию 20 и 50. Значения настраиваются. Нижнее = MathAbs(lowerBB(20) - lowerBB(50)) Верхнее = MathAbs(upperBB(20) - upperBB(50)) BBTrend = (нижнее - верхнее) / middleBB(2
FREE

The DailyWeeklyMarkers indicator helps traders visualize trading weeks by clearly marking the start of each day and week on the chart. It draws vertical separator lines for each day (including weekends if enabled) and highlights the beginning of new trading weeks with double lines for better clarity. This makes it easier to analyze price action within daily and weekly contexts. Who Is This Indicator For? Swing Traders – Helps identify weekly opening gaps and key levels. Day Traders – Vis
FREE

A Simple Visual Indication of the Trading Sessions Times. This Indicator will help you Visualize the Trading sessions and take advantage of the session precise timing to trade at the open of each session where there might be more liquidity. This Indicator is FREE, So pls Dont forget to leave a 5 * stars Review, This Will help me create new Ideas and Indicators and Upload them to the Market. More Professional and useful Indicators and tools here: https://www.mql5.com/en/users/dubaiforexgroup/sel
FREE

EMA Scalper Indicator is an indicator of EMA lines and reversal EMA lines. Each pair of EMA channels area that can be used to make reversal entry. After the EMA lines are widening because of major trend, the area can be used to find profitable entry and exit, especially after EMA reversal. Do the cut loss whenever candle closed outside the area.
The A, B, C, D, and E area are colored differently. Solid lines: Normal EMA lines. Dashed lines: Reversal EMA lines.

Direct Scalping shows the most SUPER SUPER SUPER EARLY opportunity to scalp the market. Do entry as early as possible, as soon as the first sign appears.
It plays sound alert so that you can wait the moment while doing something else.
Remember to cut loss below the '' area. Yes, it is not stop loss but cut loss (exit on candle close). Made for M1 timeframe, but higher is good too.
My new favorite setup: M3 using 8 indicators with different parameters: 11, 18, 25, 32, 39, 46, 53, and 60.
Combin
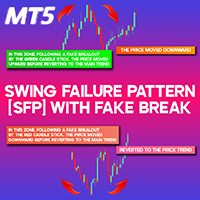
Swing Failure Pattern (SFP) with Fake Break Indicator for MT5
The Swing Failure Pattern (SFP) Indicator in MetaTrader 5 is designed to identify deceptive breakouts in financial markets. This pattern appears when the price momentarily surpasses key levels, such as previous highs or lows, triggering stop-loss orders and liquidity traps. However, instead of continuing in that direction, the price swiftly reverses, signaling a false breakout . The main function of the SFP pattern is to exploit liqu
FREE
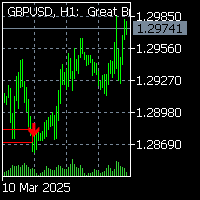
To get access to MT4 version please click here . This is the exact conversion from TradingView: "Breakout Finder" by "LonesomeTheBlue". The screenshot shows similar results from tradingview and Metatrader. This is a medium-load processing indicator. Updates are calculated per candle. This is a non-repaint indicator. The major input options are available. Buffers are available for processing in EAs. You can message in private chat for further changes you need. Thanks for downloading
FREE

The Monthly Weekly Open Line is an indicator that plots: The current month open line that will extend till the last week on the month. Weekly lines that span the look back days period that you have set . Each line will extend from the respective weekly Monday zero GMT till friday of the respective week. Monthly and Weekly open lines can be used to build very powerfull anc consistent trading strategies. They act as natural S/R price barriers.
FREE

The Keltner Channel is a volatility-based technical indicator composed of three separate lines. The middle line is an exponential moving average (EMA) of the price. Additional lines are placed above and below the EMA. The upper band is typically set two times the Average True Range (ATR) above the EMA, and the lower band is typically set two times the ATR below the EMA. The bands expand and contract as volatility (measured by ATR) expands and contracts. Since most price action will be encompasse
FREE

Swiss CandleTime What ist CandleTime for This indicaor just displays the remaining time for a candle to build. It is best used if you trade with timframes from 3 minutes. I use it in M3 to keep postions. If I have two following red candles i usually liquidate the position. Timeframes M1 to H1 Inputs Arrow displayed => Edit your arrow string Arrow for waiting conditions => Arrow if chart is offline Text Color => color of the text Tell if there is a trend change => tells you, if the two preciding
FREE

This indicator draws regular bullish and bearish divergences in real-time onto the charts. The algorithm to detect those divergences is based on my 10+ years experience of detecting divergences visually. The divergences are drawn as green and red rectangles on the charts. You can even do forward testing in the visual mode of the strategy tester.
Parameters Fast EMA Period: The period of the fast EMA of the MACD. Default value is 12.
Slow EMA Period: The period of the slow EMA of the MACD. Defau
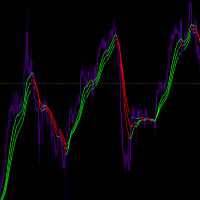
Input Parameters JawPeriod (default=9): Period for the blue line JawShift (default=0): Shift for the blue line TeethPeriod (default=7): Period for the red line TeethShift (default=0): Shift for the red line LipsPeriod (default=5): Period for the green line LipsShift (default=0): Shift for the green line Signals Bullish Conditions When price moves above all lines (all lines turn Lime) Potential buying opportunity Confirms upward momentum Bearish Conditions When price moves below all
FREE

If there is only one MT5 indicator you ever buy for trading forex – this has to be it.
Your success as a forex trader depends on being able to identify when a currency or currency pair is oversold or overbought. If it is strong or weak. It is this concept which lies at the heart of forex trading. Without the Quantum Currency Strength indicator, it is almost impossible. There are simply too many currencies and too many pairs to do this quickly and easily yourself. You need help!
The Quantum Cur

Of all the four principle capital markets, the world of foreign exchange trading is the most complex and most difficult to master, unless of course you have the right tools! The reason for this complexity is not hard to understand. First currencies are traded in pairs. Each position is a judgment of the forces driving two independent markets. If the GBP/USD for example is bullish, is this being driven by strength in the pound, or weakness in the US dollar. Imagine if we had to do the same thing

(перевод Google) Этот индикатор основан на оригинальном " Time Segmented Volume (TSV) ", разработанном Worden Brothers, Inc . Однако я добавил к этому несколько дополнительных функций. Можно выбрать цену, которая будет применяться, вместо того, чтобы использовать только цену закрытия по умолчанию, используемую оригиналом. Также можно выбрать, какое взвешивание по объему использовать, включая псевдообъемное взвешивание на основе истинного диапазона или вообще без взвешивания по объему. (Original
FREE

Откройте для себя индикатор ATR Bands: ваш союзник в освоении волатильности и оптимизации сделок! ATR Bands используют ведущий индикатор Average True Range (ATR) для измерения волатильности и построения динамических полос вокруг цены. Эти полосы адаптируются в реальном времени к рыночным колебаниям, предоставляя вам четкое представление о критических ценовых зонах. Почему стоит выбрать ATR Bands? Определение сильных трендов: Пробитие полос сигнализирует о значительных движениях цен, что идеально
FREE

A price increase indicator calculates range and price changes in percent. It is very useful when you look at the chart. It helps you make decisions to open deals when the price is at the lowest level do not open sell deals and open buy deals and when it is at the highest level do not open buy deals open sell deals, it is not an entry signal for deals but to know the lowest and highest price that will reach in an hour or four hours a day or a week or a month as a whole for the period
FREE

Стандартный Индикатор Fractals Bill Williams с возможностью указания количества свечей для формирования. Индикатор работает на любых графиках и таймфреймах.
Настройки: candles -количество свечей слева и справа на основе которых строиться фрактал (в классическом индикаторе это значение всегда 2 )
Контакт: Если у вас возникли какие-либо вопросы или требуется помощь, пожалуйста, свяжитесь со мной через личное сообщение. Автор: Fertikov Serhii, Больше моих индикаторов, советников, скриптов дост
FREE

Certainly! Let me introduce you to a powerful tool for MetaTrader 5 (MT5) that can automatically identify and draw support and resistance (S&R) levels on your trading charts. This tool is called the “Support and Resistance Levels Guru” . Support Resistance Levels Guru The Support & Resistance Indicator automatically displays essential S&R levels on your chart. These levels are crucial for technical analysis and are used by many traders. Resistance levels (zones) are shown in R ed , while suppo
FREE

Previous Candle Levels MT5 shows the previous candle levels, it shows the previous candle Open High Low Close levels (OHLC Levels) in different time frame. It's designed to help the trader to analyse the market and pay attention to the previous candle levels in different time frame. We all know that the OHLC Levels in Monthly, Weekly and Daily are really strong and must of the time, the price strongly reacts at those levels. In the technical analysis, the user can use them as a support and res
FREE

VWAP FanMaster: Освойте стратегию откатов с точностью!
VWAP FanMaster — это идеальный индикатор для трейдеров, которые ищут точные точки входа и эффективные откаты . Он объединяет мощь VWAP (средневзвешенной цены по объему) и линий Фибоначчи Фан , предоставляя четкую карту зон интереса на рынке. Основные особенности Просто и мощно : Просто перемещайте вертикальные линии, и индикатор автоматически строит как VWAP , так и линии Фибоначчи Фан .
Эффективная стратегия : Ждите, пока цена
FREE

In this indicator you choice a data to be used from yesterday (high, low, open, close, etc) to automatically draw an line to be the zero. And, from that a percentage deviation ("Percentage to be used") is calculated and used to draw others line to both side until a limit be reached.
Both sides can have diferrent colours as show in screenshots. Also, more than one indicator can be used at same time.
FREE

Identification of support and resistance areas
A useful indicator for traders
completely free
Can be used in all symbols
Can be used in all time frames
It has three different trends: short term, medium term, long term
Settings:
Clr1,2: You can change the color of the lines
Type Trend: You can determine the trend
Message me for questions, criticism and suggestions
FREE
Лучший инструмент для ловли стрелы и ударов шипов, как профессионал !!!
Вы хотите стать трейдером с постоянным бумом и крахом Это расширенный индикатор, используемый для предварительного обнаружения всплесков индексов бума и падения. Он предупреждает о входах с высокой вероятностью с удивительной вероятностью успеха. Мы рекомендуем использовать виртуальный частный сервер для круглосуточного получения уведомлений по электронной почте или телефону.
Как торговать с Mega Spikes Max 1.4? Когда н

Verve AI Reversal Pro Indicator Pro — это идеальный помощник трейдера, требующего высочайшей точности и беспрецедентного понимания рыночной динамики. Используя передовые технологии искусственного интеллекта, этот инструмент непрерывно анализирует движение цены, объём и волатильность, чтобы выявлять зоны с высокой вероятностью разворота ещё до их полного формирования. Объединив алгоритмы машинного обучения с проверенными принципами технического анализа, Verve AI формирует чёткие и уверенные сигн
Этот новостной помощник предназначен для получения необходимых трейдерам экономических событий из основных издательских источников, которые публикуют новости в режиме реального времени на основе «Обзора рынка» терминала с различными и простыми фильтрами.
Трейдеры Форекс используют макроэкономические индикаторы для принятия обоснованных решений о покупке и продаже валют. Например, если трейдер считает, что экономика США будет расти быстрее, чем экономика Японии, он может купить доллар США и про
FREE

Indicador Multiple Regression Indicador faz o plot da Curva de Retorno e dos canais superior e inferior de uma regressão para os preços de fechamento do ativo do gráfico. A Curva de Retorno é a linha central do indicador e representa a região de equilíbrio do preço entre vendedores e compradores. Nesse indicador o usuário escolhe o tipo da regressão podendo ser de 3 tipos: primeiro grau, segundo grau ou terceiro grau. Os plots do indicador são: Linha central – cor padrão preta; Linha superi
FREE

Get ALERTS for break of your TRENDLINES, SUPPORT LINES, RESISTANCE LINE, ANY LINE!!
1. Draw a line on the chart (Trend, support, resistance, whatever you like) and give it a name (e.g. MY EURUSD line) 2. Load the Indicator and input the Line Name the same name in Indicator INPUT so system knows the name of your line (= MY EURUSD line) 3. Get Alerts when Price breaks the line and closes Works on All Time frames and charts LEAVE A COMMENT AND IF THERE IS ENOUGH INTEREST I WILL WRITE AN EA WHICH W
FREE

Dark Breakout is an Indicator for intraday trading. This Indicator is based on Trend Following strategy, providing an entry signal on the breakout. The signal is provided by the arrow, which confirms the breaking of the level. We can enter in good price with this Indicator, in order to follow the main trend on the current instrument. It is advised to use low spread ECN brokers. This Indicator does Not repaint and N ot lag . Recommended timeframes are M5, M15 and H1. Recommended working pairs

This indicator shows current major support and resistance, if one exists. And as a support or resistance is broken it shows the new current, if any. To identify support and resistance points it uses the high and low points identified on the current chart. Allows too you to inform the maximum number of bars used to consider a support or resistance point still valid.
FREE
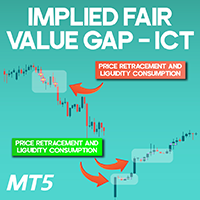
Implied Fair Value Gap ICT Indicator MT5 The Implied Fair Value Gap ICT Indicator MT5 is a powerful tool designed to uncover hidden price inefficiencies within the MetaTrader 5 platform. This indicator employs a specialized method by plotting two theoretical lines at the midpoint of the shadows of consecutive candles, marking the space between them as an implied fair value gap. It's important to note that if the shadows of the neighboring candles fully overlap, no hidden fair value gap is formed
FREE

Что показывает на графике индикатор TrendBreak? 1 — рисует линию тренда до максимальных максимумов в 100 баров. 2 — рисует линию тренда до максимальных максимумов в 30 баров. 3 — рисует линию тренда до максимальных минимумов в 100 баров. 4 — рисует линию тренда до максимальных минимумов в 30 баров. И эти линии указывают на сжатие тренда. Также индикатор выбирает 100-й бар и рисует ровную линию к максимуму и минимуму.
FREE

"Five Minute Drive" indicator that is designed to be used in the 5 minute timeframe only. One of its most important advantages is that it shows the general trend in the upper time frames when looking at the 5-minute timeframe. Therefore, when opening positions in the 5 minute timeframe, when it is in line with the trends in the upper timeframes, you are less likely to be upside down. If you can interpret the curvilinear and linear lines drawn by this indicator on the graphic screen with your geo
FREE

Push Notif for Mobile Trading: Detect Trend and Consolidation Overview Push Notif for Mobile Trading: Detect Trend and Consolidation is a custom MetaTrader 5 (MT5) indicator developed by Ritz_EANEHA that intelligently detects whether the market is in a trend (bullish/bearish) or in consolidation (sideways) . It uses a proprietary comparison of Standard Deviation (StdDev) and Average True Range (ATR) to assess volatility and market structure, and sends mobile push notifications to alert t
FREE

Initiated in 1995 by the physicist and technical analyst Paul Levine, PhD, and subsequently developed by Andrew Coles, PhD, and David Hawkins in a series of articles and the book MIDAS Technical Analysis: A VWAP Approach to Trading and Investing in Today's Markets.Latterly, several important contributions to the project, including new MIDAS curves and indicators, have been made by Bob English, many of them published in the book.
FREE

Highly configurable RSI indicator. Features: Highly customizable alert functions (at levels, crosses, direction changes via email, push, sound, popup) Multi timeframe ability Color customization (at levels, crosses, direction changes) Linear interpolation and histogram mode options Works on strategy tester in multi timeframe mode (at weekend without ticks also) Adjustable Levels Parameters:
RSI Timeframe: You can set the current or a higher timeframes for RSI. RSI Bar Shift: you can set the
FREE

Coral trend is a trend-following indicator that is widely popular among FOREX traders . It is usually used as a confluence with other indicators. It uses combinations of moving averages with complex smoothing formulas! It has two configurable parameters: Coefficient - smoothing ratio (*)
Applied price Calculation: Coral = (-0.064) * B6 + 0.672 * B5 - 2.352 * B4 + 2.744 * B3
FREE

This indicator displays MTF (Multi-Time Frame) Candles on your Chart. It helps to see the overall Trend of Market. You can specify 2ndLast, Last or Current Candle of any timeframe to show to get a better picture of Trend.. You get 4TF Bars/Candles on your current chart ..
Customizable Settings are : 1. Where to place MTF Candles.. 2. Show or Hide for each Candle 2. Time-Frame for each Candle 3. Current/ Last / 2nd Last of Each Candle
FREE

This is a usefull utility for monitoring spread and also for recording informations to a file. (Files will be placed into "Common\Files\Spread Monitor"). There is the possibility to let the indicator calculate high/low into the past thanks to downloading ticks. (It's a slow and approsimate thing! The best way to use it is to attach to a chart and let it recording spread in real time). There is also a buffer with the average of spread in latest X periods.
Easy and effective.
FREE

Excellent tracking performance and minimal noise! This trend detection indicator that avoids whipsaws and uncertain market noise and is also agile enough to react to changes in trend.
It is also designed to adapt to dynamic markets.
Functions mainly as a filter to help you trade in the direction of the trend.
Features.
Simple and easy to use. Low load and easy to try out The excellent tracking performance and smooth lines that make it ideal for market analysis Can be used as a trend filter for
FREE

This panel displays the price percentage change
Shows the percentage change in price from the last open: Daily, Weekly and Monthly timeframes. Numbers are easier to use than histogram currency meters. Line up the three timeframes strengths/weaknesses for strong trends. Compare currencies strongest against weakest. USD is the world's reserve currency to compare against.
How to use 1. Match the strongest currency with weakest currency; or 2. Match the strongest or weakest currency against USD;
FREE

。。。。。。。。。。。。。。。。。。。。。。。。。。。。。。。。。。。。。。。。。。。 This indicator is based on Bollinger Bands indicator. It helps user clearly know the Band is expand or contract.
The method of use is the same as the traditional Brin channel index. Users can use different color areas to distribute forest channel indicators in expansion or contraction stage. -------------------------------------------------------------------------------------------
FREE
Внимание - изначально индикатор разрабатывался для торговли фьючерсами и нюансами воскресной сессии. В данной модификации нет учёта воскресного премаркета, а идёт жесткая привязка ко времени на графике для корректной работы на споте. Стандартный индикатор АТР, можно включить игнорирование аномально больших свечей. Есть возможность менять расположение выводимого текста по 4 углам графика. Можно менять период расчёта (дней назад). Бонус - в индикатор добавлена корреляция с объёмами. Можно включит
FREE
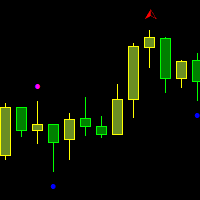
Индикатор рисует фракталы Б.Вильямса двух типов: Пробитые - цена была как минимум 1 раз выше или ниже этих фракталов. Не пробитые - новые фракталы, цена не была выше или ниже этих фракталов. Настроить можно цвет самих фракталов, а так же количество баров, для отрисовки индикатора.
фрактал Вильямса фрактал БВ фракталы Вильямса пробой фрактала пробитый фрактал Торговый хаос broken fractal unbroken fractal Williams fractal Trading Haos Bill Williams
FREE
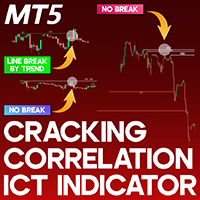
Cracking Correlation ICT Indicator for MetaTrader 5 The Cracking Correlation Indicator is a specialized ICT-style tool designed to track shifts in correlation among three financial assets. Typically, indices such as DJI, ND100, and SP500 move in tandem due to strong market correlation. However, there are instances when this synchronization breaks. The indicator identifies these moments, visually representing them through color-coded lines that change based on correlation shifts. «Indicator Insta
FREE

Индикатор Magic SMA очень помогает в определении направления тренда. Он может стать отличным дополнением к вашей существующей стратегии или основой для новой. Мы, люди, можем принимать лучшие решения, когда лучше видим визуально. Поэтому мы разработали его, чтобы отображать разные цвета для восходящих и нисходящих трендов. Каждый может настроить это так, как ему больше всего подходит. Установив период тренда, мы можем оптимизировать его для более длинных или коротких трендов для нашей стратегии
FREE

A very useful Price Action point is the previous day Closing VWAP. We call it Big Players Last Fight . This indicator will draw a line showing on your chart what was the last VWAP price of the previous trading session. Simple and effective. As an additional bonus, this indicator saves the VWAP value on the Public Terminal Variables, so you EA could read easily its value! Just for the "Prefix + Symbol name" on the variables list and you will see!
SETTINGS How many past days back do you want to s
FREE
A Renko Tick chart based on continuously adjusting percentage.
Live Renko bricks formed by tick data
Adjustable brick width expert for indicator attached Scalp with a Renko, get weird.
The settings can and will break the script if you turn them up too high. Turning off outline mode will not look as nice, but can potentially allow for a larger number of bricks.
FREE

This indicator serves as an alert for climax regions.
How does it work? When the 20-period arithmetic moving average meets the 200-period arithmetic moving average, a conflict region forms with two major opposing forces fighting. This causes the price to show random peaks until a winner side is defined, which can be dangerous. Therefore, the indicator paints the region between the moving averages to alert you.
How to use it? It can be used for specific volatility or support and resistance str
FREE
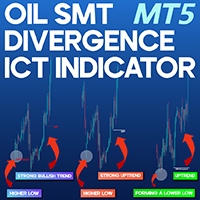
SMT Divergence Oil Indicator ICT MT5 The SMT Divergence Oil Indicator for MetaTrader 5 is designed to analyze price divergences between energy-related assets, helping traders identify potential trend reversals or continuations. By tracking deviations between correlated markets, this indicator offers valuable insights into price movements. When a divergence is detected in the primary (mother) asset chart, the indicator automatically highlights corresponding divergences in related markets: Bullish
FREE

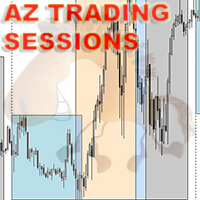
Это индикатор торговых сессий который может отображать все уровни ( Open-High-Low-Close ) для четырех сессий. Сессии могут быть нарисованы линиями или с заливкой как свечи, линии могут быть продлены до следующей сессии. Вы можете легко скрывать/показывать каждую сессию нажатием на горячие клавиши. Также вы можете видеть ASR (средний диапазон сессий) (горячая клавиша по умолчанию «A»). Это похоже на расчет ADR, только он рассчитывается на основе последних X-сессий, что позволяет увидеть пот
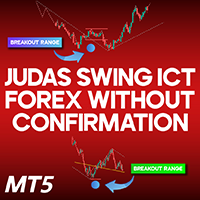
Judas Swing ICT Forex without confirmation MT5
The Judas Swing ICT Forex without confirmation Indicator is designed to recognize and interpret deceptive market movements within forex and stock trading. It pinpoints situations where the market executes a misleading move to entice traders before swiftly reversing direction. This tool is widely used in ICT trading methodologies and technical market analysis. «Indicator Installation & User Guide» MT5 Indicator Installation | Judas Swing ICT Forex
FREE

Indicator Name: DualClockWithSignalTime.mq5 Description: The DualClockWithSignalTime is a custom MetaTrader 5 (MT5) indicator designed to display three pieces of real-time information directly on the chart: Broker Server Time Local Computer Time Last Signal Time (BUY/SELL) This indicator is helpful for traders who need to monitor both the broker's time and their own local time, ensuring better synchronization of trading actions. Additionally, it automatically detects and displays the latest BUY
FREE

Условный диапазон Вильямса (WCR) - это индикатор технического анализа, применяемый для определения состояния перепроданности / перекупленности рынка на основе изучения позиции цены закрытия в заданном диапазоне, образованном экстремумами за прошлые периоды, и для поиска расхождений, указывающих на вероятность разворота. Он позволяет оценить, оказали ли покупатели или продавцы более сильное влияние на цену в течение определенного периода времени, и предположить дальнейшее развитие событий. Инди
FREE

The indicator shows your profit and loss (PnL) for the current day right on your trading chart. Anchored at the top-right corner, it displays "PnL: [amount]"—green if you’re up, red if you’re down, white if it’s zero. Every time you close a trade, it updates instantly, adding up your profits, commissions, and swaps from all buys and sells trades since midnight. No fuss, no extra charts—just real-time feedback on how your day’s going.
FREE
!!! DISCLAIMER THIS INDICATOR SHOULD ACT AS A CONFIRMATION TO UR ANALYSIS DONT USE THIS INDICATOR ALONE !!!! Elevate your trading experience , a custom indicator designed for MetaTrader 5. This powerful tool employs advanced technical analysis to provide clear, visual signals directly on your chart. i use it to scalp the xauusd market on the 1min timeFrame in newyork session stoploss below the candle and take profit you can either target a key area or trail and take partials Key Features: Colo
FREE

Об индикаторе: DALA Forecast - универсальный инструмент предсказания динамики временных рядов любой природы. Для предсказания используется модифицированные методы анализа нелинейной динамики, на основе которых строится предсказательная модель с применением методов машинного обучения. Для получения ознакомительной версии индикатора вы можете связаться со мной в личных сообщениях.
Как пользоваться индикатором: Примените индикатор к выбранному вами финансовому интрументу или индикатору с нужными
FREE

O Indicador valida a força da tendência utilizando o volume negociado. Os candles são mostrados na cor verde indicando força compradora e cor vermelha na força vendedora. O movimento é encerrado pelo SAR parabólico. Vantagens: Filtra distorções de preço sem volume financeiro; Filtra consolidações e movimentos laterais; Filtra divergências de volume pelo indicador Money Flow. Desvantagens: Não filtra todos os falsos rompimentos, visto que rompimentos importantes geram altos volumes financeiros; N
FREE

This indicator is based on Mr. Mark Fisher's ACD strategy, based on the book "The Logical Trader."
- OR lines - A lines - C lines - Daily pivot range - N days pivot range - Customizable trading session - Drawing OR with the desired time Drawing levels A and C based on daily ATR or constant number - Possibility to display daily and last day pivots in color zone - Displaying the status of daily PMAs (layer 4) in the corner of the chart - Show the order of daily pivot placement with multi-day piv
FREE
А знаете ли вы, почему MetaTrader Market - лучшее место для продажи торговых стратегий и технических индикаторов? Разработчику у нас не нужно тратить время и силы на рекламу, защиту программ и расчеты с покупателями. Всё это уже сделано.
Вы упускаете торговые возможности:
- Бесплатные приложения для трейдинга
- 8 000+ сигналов для копирования
- Экономические новости для анализа финансовых рынков
Регистрация
Вход
Если у вас нет учетной записи, зарегистрируйтесь
Для авторизации и пользования сайтом MQL5.com необходимо разрешить использование файлов Сookie.
Пожалуйста, включите в вашем браузере данную настройку, иначе вы не сможете авторизоваться.