Смотри обучающее видео по маркету на YouTube
Как купить торгового робота или индикатор
Запусти робота на
виртуальном хостинге
виртуальном хостинге
Протестируй индикатор/робота перед покупкой
Хочешь зарабатывать в Маркете?
Как подать продукт, чтобы его покупали
Технические индикаторы для MetaTrader 5 - 27

Free forever simple pip meter for MT5 with customizable font color. Display profit or loss in both points count and currency value. Supports 4 currency symbols ($,€,£ ,¥). For unsupported currencies, it shows a 3-character currency short form. Enhance your trading interface with clarity and precision. Easy to use and tailored for diverse Forex traders. Perfect for MT5!
FREE
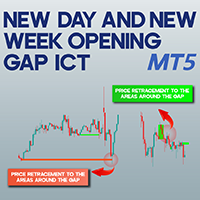
New Day and New Week Opening Gap ICT NWOG NDOG MT5 The New Day and New Week Opening Gap ICT NWOG NDOG MT5 indicator is a powerful and practical tool designed for traders using MetaTrader 5. It helps detect price gaps that emerge at the start of a new trading day or week, making them visible on the chart. When the market closes at the end of a session, the reopening price may differ from the previous close, leading to a price gap. This indicator marks weekly price gaps ( NWOG ) in red and daily
FREE

Введение в алгоритм GARCH Improved Nelder Mead GARCH - это сокращение от Generalized Autoregressive Conditional Heteroskedasticity (Обобщенная авторегрессионная условная гетероскедастичность). Представляет собой модель прогнозирования волатильности, обычно применяемую в финансовой сфере. Модель GARCH впервые появилась в работе датского экономиста Тима Петера Боллерслева (Tim Peter Bollerslev) в 1986 году. Лауреат Нобелевской премии 2003 года Роберт Ф. Энгл внес огромный вклад в усовершенствовани
FREE

Индикатор для визуализации временных диапазонов ключевых торговых сессий: Азиатской, Европейской и Американской. Индикатор обладает функционалом настройки времени начала и окончания каждой торговой сессии, а также устанавливаемой временной зоны торгового сервера. Основные преимущества индикатора включают возможность работы с минимальной загрузкой процессора и экономии оперативной памяти. Кроме того, предоставляется опция указания количества отображаемых исторических дней, обеспечивая пользовател
FREE

Inicialmente este indicador foi elaborado e pensado para rastrear pontos ou velas onde há força de tendência. Como nas grandes descobertas, cheguei ao indicador que mostra principalmente velas de reversão, pontos de tensão, alta liquidez, resistência. O indicador traz simplificação ao gráfico, indicando todos os pontos onde possivelmente teríamos lta´s, ltb´s, médias móveis, bandas, ifr alto. O indicador não faz o gerenciamento de risco, apenas mostra as velas onde podem ocorrer reversão. Lembre
FREE

Индикатор создан чтобы отобразить на графике данные ценовые уровни: Максимум и минимум прошлого дня. Максимум и минимум прошлой недели. Максимум и минимум прошлого месяца. В настройках индикатора, для каждого типа уровней, можно менять стиль линий, цвет линий, включить и отключить нужные уровни.
Настройки ----Day------------------------------------------------- DayLevels - включение / отключение уровней прошлого дня. WidthDayLines - толщина линий дневных уровней. ColorDayLines - цвет лин
FREE
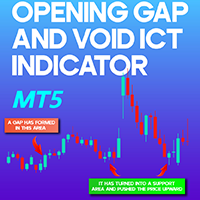
Opening Gap and Void ICT Indicator MT5 The Opening Gap and Void ICT Indicator MT5 is a highly effective tool for MetaTrader 5, designed to assist traders in spotting price gaps that occur when a new candlestick forms. This indicator automatically detects and marks these gaps on the chart, making market analysis more streamlined. When the price retraces and fills a gap, the indicator removes that level from the chart, ensuring only active gaps remain visible. These gaps often serve as crucial sup
FREE

Indicador Multiple Regression Indicador faz o plot da Curva de Retorno e dos canais superior e inferior de uma regressão para os preços de fechamento do ativo do gráfico. A Curva de Retorno é a linha central do indicador e representa a região de equilíbrio do preço entre vendedores e compradores. Nesse indicador o usuário escolhe o tipo da regressão podendo ser de 3 tipos: primeiro grau, segundo grau ou terceiro grau. Os plots do indicador são: Linha central – cor padrão preta; Linha superi
FREE
!!! DISCLAIMER THIS INDICATOR SHOULD ACT AS A CONFIRMATION TO UR ANALYSIS DONT USE THIS INDICATOR ALONE !!!! Elevate your trading experience , a custom indicator designed for MetaTrader 5. This powerful tool employs advanced technical analysis to provide clear, visual signals directly on your chart. i use it to scalp the xauusd market on the 1min timeFrame in newyork session stoploss below the candle and take profit you can either target a key area or trail and take partials Key Features: Colo
FREE

Стандартный Индикатор Fractals Bill Williams с возможностью указания количества свечей для формирования. Индикатор работает на любых графиках и таймфреймах.
Настройки: candles -количество свечей слева и справа на основе которых строиться фрактал (в классическом индикаторе это значение всегда 2 )
Контакт: Если у вас возникли какие-либо вопросы или требуется помощь, пожалуйста, свяжитесь со мной через личное сообщение. Автор: Fertikov Serhii, Больше моих индикаторов, советников, скриптов дост
FREE

Seeing and interpreting a sequence of Candlesticks is easy to spot when you are a human... Higher Highs, Higher Lows, are the panorama of a Buying trend, at least in a short period of time... Seeing a current candlestick higher high and a lower candlestick low, as a human, you can immediately spot a "divergence", an "alert", a "starting range", but in the end and based on other analysis a human trader can understand and behave accordingly to this kind of candlestick data... But what about EAs (r
FREE
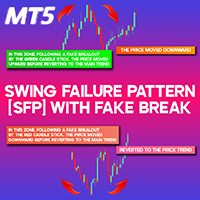
Swing Failure Pattern (SFP) with Fake Break Indicator for MT5
The Swing Failure Pattern (SFP) Indicator in MetaTrader 5 is designed to identify deceptive breakouts in financial markets. This pattern appears when the price momentarily surpasses key levels, such as previous highs or lows, triggering stop-loss orders and liquidity traps. However, instead of continuing in that direction, the price swiftly reverses, signaling a false breakout . The main function of the SFP pattern is to exploit liqu
FREE

El indicador técnico conocido como Líneas de Tendencia Perfecta . Este indicador es una herramienta valiosa en el análisis técnico y se utiliza para mejorar la toma de decisiones en el trading. Aquí tienes una descripción paso a paso de cómo funciona y cómo puede ser utilizado por los traders: Identificación de Tendencias : Las líneas de tendencia perfecta se dibujan conectando dos o más puntos de precio en un gráfico, revelando así la dirección general del mercado. Una línea ascendente indica
FREE

On-Balance Volume (OBV) – индикатор импульса, разработанный в 1963 году Джозефом Грэнвиллом. OBV показывает важность объема и его взаимосвязь с ценой. Он сравнивает положительные потоки объемов с ценой за определенный период времени. Чтобы подтвердить, что тренд может ослабевать, Грэнвилл рекомендует использовать 20-периодную скользящую среднюю в сочетании с OBV. В результате пользователям проще отслеживать такие события по пересечению линии OBV со своей скользящей средней. На Форексе у трейдера

# Wave Trend Oscillator (WTO) User Guide
## Overview Wave Trend Oscillator is a powerful technical analysis tool used to analyze price momentum and trend direction. It visualizes market conditions using two main lines (WT1 and WT2) and a histogram.
## Components 1. **WT1 (Green Line)**: Main trend indicator 2. **WT2 (Red Line)**: Signal line 3. **Histogram (Blue)**: Shows the difference between WT1 and WT2 4. **Arrows**: Mark crossover points - Green Arrow: WT1 crosses above WT2 (Buy signa

O Indicador CoioteChart foi construído pra facilitar desde a leitura de contexto de mercado até a micro estrutura do candle, facilitando ajustes operacionais e tomadas e decisão com alta eficácia.
Possui um controle para habilitar e desabilitar a visualização das pocs, vwap, zonas de máxima e mínima negociação, pode ser utilizado data sources de tempos gráficos para cálculos ou utilizado os ticks de agressão do time and trades, funciona com volume real e volume de ticks.
As colorações são atrib

O indicador precisa do times and trades (time and salles) para seu correto funcionamento.
O Volume é composto por ordens à mercado compradoras e vendedoras que agrediram o book de ofertas, o Delta é a diferença das ordens a mercado compradoras e vendedoras.
O CoioteDeltaCandle monitora o time and trades e à partir dos dados de agressão forma candles temporais em 4 formatos diferentes, possível selecionar à partir de configurações.
São elas:
Modo com acumulação.
Modo com pavio.
Modo inverter.

This indicator paints any Inside Bar found on the attached chart in a Dark Gray Colour with Black Borders and Wicks. If there are multiple consecutive Inside Bars, then they would also be successively painted Dark Grey with Black Borders and Wicks as well. You may opt to change the colours set by default in order to better contrast with your chosen background and chart colours. I made this Indicator out of necessity as my trading required it. But I know there may be others out there who may need

Identify Engulfing candle pattern with Arrows & Alert ( built-in RSI filter). This indicator helps you to identify Engulfing candle pattern or Outside bar (OB) on the chart with arrows, along with an alert when a new Engulfing candle appears. Engulfing candle pattern is one of the most important reversal Price Action signals. You can choose between standard Engulfing (Engulfing based on candle body) or non standard Engulfing (Engulfing based on candle high - low )
Alerts can be turned on

Identify Pinbar Candle Pattern with Arrows & Alert (built-in RSI filter).
This indicator helps you to identify Pin bar Candlestick Pattern (or shooting star & hammer pattern) on the chart with arrows, along with an alert when a new Pin bar appears. Pin bar pattern is one of the most important reversal Price Action signals.
You can set Minimum Percent of Wick (or Tail) Length over full bar length (Recommended: 60%, 70%, 75%).
Alerts can be turned on and off: Popup Email Push Notification Soun
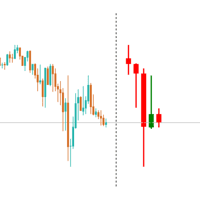
The Higher Timeframe Multiple Candle Tracker is designed to provide a snapshot of what the selected higher timeframe candles look like. It plots the N most recent candles after the current price. This tool is especially useful for traders who want to understand how the current higher timeframe candle may develop. You can choose the higher or lower timeframe from the available options. By default, bearish candles are displayed in red and bullish candles in green. The indicator also allows customi

MACD is probably one of the most popular technical indicators out there. When the market is trending, it actually does a pretty good job, but when the market starts consolidating and moving sideways, the MACD performs not so well. SX Impulse MACD for MT4 is available here . Impulse MACD is a modified version of MACD that works very well for trading Forex, stocks, and cryptocurrencies. It has its own unique feature which perfectly filters out the values in a moving average range and enables it

Основная цель индикатора — помочь трейдеру обнаружить сигналы описанные Биллом Вильямсом в своих книгах для принятия быстрого и правильного торгового решения.
1)Бар бычьего/медвежьего разворота(BDB). Реализовано понятие "Ангуляции". 2) Дивергентный бар(DB) 3) Сигнал «Второй мудрец» — третий последовательный бар Awesome Oscillator 4) Рабочие фракталы( Фракталы, которые сработали выше\ниже красной ЛБ 5) Три режима окраски баров 5.1) Окраска баров по индикатору АО (Включая приседающий бар) 5.2) О
Big Candle Scanner Dashboard MT5 The Big Candle Scanner Dashboard is a powerful tool for detecting significant bullish and bearish candles across multiple currency pairs and timeframes. Designed for professional and retail traders, it provides real-time insights into market movements with customizable alerts and a user-friendly interface. For detailed documentation click here For MT5 version check here Big Candle Scanner Dashboard MT4
Multi-Currency Scanning: The scanner supports all major

Introducing Auto Trendline Pro : Your Ultimate Trading Companion Are you tired of manually drawing trendlines on your forex charts? Do you wish for a tool that can simplify your trading while providing timely alerts? Look no further, because Auto Trendline Pro is here to revolutionize your trading experience. In the fast-paced world of forex trading, staying ahead of the curve is essential. Identifying trends, both upward and downward, can be a game-changer. This is where Auto Trendline Pro ste

Orders SL and TP Values Show Это индикатор, который отображает значения прибыли и убытка над линиями на основном графике. Кроме того, будет показано расстояние в пунктах.
Некоторые характеристики этого индикатора:
Возможность включить значения свопа для более точного расчета значений Stop Loss и Take Profit вашего ордера. (Активировано по умолчанию) Возможность включить номер тикета слева от значения цены. Это полезно для определения уровня в соответствии с набором инструментов вашего термина
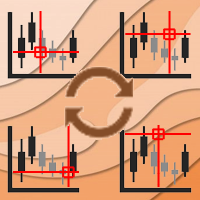
Async Charts is an indicator to synchronize charts and display a customized crosshair (cursor) on all selected charts. This is a useful utility for traders using multiple timeframes of analyzing multiple symbols for trade entry or exit.
Main Features : Real time Crosshair Synchronization on All Selected Charts
Supports Multiple Timeframes and Multiple Symbols at the same time
Auto Scroll Option
Graphical Adjustment of Color, Font, Size, ...
Locking All or Locking Specific Charts
More and More .

DONCHIAN CHANNEL DC Это индикатор тренда, разработанный “ Richard Donchian”, состоящий из 3 слоев: верхнего канала, нижнего канала и среднего канала. Он создается на канале Donchian путем нанесения на ценовой график самой высокой и самой низкой цены, достигнутой за прошедший период. Он также используется для измерения волатильности рынка, поскольку это расширяющийся/сокращающийся канал в зависимости от увеличения/уменьшения волатильности цен. Method 0; Чертеж индикатора канала Donchian. BUY/SELL
FREE

Назначение и функции индикатора Определить и промаркировать на графике момент изменения направления тренда на основе теории пробоев фрактальных уровней на любом из анализируемых таймфреймов. Если пробой фрактала по всем параметрам считается реальным, на график наносится горизонтальный луч соответствующего цвета. Если тренд вверх, то луч синего цвета. В случае пробоя уровня вниз, цвет луча красный. Синий луч по уровню преодоленного фрактала является надежным уровнем поддержки, выше которого следу
As an ICT or SMC trader you must do top-down analysis, and you struggle to make template of drawing object on Metatrader just like you normally do on Tradingview. Well, Drawing Assistance indicator will make your top-down analysis much easier on Metatrader. Allow to design template for 3 timeframes. (HTF, MTF and LTF). Each objects drawn on chart will have the color, style and visibility individually by the timeframe it was drawn on. Save time as all analyzing is done on Metatrader chart. Shortc

This is a multi-symbol and multi-timeframe table-based indicator designed for a candlestick patterns detection with 46 patterns for META TRADER 5. Each formation has own image for easier recognition. Here you find most popular formations such as "Engulfing", "Hammer", "Three Line Strike", "Piercing" or Doji - like candles. Check my full list of patterns on my screenshots below. Also you can not only switch all bearish or bullish patterns from input, but also select formation for a specified symb
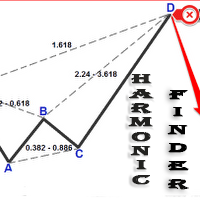
Automatically finding harmonic patterns has been made easy for traders. For those who do not know harmonic patterns : it is a method of technical analysis based on Fibonacci ratios in the markets and patterns made of these. Kind of like patterns such as triangles and double tops, but with precise measurements which makes computerized measuring tools especially appealing for trading these patterns. Some highlights from this Indicator include: Efforts to reduce the amount of screen clutter thro
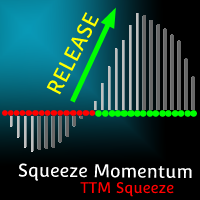
MT4 Version TTM Squeeze Momentum TTM Squeeze Momentum is an enhanced indicator ideal for recognizing consolidation periods in the market and the start of the next explosive move. This improved version is a volatility indicator based on John Carter's "TTM Squeeze" in which the histogram is based on a linear regression rather than a simple momentum indicator. Red dots on the middle line indicate that the market has entered a "Squeeze" zone or consolidation period, indicated in this enhanced versio
You can easily draw horizontal ray line for the open, high, low and close price levels of any candle with this indicator. The indicators optionally shows texts above/below the ray lines, including the line price and distance from the Bid price in points. Parameters Mode Key + click - you should press o, h, l or c keys on the keyboard first, then click on any candle. Mouse hover + click - just move your mouse and point to any candle, then press o, h, l or c keys on the keyboard. Note: in both mod

The Crash and Boom VT indicator is a highly adaptable trading tool designed to operate across a wide range of market conditions, including Crash 300, Crash 500, Crash 1000, Boom 300, Boom 500, and Boom 1000. Engineered to blend Oversold (OS), Overbought (OB), and Macho periods, this advanced indicator generates reliable trading signals, especially when used on a 5-minute timeframe. For the best outcomes, it's recommended to set the Macho period between 4-5. While the indicator offers robust capa

Основными функциями индикатора являются определение и маркировка на гистограмме индикатора Accelerator Oscillator торговых сигналов, описанных Биллом Вильямсом в книге "Новые измерения в биржевой торговле". А именно: Сигнал на покупку при расположении гистограммы индикатора ниже линии нуля. Сигнал на продажу при расположении гистограммы индикатора ниже линии нуля. Сигнал на продажу при расположении гистограммы индикатора выше линии нуля. Сигнал на покупку при расположении гистограммы индикатора

This is MT5 version, MT4 on this link: Alert Line Pro MT4 Alert line pro allows to make alert when price cross these objects: Horizontal lines Trendline Price Zone (Rectangle) Alert when close current bar (have new bar) When the price crosses the alert lines, the software will sound an alarm and send a notification to the MetaTrader 5 mobile application. You need to settings your MetaQuotes ID of MT5 apps to MetaTrader5 software to get notification to the mobile phone. Sound files must be pl
Dual Confirmation PMAX-Supertrend Indicator: The Ultimate Trading Edge The Dual Confirmation PMAX-Supertrend Indicator represents a significant advancement in technical analysis tools for serious traders. This premium indicator combines two powerful trend-following systems into a single, streamlined solution that generates signals only when both systems agree, dramatically reducing false signals and improving trading precision. Superior Signal Accuracy Through Dual Confirmation Trading success d

Этот индикатор распознает особый тип формирования внутреннего бара, который формируется большой главной свечой, за которой следуют 4 свечи меньшего размера (см. Объяснение стратегии ниже). Функции Наносит на график стоп-линии покупки / продажи, а также уровни тейк-профита и стоп-лосса. Уровни TP / SL основаны на индикаторе среднего истинного диапазона (ATR). Цвета объектов изменчивы. Отправляет вам оповещение в реальном времени, когда определяется формирование основной свечи - звуковое / всплыва
The DD_Profit_Monitor MT5 indicator is a trading tool developed by the Dagangduit Core Team . This indicator is designed to monitor profits in real-time with the following key features: All Time Profit : Displays the total profit earned since the beginning of the trading account's usage. This feature helps traders see the overall performance of their trading activities. Daily Profit : Displays daily profits, allowing traders to monitor their daily performance more specifically. Key Features: Al
FREE
This non-repainting indicator, inspired by Larry Williams’ renowned "VIX Fix", replicates the power of the VIX (Volatility Index) but works across all asset classes—making it a versatile tool for traders. Originally designed for stock indices, this version adapts to any market, including forex, commodities, and crypto, providing valuable insights into potential market bottoms.
For more details, check out this pdf: https://www.ireallytrade.com/newsletters/VIXFix.pdf
Key Features: Based on the w
FREE

Индикатор подчёркивает те моменты, которые профессиональный трейдер видит в обычных индикаторах. VisualVol визуально отображает разные показатели волатильности в единой шкале и общем масштабе. Подчёркивает цветом превышение показателей объёма. Одновременно могут быть отображены Тиковый и Реальный Объем, Действительный диапазон, ATR, размер свечи и ретурнс (разница open-close). Благодаря VisualVol вы увидите рыночные периоды и подходящее время для разных торговых операций. Эта версия предназначен
FREE

Introducing the "Super Trend Filter Oscillator," your ultimate trading companion designed to enhance your technical analysis and help you make informed decisions in the financial markets. This innovative oscillator is crafted to provide valuable insights into market trends and price movements, assisting traders like you in identifying potential entry and exit points. Features: Trend Identification: The Super Trend Filter Oscillator excels in detecting prevailing market trends, whether they are b
FREE

BinaWin NoTouch - это индикатор, который посылает сигнал тревоги, когда сделка находится в правильной позиции, чтобы дождаться пробоя бокового рынка.
Он специально разработан для торговли по стратегии «без касания» платформы Binary.Com с синтетическими индексами N.10, N.25, N.50, N.75 и N.100.
Аналогичным образом, торговля может быть осуществлена с помощью обычной стратегии CALL и PUT любой платформы бинарных опционов.
Требования к использованию индикатора:
1. Иметь учетную запись на Bina
FREE

Индикатор IRush использует модифицированную версию популярного индикатора RSI (Relative Strength Index, "Индекс относительной силы") для определения входов в рынок на дневном графике или меньше. Индикатор настроен и проверен для работы на основных символах: AUDUSD, EURUSD, GBPUSD, USDCAD, USDCHF и USDJPY. Автоматическая торговля по этому индикатору реализована в советнике Intraday Rush . Советник умеет открывать, вести и закрывать свои сделки. Обязательно посмотрите, возможно, это то, что вы иск
FREE

With this indicator user can determine not just pivot like turning points. User able to spot trading ranges boundaries and support-resistance levels. In a strong trend the reverse signals also gives us excellent entry points. Recommended user settings: In the Attis volume: look back period : 1 or (3) MA_Lenght 99. ( of course one can play with the settings and get tailored signals... as you need)
FREE
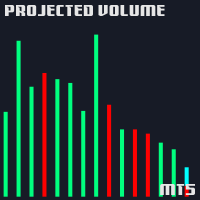
Volume Projection Indicator The Volume Projection Indicator is a specialized tool designed for traders who focus on the relationship between volume and price action. This intuitive indicator projects the expected volume for the ongoing candle, aiding in decision-making during live market conditions. The indicator presents volume data in a histogram format directly on the chart for quick analysis. Features: Bullish Volume Representation : Each green bar in the histogram signifies the volume for a
FREE

For those Price Action traders who love to trade strong Price points, like yesterday's HIGH and LOW, here is an indicator to ease the identification of those values, drawn directly on your chart! MIN/MAX of the Day will automatically draw 2 lines showing you those points for you, AND, if you like any HIGH and LOW in the past, not just yesterday's prices. It can also be configured to additionally show today's HIGH and LOW prices - just configure the refresh rate of those lines at your own taste/s
FREE
The RFOC draw smart money concepts assistant was created to assist traders who use the SMC as the basis for their buy and sell operations. With the RFOC Assistent you will have the options to draw: - Buy and Sell Order blocks, only indicating the reference candle; - Fair Value Gaps, only indicating the 2 reference Candles; - Indicate the best buying and selling regions after indicating the reference movement (60 to 80% of the fibonacci); - Draw the illustration of the market structure;

JCAutoStm 简繁塞壬模型 1.Zigzag3浪,大中小三浪代表市场潮流、趋势、涟漪。 2.自动识别当前三浪的走势,命名每一种结构形态。 Zig123下跌3浪5浪7浪:D3/D5/D7,下跌中继形态:DRF1/DRF2/DRF3,底部反转形态:BRP1,BRP2,BRP3,特殊结构下跌5浪后底部反转结构Zig123D5BRP1/2 Zig123上涨3浪5浪7浪:U3/U5/U7,上涨中继形态:URF1/URF2/URF3,顶部反转形态:TRP1,TRP2,TRP3,特殊结构上涨5浪顶部反转结构Zig123U5TRP1/2 3.趋势线绘制,分别以大中小三浪相邻的高低点进行绘制。 绘制的原则是,收敛形态。 4.三浪有效SR,F3,F6,F12,F15,绘制水平线。 MACD背离线
FREE

O Touch VWAP é um indicador que permite calcular uma Média Ponderada por Volume (VWAP) apenas apertando a tecla 'w' no seu teclado e após clicando no candle do qual deseja realizar o calculo, clicando abaixo do candle é calculada a VWAP baseado na minima dos preços com o volume, clicando sobre o corpo do candle é calculado uma VWAP sobre o preço medio com o volume e clicando acima do candle é calculado uma VWAP baseado na máxima dos preços com o volume, voce tambem tem a opção de remover a VWAP
FREE

Logarithmic chart in new window You can use both chart as half or full window All features are active in both arithmetic and logarithmic charts Magnet in arithmetic chart is standard metatrader magnet in logarithmic chart magnet have two modes: first mode only select high or low, if this mode is enabled, you can set how many candles will be search before and after to find the highest or lowest points second mode select the closest point of the candle to click, its choose between 4 points (High,
FREE

The RFOC Mini Chart was created to project a macro view of the market, which the option to select the timeframe of interest other than the main chart, it is possible to include 2 indicators:
In the full version it is possible to include 2 indicators: 1 - Moving average channel On the mini chart, the moving average will be created based on the prices of the selected time frame for the RFOC Mini Chart. The moving average period must be selected in the indicator settings pannel. 2 - Boillinger Ban
FREE
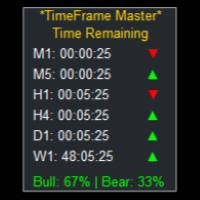
TimeFrame Master: Multi-Timeframe Countdown & Trend Analyzer Unlock the Power of Precise Market Timing with TimeFrame Master: Your Ultimate Multi-Timeframe Countdown Solution! Elevate your trading game with this revolutionary indicator designed to transform your MetaTrader into a powerful time management and trend analysis tool. Key Features: Real-Time Countdown Timers : Never miss a candle close again with precise countdown timers for all your favorite timeframes. Multi-Timeframe Analysis : M

Индикатор Volume Weighted ATR - полезный инструмент для измерения рыночной активности. В его основе лежит идея индикатора Volume-Weighted ATR. Сочетание этих двух элементов помогает определить потенциальные поворотные точки или возможности для прорыва. Индикатор для классификации активности рынка использует скользящую среднюю и ее мультипликаторы. Соответственно, где находится бар VWATR (относительно скользящей средней), он маркируется как сверхнизкий, низкий, средний, высокий, очень высокий или
FREE

Вы устали упускать выгодные рыночные тренды? Вы хотели бы иметь надежный инструмент, который мог бы точно и точно определять продолжение тренда?
Не смотрите дальше! Наш индикатор продолжения тренда призван усилить вашу торговую стратегию и помочь вам опережать конкурентов.
Индикатор продолжения тренда — это мощный инструмент, специально созданный для помощи трейдерам в выявлении и подтверждении паттернов продолжения тренда на различных финансовых рынках.
Независимо от того, торгуете ли вы ак
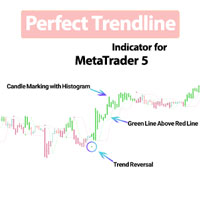
Perfect Trendline Indicator for MT5 The Perfect Trendline Indicator is an essential tool for analyzing price movements and detecting entry and exit points in MT5 . It uses two moving average lines (one fast and one slow) to identify the trend direction and signal trades when the averages intersect. This indicator displays bullish candles with green and bearish candles with red histograms . «Indicator Installation & User Guide» MT5 Indicator Installation | Perfect Trendline Indicator for MT4
FREE

Fractal Levels based on Higher Timeframe э то мощный инструмент предназначен для построения точных уровней поддержки и сопротивления на основе фракталов со старшего таймфрейма, предоставляет вам сигналы на покупку и продажу с удобными оповещениями. Принцип работы: Индикатор анализирует фрактальные уровни на старшем таймфрейме и отображает их на вашем текущем графике. Вы можете легко настроить старший таймфрейм в свойствах индикатора, чтобы получить максимальную точность и соответствие вашим стра

Trend Master Chart – это индикатор тренда, который вам нужен. Он накладывает диаграмму и использует цветовое кодирование для определения различных рыночных тенденций/движений. Он использует алгоритм, который объединяет две скользящие средние и разные осцилляторы. Периоды этих трех элементов можно изменить. Работает на любом таймфрейме и любой паре.
С первого взгляда вы сможете определить восходящий или нисходящий тренд и различные точки входа в этот тренд. Например, во время заметного восходяще

Volume Cross Over is an indicator that measure positive and negative volume flow in a financial instrument, such as a stock, commodity, or index. It is base on the idea of On-Balance Volume developed by Joseph Granville. However instead of trending lines, this indicator shows volume cross over. When the closing price of an asset is higher than the previous closing price, then the Bull volume is greater than zero and Bear volume is negative. It suggests that buying volume is dominating, and
FREE

InsideBarStop Indicator for MT5
This indicator can be used to show and evaluate the trailing stop algorithm "Trailing Stop with Inside Bars" that was proposed by the famous German trader and author Michael Voigt ("Das grosse Buch der Markttechnik") to capture robust gains when trading strong price moves. The trailing stop price is shown as a red line. You can start the trailing stop anywhere on your chart (bars or candles) by setting the "initialBarDateTime" input parameter to the open time of
FREE

Coral trend is a trend-following indicator that is widely popular among FOREX traders . It is usually used as a confluence with other indicators. It uses combinations of moving averages with complex smoothing formulas! It has two configurable parameters: Coefficient - smoothing ratio (*)
Applied price Calculation: Coral = (-0.064) * B6 + 0.672 * B5 - 2.352 * B4 + 2.744 * B3
FREE
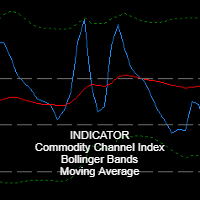
Main Indicator Description: RosMaFin Triple Insight CCI Navigator is an advanced technical indicator that combines the power of three popular indicators - CCI (Commodity Channel Index), Bollinger Bands, and Moving Average - in one comprehensive window. This versatile tool provides traders with a complex view of market conditions and helps identify potential trading opportunities with greater precision. Key Features: Display of all three indicators in one window for efficient analysis Fully custo
FREE

Necessary for traders: tools and indicators Waves automatically calculate indicators, channel trend trading Perfect trend-wave automatic calculation channel calculation , MT4 Perfect trend-wave automatic calculation channel calculation , MT5 Local Trading copying Easy And Fast Copy , MT4 Easy And Fast Copy , MT5 Local Trading copying For DEMO Easy And Fast Copy , MT4 DEMO Easy And Fast Copy , MT5 DEMO
Can set the cycle for other varieties of K line graph covered this window, fluctuations obser
FREE

Этот мульти-таймфрейм и мультисимвольный индикатор идентифицирует двойную или тройную вершину / основание или последующий прорыв линии шеи (подтвержденная вершина / основание). Он предлагает RSI, пин-бар, поглощение, пинцет, утренние / вечерние звездные фильтры, а также параметры фильтра дивергенции, которые позволяют отфильтровать только самые сильные настройки. Индикатор также можно использовать в режиме одиночного графика. Подробнее об этой опции читайте в разделе продукта. блог . В

Данный индикатор сделан на основе индикатора Heiken Ashi. Он помогает пользователю определиться с направлением сделки. В утилиту также встроена функция звукового уведомления при появлении нового сигнала. Дополнительно доступна функция уведомления по email. Ваш e-mail адрес, а также параметры SMTP сервера должны быть указаны в настройках терминала MetaTrader 5 (вкладка "Почта"). Синяя стрелка вверх = Покупка. Красная стрелка вниз = Продажа. Line = Трейлинг стоп. Вы можете использовать один из мои
FREE

The Indicator indicator draws 2 clouds based on Envelopes indicator values. The upper cloud is formed by the upper lines values and the lower cloud by the lowers lines values. The indicator allows to change the Envelopes parameters and the clouds colors the period of the base line and the deviations of each Envelopes instance. The indicator holds 5 buffer index as follow: [0] - Outer values of the upper cloud [1] - Inner values of the upper cloud [2] - Base/Center line values [3] - Inner valu
FREE

Если вам нравится этот проект, оставьте 5-звездочный обзор. Торговля большими объемами требует, чтобы мы рассмотрели несколько
инструментов/чартов для
найти новые возможности, этот показатель поможет вам при составлении конкретных
уровни множественным числом или его суффиксом и обновлять их автоматически
как изменение цены, задача, которая в противном случае будет утомительной. Например, на GBPUSD вы могли бы иметь 4 экземпляра индикатора на
диаграмма к сюжету: Каждый интервал 0,01 с длиной лин
FREE

Индикатор волатильности Чайкина (Chaikin Volatility, CHV) учитывает изменения спрэда между максимальной и минимальной ценами.
Он определяет величину волатильности на основе ширины диапазона между максимумом и минимумом. При этом в отличие от Average True Range , индикатор Чайкина не учитывает гэпы.
Согласно интерпретации Чайкина, рост индикатора волатильности за относительно короткое время указывает на приближение цен к основанию (напр., при паническом сбросе бумаги), а падение волатильности в
FREE

Индикатор High Trend Lite (высокий тренд, простая версия) мониторит 5 символов на 3 таймфреймах одновременно и определяет силу сигнала. Индикатор сообщает, когда происходит совпадение сигналов на разных таймфреймах. При этом индикатор может быть запущен на одном графике. Таким образом, High Trend Lite - это мильтивалютный и мультитаймфреймовый индикатор. С индикатором High Trend Pro , доступным по этой ссылке , у вас будет неограниченное количество символов, 4 таймфрейма, раскрашенный график осн
FREE
Узнайте, как легко и просто купить торгового робота в MetaTrader AppStore - магазине приложений для платформы MetaTrader.
Платежная система MQL5.community позволяет проводить оплату с помощью PayPal, банковских карт и популярных платежных систем. Кроме того, настоятельно рекомендуем протестировать торгового робота перед покупкой, чтобы получить более полное представление о нем.
Вы упускаете торговые возможности:
- Бесплатные приложения для трейдинга
- 8 000+ сигналов для копирования
- Экономические новости для анализа финансовых рынков
Регистрация
Вход
Если у вас нет учетной записи, зарегистрируйтесь
Для авторизации и пользования сайтом MQL5.com необходимо разрешить использование файлов Сookie.
Пожалуйста, включите в вашем браузере данную настройку, иначе вы не сможете авторизоваться.