Смотри обучающее видео по маркету на YouTube
Как купить торгового робота или индикатор
Запусти робота на
виртуальном хостинге
виртуальном хостинге
Протестируй индикатор/робота перед покупкой
Хочешь зарабатывать в Маркете?
Как подать продукт, чтобы его покупали
Технические индикаторы для MetaTrader 5 - 34

Устали подбирать настройки индикатора, теряя драгоценное время? Надоела неуверенность в их оптимальности? Пугает неизвестность в их прибыльности? Тогда индикатор ACI (автоматически калибруемый индикатор) предназначен именно, для вас. Запустив его, вы с легкостью устраните эти три проблемы одним простейшим действием – нажатием на единственную кнопку "Calibrate". А для того чтобы добиться высочайшей эффективности, достаточно выполнить лишь еще одно действие – передвинуть ползунок мощности до макси
FREE

The Stepper indicator generates Signals in strong Trend zones. Even when the Trend is set, we must filter when to ENTER or HOLD the trigger. The Trend is represented by two lines: Trend UP and Trend DOWN. W e are in a Bullish trend when the Trend UP (Green line) is above. And in a Bearish trend when the Trend DOWN (Pink line) is above.
When the momentum is aligned with the Trend , this indicator generates: BUY signals (LIME line) SELL signals (RED line) The user is alerted of the scenario, at

The Volume Heatmap indicator visually shows the INTENSITY of the volume taking into account the concept of standard deviation. Purpose of the Indicator: High volumes are common where there is a strong consensus that prices will increase. An increase in volume often occurs at the beginning of a new upward trend in the price of an asset. Some technical analysts do not rely on trend confirmations without a significant increase in volume. Low volumes usually occur when an asset is heading for a down
FREE

Данный индикатор показывает объем каждого бара (видимый диапазон) в пунктах. Гибкие настройки отображения значений. Возможна настройка параметров показа. Индикатор создавался для личного пользования, анализа графиков. Параметры: Color - цвет текстовых меток; Position - позиция метки: 0 - снизу, 1 - сверху; FontSize - размер шрифта; Angle - угол наклона текста; GapPoints - отступ по вертикальной оси.
FREE
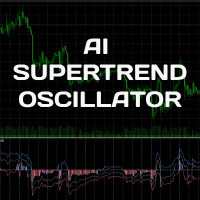
The AI SuperTrend Clustering Oscillator identifies three key outputs—bullish, neutral, and bearish—derived from variations between multiple SuperTrend indicators. FUNCTIONALITY The oscillator consists of three primary elements: Bullish Output : Represents the most optimistic signal, always the highest value. Bearish Output : Reflects the most pessimistic signal, always the lowest value. Consensus Output : Falls between the bullish and bearish outputs, serving as an overall trend indicator. A
FREE

ToolBot Probabilistic Analysis - FREE An effective indicator for your negotiations
The toolbot indicator brings the calculation of candles and a probabilistic analysis so that you have more security on your own.
Also test our FREE tops and bottoms indicator: : https://www.mql5.com/pt/market/product/52385#description Also test our FREE (RSI, ATR, ADX, OBV) indicator: https://www.mql5.com/pt/market/product/53448#description
Try our EA ToolBot for free: https://www.mql5.com/market/prod
FREE

Индикатор измеряет и отображает разницу количества изменений цен "Bid" и "Ask" в виде цифровых, аналоговых и графических показателей. Предназначен для исследования рынка и для определения моментов выхода при скальпинговой торговле на периодах графиков не более одного часа (использование на старших периодах не запрещено, но не является информативным ввиду большого количества аккумулированных значений). Теория Цены "Bid" и "Ask" меняются не одновременно для большинства символов. Зачастую можно в
FREE

Are you having trouble with too many events in the economic calendar? This reduces to the minimum number you need. You can filter by country code importance any key words and you can receive alerts before the set time of the event. ++++++++++++++ If country code is blank, display available code on the expert tab. You need to turn off the automatic calendar update setting in MT5. Any sound file of .wav format in Sounds directory. The length of keyword characters is limited by MT5.
FREE

Magnified Price Experience trading like never before with our Magnified Price indicator by BokaroTraderFx , designed exclusively for MetaTrader 5. This revolutionary tool provides traders with instant insights into price movements, offering a clear advantage in today's fast-paced markets.
Key Features: 1. Real-time Precision: Instantly magnify price action to uncover hidden trends and patterns. 2. Enhanced Visibility: Clear visualization of price movements with adjustable zoom levels. 3. User
FREE

"Moving Ratio Candle" is used to check the distance of a candle to a theoretical pressure point. Furthermore, we have two points of interest, the first for the mean and the second for the median. This indicator uses the shape of bars and the line that crosses the bar from left to right is based on the calculation of the closing price for both sides. The rest follows a more standard calculation. The same could be done as a line, but I want to know the behavior of this indicator in relation to the
FREE
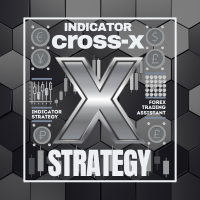
A buy signal can be seen on the dashboard when the previous signal is red and the next signal is green, then the SAR is green and the RSI is green.
A Sell Signal can be seen on the dashboard when the previous Signal is green and the Signal after it is red, then the SAR is red and the RSI is red.
Line function - shows on the chart the lines of Opening, Stop Loss, Take Profit. With this function, it is easy to create a new order and see its additional characteristics before opening. TP and SL
FREE

Простые индикаторы для MT5
Очень простой инструмент, облегчающий визуализацию индикаторов. Особенно полезно, если контрольный индикатор очень тонкий или его трудно прочитать.
В этом блоге вы можете прочитать о различных типах поддерживаемых индикаторов (индикаторы с цветовым буфером недоступны): Пересечение нулевой линии Две линии пересекаются Активация буфера Нулевая линия пересекается с фильтром Кроссы с ценой (MAs) Кресты внутри фильтра
FREE

GPF Stochastic: a momentum indicator that compares a specific closing price of an asset to a range of its prices over a certain period. It helps traders identify potential overbought or oversold conditions in the market. The indicator consists of two lines: %K Line : The main line, which represents the current closing price relative to the price range over a set period. %D Line : The signal line, which is a moving average of %K. The Stochastic Oscillator ranges from 0 to 100 , with levels typic
FREE

Продвинутая мультисимвольная/мультитаймфреймная версия индикатора "Candle Pattern Finder for MT5 " (Поиск свечных паттернов на основе книги Грегори Л. Морриса «Японские свечи. Метод анализа акций и фьючерсов»). Индикатор ищет свечные паттерны по всем символам окна "Market Watch" и по всем стандартным таймфреймам от M1 до MN1. При возникновении паттерна на любом символе/таймфрейме индикатор дает сигнал (текстовый, звуковой, отправка сообщения на мобильник и эл.почту).
Таким образом, размещая инди

DESVIO DE MARCON (Desvio Dinâmico de VWAP) O Desvio de Marcon é um indicador desenvolvido com o intuito de fornecer ao TRADER uma ferramenta capaz de antecipar pontos relevantes de suporte e resistência através de canais de desvios de VWAP traçados no gráfico. Mas qual a diferença entre o Desvio de Marcon e os canais de desvio padrão da VWAP já existentes? O Desvio de Marcon utiliza um algoritmo estatístico desenvolvido por Luiz Antonio de Sousa Marcon, que lhe dá a capacidade de se auto calib

About This Indicator: RSI vs SMA Oscillator: A Comprehensive Technical Analysis Tool for Better View of Market Price
The RSI vs SMA Oscillator is a powerful technical analysis tool designed to understanding Market Price Fluctuation for buy or sell signals. This user-friendly Oscillator good for both novice and experienced traders, providing valuable insights into market trends and price movements. Key Features: - RSI Cross Alert: The indicator is based on the Relative Strength Index (RSI), a pop
FREE

Volality 75 Fractal Scalper Non-repaint The arrows appear on the current candle. momentum and trend based strategy Works on all timeframes from the 1 Minute to the Monthly timeframe Bollinger bands have been added to show the trend direction whether its bullish or bearish Blue fractal arrow is your buy entry Orange fractal arrow is your sell entry you can use the Vix 75 fractal scalper in combination with other indicators.

The Expert Advisor for this Indicator can be found here: https://www.mql5.com/en/market/product/115445 The Break of Structure (BoS) and Change of Character indicator is a powerful tool designed to identify key turning points in price movements on financial charts. By analyzing price action, this indicator highlights instances where the market shifts from a trend to a potential reversal or consolidation phase.
Utilizing sophisticated algorithms, the indicator identifies breakouts where the stru

Many traders use Price Action as entry and exit signal. Since the beginning of chart analysis, traders have found several candlestick patterns that can indicate possible "behaviors" of the market. Candlestick Pattern indicator is an indicator for MetaTrader platform that can detect many of these patterns and show them on screen or to alert traders about them. though they detect slightly different sets of candle patterns. Candlestick Pattern indicator also has a more modern look compared
FREE

Market tops are characterized by Volume Climax Up bars, High Volume Churn and Low Volume Up bars (also called Testing). Market bottoms are characterized by Volume Climax Down bars, High Volume Churn and Low Volume Down bars (Testing). Pullbacks, in either up or down trends, are similar to market topping or bottoming patterns, but shorter in duration and with simpler volume patterns.
FREE

The Pranavtrxx ( Author ) Levels Indicator is a precision-based trading tool designed to identify key price levels in the market, helping traders make informed entry and exit decisions. This indicator automatically plots dynamic support and resistance zones derived from historical price action, psychological price levels, and recent market structure. Whether you're a day trader or swing trader, this tool offers real-time market level tracking that adjusts with price movement, helping you pinpoin

The Double Stochastic RSI Indicator is a momentum indicator which is based on the Stochastic Oscillator and the Relative Strength Index (RSI). It is used help traders identify overbought and oversold markets as well as its potential reversal signals. This indicator is an oscillator type of technical indicator which plots a line that oscillates within the range of zero to 100. It also has markers at levels 20 and 80 represented by a dashed line. The area below 20 represents the oversold area, wh

Dominant Candle Finder is a significant candlestick on a price chart that stands out due to its size, volume, or price movement compared to surrounding candles. It often indicates strong buying or selling pressure and can be used to identify potential reversal points, breakouts, or continuations in the market. Dominant candles can serve as key indicators for traders to make informed decisions, providing insights into market sentiment and potential future price movements. MT4 Version - https://w
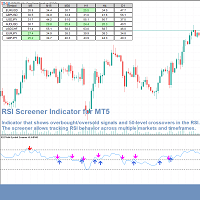
RSI Screener for MT5 is a simple dashboard-type indicator that displays the RSI (Relative Strength Index) oscillator values on different instruments and time frames chosen by the user. In addition, it can be configured by the trader to show signals when the RSI is in overbought/oversold condition, when it crosses these levels or when it crosses the 50 level, which is important in some strategies. It is simple and easy to configure. On its own, it should not be used as a trading system since RSI
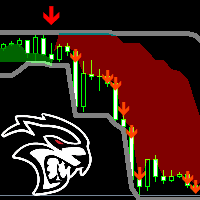
Non repaint color trend channel lower and upper bands show the current support and resistance once price touches the lower band Blue Arrow will appear and a green color indicating a bullish trend is your buy entry. the arrow will not disappear. once price touches the upper band Red Arrow will appear and a red color indicating a bearish trend is your sell entry. the arrow will not disappear. the trend channel is made for all timeframes and works on all pairs.

Introduction to X3 Chart Pattern Scanner X3 Cherart Pattern Scanner is the non-repainting and non-lagging indicator detecting X3 chart patterns including Harmonic pattern, Elliott Wave pattern, X3 patterns, and Japanese Candlestick patterns. Historical patterns match with signal patterns. Hence, you can readily develop the solid trading strategy in your chart. More importantly, this superb pattern scanner can detect the optimal pattern of its kind. In addition, you can switch on and off individu

Easily get all relevant economic events of the current day right into your chart, as markers. Filter what kind of markers do you want: by country (selected individually) and by Importance (High relevance, Medium, Low or any combination of these). Configure the visual cues to your liking. Additionaly you have the ability to add up to 5 personal markers of your own agenda. With Alerts and/or with blackout periods, if you are using it within an Expert Advisor! All in one Economic Calendar indicator
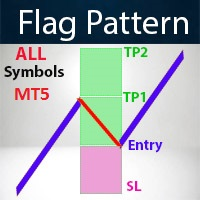
Contact me for instruction, any questions! Related Product: Gold Trade Expert MT5 , Professor EA - Non-repaint - Lifetime update free I just sell my products in Elif Kaya Profile , any other websites are stolen old versions, So no any new updates or support.
Introduction Flag patterns are an important tool for technical traders in the stock market. When interpreting a flag pattern, it is important to wait for the pattern to pick a direction before entering a trade, as flags are generally

Способ применения Pair Trading Station Рекомендуется использовать Pair Trading Station на таймфрейме H1 с любой валютной парой. Чтобы получить сигналы на покупку и продажу, следуйте указанным ниже инструкциям по применению Pair Trading Station в терминале MetaTrader. При загрузке Pair Trading Station на график индикатор оценит доступные исторические данные на вашей платформе MetaTrader для каждой валютной пары. В самой начале на графике отобразятся исторические данные, доступные для каждой валют
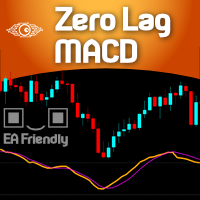
For those who are fans of the traditional MACD ( Moving Average Convergece/Divergence ) indicator, here it is a way faster indicator that could be very useful for intraday trading. Of course it could be used in higher timeframes, with the proper settings. Here at Minions Labs we always encourage traders to calibrate every single indicator you have to extract and distill every drop of good information it has for you. And this is the case with this speedy friend... This Zero Lag MACD could be used

Индикатор сканирует до 15 торговых инструментов и до 21 таймфрейма на наличие высоковероятностных моделей паттерна Двойная вершина/дно с ложными прорывами . Что определяет этот индикатор: Этот индикатор находит особую форму таких паттернов, так называемые двойных вершин и нижних частей, так называемый Двойная вершина/дно с ложными прорывами . Паттерн "Двойная вершина с ложными прорывами" формируется, когда максимальная цена правого плеча выше левого плеча. Паттерн "Двойное дно с ложными прорывам
FREE
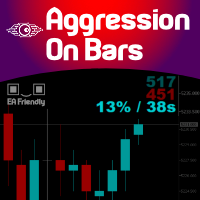
Imagine a Buy and Sell Pressure monitor on your chart that shows in REAL-TIME this data, bar by bar? Well, imagine no more. We present you an exclusive creation of Minions Labs : Aggression On Bars indicator. On every new bar on you chart this indicator will start counting in real-time the BUY/SELL pressure and present this data statistics directly inside your chart. As soon as a new bar is created in your chart, the counter restarts. Simple and effective. Just watch the video to see it running

One of the most famous phrases in the trading world is "The Trend Is Your Friend".
Trading following the current trend is one of the most successful ways in terms of probability. The hard part of it is to recognize when the market is trending or not.
that's the role of our indicator we called The Trend Is Your Friend Until It Is Not. Apart from its big name it is really easy to use and see when the market is trending or ranging. Through a little window of 3 colors you will identify if the mark

Индикатор " Pure View" предназначен для быстрого отображения и скрытия индикаторов на графике. Особенности
1. На текущий момент Pure View работает с индикаторами Stochastic, MACD, RSI 2. Отображение и скрытие индикаторов осуществляется при помощи горячих клавиш 3. Комбинация клавиш Shift + C отобразит на графике или скроет с него индикатор " Stochastic" 4. Комбинация клавиш Shift + V отобразит на графике или скроет с него индикатор " RSI" 5. Комбинация клавиш Shift + B отобразит на графике или с
FREE

Initialize RSI with period 2 above the closing price. Initialize EMA with period 20 above the closing price. Buy condition: RSI < 15 (oversold). Closing price of 4 consecutive candles > EMA (uptrend). Place BUY signal at the bottom of the candle. Sell condition: RSI > 85 (oversold). Closing price of 4 consecutive candles < EMA (downtrend). Place SELL signal at the top of the candle
FREE

** All Symbols x All Time frames scan just by pressing scanner button ** *** Contact me to send you instruction and add you in "Order Block group" for sharing or seeing experiences with other users. Introduction: The central banks and financial institutions mainly drive the market, Order block is considered a market behavior that indicates accumulation of orders from banks and institutions, then the market tends to make a sharp move(Imbalance) on either side once the order block is

The Bolliger Bands On-Off let you control the indicator using the keyboard or a button . You can choose if you want the indicator always shown or always hided while switching among different time frames or financial instruments . ---> This indicator is part of Combo Indicator OnOff
The Bollinger Bands identify the degree of real-time volatility for a financial instruments . A lower amplitude corresponds to a low volatility, conversely a greater bandwidth corresponds to high volatility.
FREE

Стрелочный индикатор, выдающий сигнал при пересечении канала боллинждера. Сигналы выдаются в виде стрелок и подходят для торговли бинарными опционами.
Входные параметры Period of BB - период боллинджера Shift of BB - смещение боллинджера Deviation of BB - отклонение боллинджера Inform about finding the signal - параметр, отвечающий за получение уведомлений (Alert) о найденном сигнале. По умолчанию - да
FREE

Non-proprietary study of Joe Dinapoli used for trend analysis. The indicator gives trend signals when the fast line penetrates the slow line. These signals remain intact until another penetration occurs. The signal is confirmed at the close of the period. It is applicable for all timeframes. Inputs lnpPeriod: Period of moving average. lnpSmoothK: %K period. lnpSmoothD: %D period. ********************************************************************************
FREE

The Relative Strenght Index presented to the world in 1978 by J. Welles Wilder Jr. in his book " New Concepts in Technical Trading Systems " is widely used around the world in several ways, not only with the traditional approach of Overbought and Oversold states, which in several cases and depending on the assets and timeframes it just simply doesn't work anymore . BUT, this indicator has its value when used, for instance, looking for divergences between its measuring system and the Prices appea

Pivot Points are used by Forex traders to find support and resistance levels based on the previous day's price action. There are various ways to calculate pivot points, including averaging the open, high, low, and close of the previous day's chart price.
Forex Traders use a combination of pivot points with moving averages to find trading opportunities in the currency markets.
Pivot points are very useful tools that use the previous bars' highs, lows and closings to project support and resist
FREE
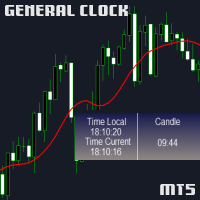
A Simple clock that on the left side "Time" shows r espectively the TimeCurrent, followed beneath by the TimeLocal. On the right hand side we have the remaining minutes and seconds of the current candle. TimeLocal is synced every 500 miliseconds however, the TimeCurrent and the time left on the candle are synced every tick, so this can lead to inconsistencies on the readings so keep that in mind.
This indicator have no plots or buffers so it cannot be used in any time based EA.
FREE

The simplest indicator. It emits a standard sound signal (an audio file from the standard MetaTrader library - alert.wav) after a period of time you select. Unfortunately I was unable to add the ability to select your file due to language restrictions. There is a bug in the indicator that I don't know how to fix: when switching the time frame, the sound signal is emitted after about 10-15 seconds. P.S. But if you want a real indicator that can change your vision of trading - download my AZ Volzo
FREE

Рынок Форекс может пройти множество различных ценовых путей к достижению некоей точки в будущем. Будущее динамично. Поэтому, планирование торговли с возможным будущим сценарием является важным шагом для вашего успеха. Для этих целей представляем вашему вниманию Harmonic Pattern Scenario Planner, первый предиктивный инструмент для определения гармонических моделей в своем роде.
Основные характеристики Прогнозирование будущих моделей для анализа сценариев 11 Определение гармонических моделей Авто

Switch symbols and timeframe by arrow buttons 1. You can switch multiple symbols of one or all charts. 2. You can set list of symbols to switch between them or get them from Market Watch. 3. You can change timeframe of one or all charts. List of timeframes here [M1, M5, M15, M30, H1, H4, D1, W1, MN1]. Switch symbol of all charts: indicator check current symbol of the chart to get index of it in list and change for next or previous. Key functions: - Right arrow key: switch to next symbol. - Left
FREE
QQE Divergen – Advanced Trading Indicator
Overview
The QQE (Quantitative Qualitative Estimation) indicator is a powerful trading tool designed to enhance trend detection and market momentum analysis. QQE is an advanced version of the RSI (Relative Strength Index) that utilizes smoothed moving averages and dynamic trailing levels to generate highly accurate signals.
QQE Divergen improves upon the traditional QQE by integrating divergence detection, making it even more effective for identif
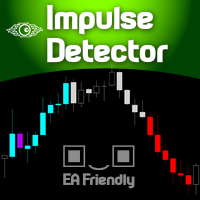
Imagine a support tool that Colors Up the candlesticks on your chart according to the market behavior, based on Trend , Momentum , Price Behavior, and/or Volume . You choose what to use! Well, welcome to the Minions Labs creation called Impulse Detector ! This flexible indicator is designed to give visual support on your chart using just colored candlesticks, so you can continue to draw your studies, use any other indicators in auxiliary sub-windows without affecting your screen real state. It d

This is a regression tree indicator for MT4/MT5.
This indicator classificate nodes on the time period so that the deviation becomes smaller,
and displays regression line and channel for each node.
It's free!
Attached CartDemo.ex4 and CartDemo.ex5 is a Demo version and has the following limitations:
Can't use HighSpeed method (default method is RandomForest)
Maximum number of bars is 260 (increase from 200)
There is no expiration date and can be started many times, but it stops after an hour.
FREE

Этот индикатор позволяет вам изменить внешний вид вашего графика, применяя плавный переход между двумя настраиваемыми цветами для фона. Этот эффект градиента привлекает внимание и придаёт вашему графику свежий, современный вид, делая его более привлекательным визуально. Градиент применяется ко всем окнам индикаторов, которые уже есть на вашем графике, когда индикатор прикреплён, и также будет влиять на любые новые окна индикаторов, добавленные позже. Попробуйте и обновите внешний вид ваших графи
FREE

Maximize Your Trading Opportunities with the "Auto Trendlines" Indicator Discover the "Auto Trendlines" Indicator: "Auto Trendlines" is the essential tool for every technical trader. This indicator automatically plots trend lines, pinpointing support and resistance levels with surgical precision. It's ideal for those looking to capitalize on market breakouts and reversals. Key Features: Automatic Trendline Plotting: Identifies and draws crucial trend lines without manual intervention. Advanced C

Pip Scope – Accurate Chart Perception for Smarter Trades The Problem:
MetaTrader automatically adjusts the vertical scale of charts to keep all candles visible. While this is helpful for keeping price action on screen, it can distort your perception of movement size. A small move may suddenly appear huge, while a large move may look minor. This can mislead traders—especially scalpers and intraday traders—into poor risk assessment, incorrect position sizing, and misplaced stop-loss levels. T
FREE

The Advanced Pivot Point Indicator is a powerful tool designed to help traders identify key support and resistance levels in the market. This versatile indicator offers a customizable and user-friendly interface, allowing traders to select from five different pivot point calculation methods: Floor, Woodie, Camarilla, Tom DeMark, and Fibonacci. With its easy-to-read lines for pivot points (PP), support (S1, S2, S3, S4), and resistance (R1, R2, R3, R4) levels, the Advanced Pivot Point Indicator pr
FREE

Professional Histogram MT5 или сокращенно PH - это высокоэффективный и надежный инструмент, который позволяет определить направление и силу тренда. PH прост в использовании и настройке, поэтому подойдет как начинающим так и опытным трейдерам. В отличие от большинства индикаторов, Professional Histogram находит более длительные тренды и дает меньше ложных сигналов. При появлении сигнала на покупку или продажу срабатывает алерт, что позволяет своевременно открыть позицию и не сидеть постоянно у мо

Composite Force Index (CFI) – Multi-Dimensional Trading Indicator CFI [ Core Features ] 4-Dimensional Analysis combining: Quantum Temporal Flux (Price Dynamics) Chaos Index (Volatility Mapping) Harmonic Patterns (Cyclical Structures) Force Index (Volume + Momentum Fusion) Adaptive Logic including: Dynamic weighting based on market conditions Auto-adjusting signal threshold ( adaptive_sensitivity ) 3-bar statistical validation ( ValidateSignal ) Professional Visuals : 3-color histogram (B
FREE

Description : Rainbow MT5 is a technical indicator based on Moving Average with period 34 and very easy to use. When price crosses above MA and MA changes color to green, then this is a signal to buy. When price crosses below MA and MA changes color to red, then this is a signal to sell. The Expert advisor ( Rainbow EA MT5 ) based on Rainbow MT5 indicator is now available here .
MT4 version is available here .
FREE

Special Offer ... It is totally free for all. New one coming soon...................
About This Indicator: RSI vs SMA Indicator: A Comprehensive Technical Analysis Tool for Better for Identify the Short and Long Signals.
The RSI vs SMA Indicator is a powerful technical analysis tool designed to understanding Market Price Fluctuation for Long or Short signals. This user-friendly Indicator good for both novice and experienced traders, providing valuable indication in price chart and separate wind
FREE

For those who feel that regular RSI is too fast and too noisy to be used on regular trades or in EAs and want to have an alternative to meter the Momentum of the Price, here is a solution presented on the great article of the Technical Analysis of Stocks & Commodities magazine (April, 2015), by Vitali Apirine, called: Slow Relative Strenght Index . Its reading is almost the same as the regular RSI, but its levels of Overbought and Oversold are 80 and 20 instead. SRSI is very powerful to show div
FREE

Highly configurable Demarker indicator.
Features: Highly customizable alert functions (at levels, crosses, direction changes via email, push, sound, popup) Multi timeframe ability Color customization (at levels, crosses, direction changes) Linear interpolation and histogram mode options Works on strategy tester in multi timeframe mode (at weekend without ticks also) Adjustable Levels Parameters:
Demarker Timeframe: You can set the lower/higher timeframes for Demarker. Demarker Bar Shift: Y ou
FREE

This is the Full Version, to get the free version please contact me. The free version works on “USDJPY” charts. All symbols and time frames scanner. Contact me after payment to send you the User-Manual PDF File. OVER and UNDER
Over & Under pattern is an advanced price action trading concept in the trading industry. The Over & Under pattern is more than a confluence pattern or entry technique than a trading strategy. It is a reversal pattern that is created after a significant obvious trend. It

Esse Indicador é uma boa opção para quem gosta de operar a longo prazo e com paciência. Ele trabalho com os níveis de fibo na media de 200 são 9 níveis onde você pode operar nas reversões o mercado partir do níveis abaixo. Level 1 = 550 pontos Level 2 = 890 pontos Level 3 = 1440 pontos Level 4 = 2330 pontos Level 5 = 3770 pontos Level 7 = 9870 pontos Level 8 = 15970 pontos Level 9 = 25840 pontos Level 6 = 6100 pontos
FREE

The indicator is getting the four most important trading sessions: New York London Sydney
Tokyo The indicator auto calculate the GMT time. The indicator has buffers that can be used to get the current session and the GMT.
You can use it as stand alone indicator and you can turn the draw off and call it from your EA. INPUTS Max Day: Max days back to get/draw. London Session On: Show/Hide London Session. New York Session On: Show/Hide New York Session. Sydney Session On: Show/Hide Sydney Session
FREE

The Simple Market Sessions Indicator helps traders visualize the current status of major forex market sessions: Asian , London , New York , and Sydney . It shows whether each market is Open , Active (based on volume) , or Closed directly on the chart. With customizable session times and a volume threshold, this tool helps traders monitor session activity and volume strength, making it easier to decide the best times to trade.
Key features: Displays status: Open, Active (High Volume), or Closed
FREE

The FREE version works on Demo account and only CADCHF and NZDCHF pairs.
The indicator predict the future candles direction, by scanning past candle movement. Based on the principal: “ The history repeat itself”. Programmed according to Kendall Correlation. In the settings menu, different scanning options are available. When the indicator find a match, start painting future candles from the current candle to the right, also from the current candle to the left as well, showing you the candle pa
FREE

Monte Carlo simulation is an Indicator that uses a Monte Carlo model to calculate the probability of the price going up or down. If the price has a probability of going up or down more than 90%, the system will enter a trade by doing a back test of gold assets. It was found that it was able to generate a return of more than 20% in a period of 5 months while having a MAX DD of less than 7%.
What is a Monte Carlo simulation?
A Monte Carlo simulation is a model used to predict the probability of
FREE
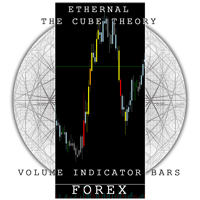
Cube Bars Forex - это индикатор для мета трейдера 5, созданный мной Томасом Лекимом для раскрашивания свечей на основе пиков объема крупных инвесторов на рынке форекс. Он отслеживает пики покупки и продажи и раскрашивает свечи в соответствии с количеством денег, вложенных другими роботами. Это мощный инструмент против больших роботов, потому что он определяет моменты, когда он должен принимать решения. Его можно настроить в соответствии с валютной парой, которую вы будете использовать. Он имеет

Прорыв трендовой линии, а также максимума или минимума обычно сообщает о смене (или продолжении) тренда. Данный и ндикатор отображает линии по максимумам и минимумам цены, а также находит и показывает наклонные трендовые линии. Как только цена выходит за линию, и свеча закрывается, то индикатор сигнализирует об этом стрелкой (также, можно включить оповещения). Этот индикатор прост в использовании, при этом, существует много торговых стратегий, которые основаны на прорыве трендовых линий. Количес

Этот мультисимвольный индикатор был разработан, чтобы автоматически определять, когда цена достигает основных психологических уровней. Также известны как круглые числа, целые числа или ключевые уровни. В качестве бонуса он также может сканировать уровень точки разворота на одном выбранном временном интервале. В сочетании с вашими собственными правилами и методами этот индикатор позволит вам создать (или улучшить) вашу собственную мощную систему. Функции Может записывать сигналы в файл, который м
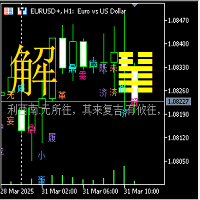
I Ching 64 Hexagram Change Indicator
1. Hexagram Indicator Description: (1) This 64 Hexagram Change Indicator is based on the Yin-Yang transformation thought of the "I Ching" philosophy in ancient Chinese culture, integrating the results of the long and short game of each candlestick K-line period of the financial trading K-line chart, using China's oldest prediction coding method, in the form of the I Ching 64 hexagrams, combining the Yin-Yang of each line of the hexagram with the Yin-Yang of
FREE
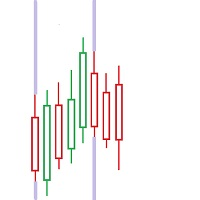
FIRST: I am NOT a coder ! I am a TRADER that was forced to code, because i needed some special tools! So i am sorry for minor graphic-bugs and so on...
this little free tool allows you to set 5 vertical lines at specific time. you can use it to mark london open / asia open / comex open and so on... it draws the lines in the future space - so you wont miss an important time / candle
you can select color..thickness of the lines you can select only 2 or 3 of the 5 max. lines - you dont have to us
FREE

Currency Strength Chart is a powerful Forex indicator designed to track and visually represent the strength of individual currencies within a basket of the 8 major currencies: USD, EUR, GBP, JPY, AUD, NZD, CAD, and CHF. By calculating the relative strength of each currency, the indicator provides traders with a comprehensive overview of how each currency is performing against the others in real-time. This indicator helps traders identify potential trading opportunities by highlighting strong cur
FREE
MetaTrader Маркет - торговые роботы и технические индикаторы для трейдеров, доступные прямо в терминале.
Платежная система MQL5.community разработана для сервисов платформы MetaTrader и автоматически доступна всем зарегистрированным пользователям сайта MQL5.com. Ввод и вывод денежных средств возможен с помощью WebMoney, PayPal и банковских карт.
Вы упускаете торговые возможности:
- Бесплатные приложения для трейдинга
- 8 000+ сигналов для копирования
- Экономические новости для анализа финансовых рынков
Регистрация
Вход
Если у вас нет учетной записи, зарегистрируйтесь
Для авторизации и пользования сайтом MQL5.com необходимо разрешить использование файлов Сookie.
Пожалуйста, включите в вашем браузере данную настройку, иначе вы не сможете авторизоваться.