Смотри обучающее видео по маркету на YouTube
Как купить торгового робота или индикатор
Запусти робота на
виртуальном хостинге
виртуальном хостинге
Протестируй индикатор/робота перед покупкой
Хочешь зарабатывать в Маркете?
Как подать продукт, чтобы его покупали
Технические индикаторы для MetaTrader 5 - 39

Стрелочный индикатор, выдающий сигнал при пересечении канала боллинждера. Сигналы выдаются в виде стрелок и подходят для торговли бинарными опционами.
Входные параметры Period of BB - период боллинджера Shift of BB - смещение боллинджера Deviation of BB - отклонение боллинджера Inform about finding the signal - параметр, отвечающий за получение уведомлений (Alert) о найденном сигнале. По умолчанию - да
FREE

The "Dagangduit Spread Indicator" is a versatile tool designed to provide traders with essential information about the current spread in the chart window. This indicator offers customizable features, including font parameters, display location on the chart, spread normalization, and alerts to enhance your trading experience. Key Features: Real-time Spread Display : The indicator displays the current spread in real-time on your trading chart, allowing you to stay informed about the cost of execut
FREE

Property of Vertical Capital Edition: Gugol_Quants About USA INDEXES QUANT_INDICATOR: This is a indicator created by math modulation to be used as a trading tool, which was developed in MQL. (MT5) This indicator is for use only with US500(S&P500), NAS100(Nasdaq Composite) and US30(Dow Jones). Signals are activated on "Open" Candle. It’s based on Intraday/Swing Trades whose main timeframe is H1, H2, H3 and H4. However you can use it with other assets by testing with the appropriate settings. *
FREE

The Indicator indicator draws 2 clouds based on Donchian Channels indicator values. The upper cloud is formed by the upper lines values and the lower cloud by the lowers lines values. The indicator allows to change the Channels parameters and the clouds colors the period of the base line and the multiplier of each Donchian Channels instance. The indicator holds 5 buffer index as follow: [0] - Outer values of the upper cloud [1] - Inner values of the upper cloud [2] - Base/Center line values [3
FREE

UzFx-Local Currency Converter-MT5 - это мощный и простой в использовании индикатор, предназначенный для трейдеров, которые хотят отслеживать свои плавающие и ежедневные прибыли и убытки (P&L) как в долларах США, так и в местной валюте. Этот инструмент обеспечивает конвертацию в реальном времени по заданному пользователем обменному курсу, помогая трейдерам более эффективно визуализировать свои торговые показатели.
(Посетите профиль и ознакомьтесь с другими продуктами MT4/MT5) (Пожалуйста, н
FREE

Стратегия форекс «Гора» основана на одном довольно сложном индикаторе. С его помощью генерируются вполне неплохие сигналы и, в принципе, автор указывал возможность торговли и на остальных инструментах, однако, мы решили взять изначальный вариант — торговлю только по GBP/USD. Так же следует сказать, что по ходу развития тренда торговая стратегия пропускает большое количество неплохих точек входа, но это только на первый взгляд. Фильтрация сигналов показала себя достаточно неплохо и в итоге торгов
FREE

Multi-MA Ribbon Overlay (6 EMAs + 250 SMA)
This indicator displays six exponential moving averages (15, 25, 35, 45, 60, 70)(YOU CAN CHANGE THE VALUES) and a slow 250-period simple moving average to help visualize market momentum and trend structure. It’s designed as a clean trend-ribbon for scalpers, intraday, and swing traders. ️ Disclaimer:
Trading forex and CFDs on margin carries a high level of risk and may not be suitable for all investors. Leverage can work for or against you. Always u
FREE

This indicate will set the global variable GlobalVariableSet(" G_News ",1); when there is news. You can add this indicator to any char, it is not necessary that the char has your EA
Just add this code to your EA ( file mq5) to identify when there is news
int news=0; if(GlobalVariableGet("G_News")==1) {news=1;}
This is the identification code when there is news, how to handle it is up to you You can customize the pause time, customize the country you want to get news from...
FREE

Dynamic Theoretical Stop
Histogram indicator that dynamically analyzes the theoretical Stop levels in real time.
Operation :
The DTS - Dynamic Theoretical Stop does a mapping of fractals in previous candles and suggests two levels of Stop: For purchase and for sale.
Suggested reading :
It is necessary to make the definition of Maximum Stop in points in the Trading Plan. In this way, the trader can decide the best entry point by analyzing the theoretical stop levels:
Stop for sales: Shown a
FREE

The liquidity swings indicator highlights swing areas with existent trading activity. The number of times price revisited a swing area is highlighted by a zone delimiting the swing areas. Additionally, the accumulated volume within swing areas is highlighted by labels on the chart. An option to filter out swing areas with volume/counts not reaching a user-set threshold is also included.
This indicator by its very nature is not real-time and is meant for descriptive analysis alongside other com

TickChart Indicator plots tick line on the main window of MetaTrader.
In the Lite version, the number of ticks is limited to 20 and the alert function described below is omitted. The tick-line shows the most detailed, fastest and real-time activities of the market, which are usually hidden in bars or candles longer than 1 minute. Usually, several new tick-line segments appear while a bar of M1 time frame is completed. After the release of an important economic indicator, the number of ticks per
FREE

Цвета генерируются в соответствии с параметрами высоты и глубины.
Анализ проводится в соответствии с направлением цены и объема торговли, если стоимость сделки превышает расчетную базу. система меняет цвет на зеленый, информируя вас о сильном направлении цены на покупку, если торгуемое значение меньше база расчета системы меняет цвет на красный, указывая на сильную цену на продажу.
FREE
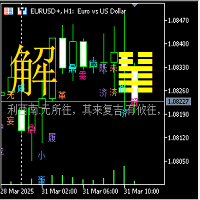
I Ching 64 Hexagram Change Indicator
1. Hexagram Indicator Description: (1) This 64 Hexagram Change Indicator is based on the Yin-Yang transformation thought of the "I Ching" philosophy in ancient Chinese culture, integrating the results of the long and short game of each candlestick K-line period of the financial trading K-line chart, using China's oldest prediction coding method, in the form of the I Ching 64 hexagrams, combining the Yin-Yang of each line of the hexagram with the Yin-Yang of
FREE

- Chart Time Indicator is very simple and easy, but it can be very important to control the time before opening any manual trade. This indicator shows the time on the chart between 3 different options. Input Parameters: - Show Time : Select all the time options that you want to see. Local Time (Personal Computer Time), Server time (Broker Time) or GMT Time. Recommendations: - Use only one Chart Time Indicator for each Chart.
FREE

Индикатор отображает текущий спред инструмента, минимальное, среднее и максимальное его значения за текущий бар в виде цифровых, аналоговых и графических показателей. Имеет два режима работы: фиксирование транслируемого системой значения спреда, или вычисление спреда как разницы между ценами "Bid" и "Ask" на каждом поступившем тике. Параметры
Индикатор имеет единственный входной параметр: Type of calculation - тип вычисления спреда. Может принимать следующие значения: System spread - значения
FREE

Это модифицированная и улучшенная версия классического HMA, изначально разработанного Аланом Халлом в 2005 году. Использует комбинацию трёх взвешенных скользящих средних (WMA), чтобы минимизировать запаздывание. Вход на покупку: когда HMA меняет цвет с красного на синий и направлен вверх. Вход на продажу: когда HMA меняет цвет с синего на красный и направлен вниз.
Особенности Встроенный мульти-таймфрейм сканер, который отслеживает новые сигналы на всех таймфреймах. HMA устраняет задержки, хар

This indicator has the main purpose of showing the current spread of the asset in which the indicator was placed. Depending on the photos, visually and within the graph itself, it is possible to view the spread value at the current time, it is possible to change the vertical position of the text and the horizontal position, in addition to the font size and color of the text.
FREE

Индикатор имеет всего один параметр - это количество баров для анализа.
Индикатор рассчитывает статистику, когда рынок шел вниз, когда наверх, количество баров для каждого движения.
Из этих данных высчитывается средний показатель количества баров, который вырисовывается в окне индикатора.
Если значения индикатора резко понижается, то рынок готовится к движению наверх.
Если значения индикатора долго держится на высоких значениях, то рынок готовится к снижению.
FREE
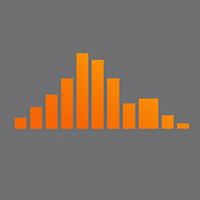
Индикатор показывает изменение цены текущего или любого другого инструмента с начала дня/недели.
Можно выбрать отображение в пунктах или же в процентах относительно цены открытия начала периода.
Индикатор выполнен в виде гистограммы с двумя цветами, для восходящего и нисходящего изменения цены.
Вы так же можете выбрать, для какого инструмента показывать данные. Данные будут отображены на текущем графике.
FREE

MultiTimeAnchor MA — ваш новый помощник для умного и удобного анализа рынка! Этот бесплатный индикатор отображает три различных скользящих средних , каждая из которых настроена на уникальный временной период. Это значит, что вы можете видеть, как ведет себя рынок в короткосрочной, среднесрочной и долгосрочной перспективе — всё одновременно, без необходимости переключаться между графиками. Вы можете выбрать один из нескольких типов скользящих средних, таких как простая скользящая средняя, экспоне
FREE

Вычисляет уровни pivot. В зависимости от расположения цен относительно этих уровней закрашивает гистограмму. Значения параметров: style - выбор типа отображения (Histogram, Line, Arrow) price - цена, мало влияет на конечный вид, но это можно настроить timeframe - выбор таймфрейма для расчета уровней. color over pivot line - цвет всего что выше уровня pivot color under pivot line - цвет всего что ниже уровня pivot pivot line intersection color - цвет, когда тело свечи пересекает центральную ли
FREE

This indicator show color of trend. And combined with the average line, but be used on the hightest price and the lowest of the 26 period. The target entry at the level and the point of the route between 2 line for entry and exit position This is a first version, many problems is not supported and fine. Expected a contected from your friends To continue to follow the good products
FREE

Critical Trading, Omni-Channel This indicator lets you create a unique channel from a base type and a range type. Channels are great for spotting over-extensions or the start of new trends. With an ever changing market it is important to create your own edge in the market that no one else has. Let Omni-Channel add to your unique trading strategy. Please contact [email protected] for more info or advice on adding any other functionality.
FREE

Times and Sales Pro: Улучшите свои операции с помощью дисбаланса в потоке сделок Возможности на малых колебаниях цены
Times and Sales Pro — это важный инструмент для аналитиков, работающих с потоком ордеров через Times and Trades . Идеально подходит для скальперов, он разработан для тех, кто стремится извлекать выгоду из небольших колебаний цены с высокой точностью. С его помощью можно определить дисбаланс в сделках, предоставляя ценные сигналы для быстрых входов и выходов. ВАЖНО: До

Imbalance DOM Pro: Повышайте свою торговлю с помощью дисбаланса в книге ордеров У ВАС ЕСТЬ ДОСТУП К КНИГЕ ОРДЕРОВ НА MT5? ХОТИТЕ ПОДНЯТЬ СВОЮ ТОРГОВЛЮ НА НОВЫЙ УРОВЕНЬ? Если вы трейдер, который использует поток ордеров для принятия решений, Imbalance DOM Pro может преобразовать ваш анализ. Этот инструмент специально разработан для скальперов и краткосрочных трейдеров, он выявляет дисбалансы в книге ордеров, открывая ценные возможности для быстрых и точных сделок. Используйте возможности

Indicador usado para sabermos os pontos de suporte de resistência no gráfico.
Funciona em todos ativos e timeframes.
Acerte exatamente os pontos de entradas e saídas das suas operações. SEE OUR RESULTS ON INSTAGRAM: https://www.instagram.com/diogo.cansi/ TELEGRAM GROUP = https://t.me/robosdsc More information by email [email protected] or by Whatsapp 55-991372299
FREE
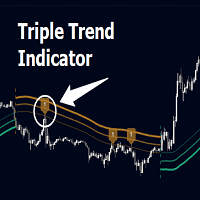
Triple Trend Indicator is a versatile trend-following tool designed to help traders identify trend strength and potential pullback levels using a three-band system. Each band represents a varying degree of price deviation from the mean, providing progressively stronger trend signals.
Key Features:
Three Adaptive Bands:
The indicator dynamically calculates three bands (1, 2, and 3) based on moving averages (SMA, EMA, WMA) and ATR multipliers.
Bands are positioned below the price in a

Switch symbols and timeframe by arrow buttons 1. You can switch multiple symbols of one or all charts. 2. You can set list of symbols to switch between them or get them from Market Watch. 3. You can change timeframe of one or all charts. List of timeframes here [M1, M5, M15, M30, H1, H4, D1, W1, MN1]. Switch symbol of all charts: indicator check current symbol of the chart to get index of it in list and change for next or previous. Key functions: - Right arrow key: switch to next symbol. - Left
FREE
Aydmaxx Trade Tracker Описание: Aydmaxx Trade Tracker – это мощный и удобный инструмент для трейдеров, который позволяет отслеживать текущую прибыль или убыток по каждой сделке в режиме реального времени. Индикатор выводит на экран информацию о текущей прибыли, помогая трейдерам быстро оценивать результаты своих торговых операций. Основные функции: Отображение текущей прибыли или убытка по всем открытым позициям в реальном времени. Настройка угла экрана для отображения информации (правый нижний
FREE
# Power Assisted Trend Following Indicator
## Overview
The PowerIndicator is an implementation of the "Power Assisted Trend Following" methodology developed by Dr. Andreas A. Aigner and Walter Schrabmair. This indicator builds upon and improves J. Welles Wilder's trend following concepts by applying principles from signal analysis to financial markets.
The core insight of this indicator is that successful trend following requires price movements to exceed a certain threshold (typically a mul
FREE

Realized Volatility Indicator Description The Realized Volatility Indicator measures the actual volatility observed in the market over a specified period.
Unlike implied volatility (which is based on options pricing), realized volatility is based directly on historical price movements, offering a pure and objective view of market turbulence. This indicator can be used to: Assess market conditions, Optimize risk management, Fine-tune trading strategies based on volatility behavior. Key Features
FREE

Corretora recomendada para usar esse indicador: https://tinyurl.com/5ftaha7c Indicador que pinta o candle de amarelo em pontos de muita agressão no mercado. Sempre que o mercado for se movimentar o candle irá ficar amarelo. Valido para todos ativos e todos timeframes. SEE OUR RESULTS ON INSTAGRAM: https://www.instagram.com/diogo.cansi/ TELEGRAM GROUP = https://t.me/robosdsc More information by email [email protected] or by Whatsapp 55-991372299
FREE

Simple candle countdown - never again miss how much time is left to open a new bar!
This indicator doesn't plot any line on the chart - it uses only objects and calculates the time left to open a new bar.
You can set custom colors for the panel background and border and for the text color. Simple as that, the indicator is ready to use.
If you find any bugs, feel free to contact me.
FREE

This spread indicator displays the actual spread of each candle. It highlights the maximum spread and the minimum spread of the chosen symbol. This indicator is very helpful to see in real time the spread evolution helping to avoid taking a trade when the spread is too high.
Inputs:
Print value in Points: if true displays the spread as a whole number
D isplay minimum and maximum spread of the past N days: select the number of days to consider the maximum and minimum spread
Automatically adj
FREE
Title : Ultimate Oscillator - Multi-Timeframe Momentum Indicator Description : Overview : The Ultimate Oscillator is a powerful and versatile technical analysis tool developed by renowned trader Larry Williams. This indicator is specially designed to capture market momentum across three different timeframes, providing a comprehensive view of the market's dynamics. Unlike traditional oscillators, which are confined to a single timeframe, the Ultimate Oscillator integrates short-term, medium-term,
FREE

Wolf Countdown helps you not to waste the right amount of time, it gives you back the time remaining until the candle closes.
How to use: Download and install the Wolf Countdown Indicator on your MetaTrader 5. Apply the indicator to your favorite chart.
this works on any timeframe...
Thanks to this indicator you will never miss the right moment to enter your trades.
FREE

Пользовательский индикатор Bollinger Bands Height - высота полос Bollinger Bands.
Показывает текущее состояние индикатора Bollinger Bands: полосы удаляются друг от друга или полосы начинают сближаться.
Сжатие - сближение полос, означает, что текущий движение рынка ослабевает и указывает на скорое начало нового сильного движения.
Значит нужно искать удачный момент для входа в позицию, так как можно ожидать резкое изменение цены.
Наиболее эффективен в работе с другими трендовыми индикаторами.
FREE

Revolutionize Your Trading Journey with the Ultimate Trend Analyzer: Trending View Indicator!
Experience seamless trading precision with the Trending View, a cutting-edge solution designed to elevate your trading on MT5. Powered by advanced logic and packed with over many premium features, this tool is a game-changer for traders seeking accuracy and efficiency.
Why Choose Trending View Indicator? · 100% Real-Time Accuracy: No delays, no repaints—always stay ahead of the

To get access to MT4 version please click here . This is the exact conversion from TradingView: "Hammer & ShootingStar Candle Detector" by "MoriFX". This is a light-load processing and non-repaint indicator. All input options are available. Buffers are available for processing in EAs. You can message in private chat for further changes you need. Thanks.
FREE

High and Low
The indicator marks bars with a simple trend definition“ each subsequent high above/below the previous one and each subsequent low above/below the previous one ”. Charles Dow
Formula:
Max – The current maximum Min – The current minimum MaxK – Maximum per period MinK – Minimum per period
Min>MinK & Max>=MaxK – Symbol on top Max<MaxK & Min<=MinK – The symbol on the bottom
Input parameter:
Number of bars in the calculated history Period for current timeframe The distance to th
FREE

SuperTrend Indicator Code Description This code defines a custom indicator for the MetaTrader 5 platform called SuperTrend. The indicator is based on the Average True Range (ATR) to identify upward and downward trends in the market. Code Sections: Indicator Information: Defines the indicator's name, copyright, link, version, etc. Configures the indicator to be displayed in a separate window and have 9 internal buffers and 2 visible plots. Sets the properties of the plots (name, drawing type, col
FREE

The Choppery notifier is an indicator that has been developed and tested for the purpose of alerting you that a candle is about to form, it takes away the trouble of having to play a guessing game as to when next a candle will form after a trend, therefore most of the time it eliminates the thought of having to predict which direction price will begin to move at. This indicator can be used in any timeframe, a notification will be sent out to you via email when price moves. you can start at a min
FREE

Устали подбирать настройки индикатора, теряя драгоценное время? Надоела неуверенность в их оптимальности? Пугает неизвестность в их прибыльности? Тогда индикатор ACI (автоматически калибруемый индикатор) предназначен именно, для вас. Запустив его, вы с легкостью устраните эти три проблемы одним простейшим действием – нажатием на единственную кнопку "Calibrate". А для того чтобы добиться высочайшей эффективности, достаточно выполнить лишь еще одно действие – передвинуть ползунок мощности до макси
FREE

ATR (Average True Range) Indicator — это мощный инструмент для измерения волатильности на финансовых рынках. Этот индикатор предоставляет точные данные о диапазоне движения цены, что помогает трейдерам более эффективно управлять рисками и принимать взвешенные торговые решения. Этот индикатор основан на популярном показателе ATR, который широко используется как профессионалами, так и начинающими трейдерами для анализа волатильности рынка. ATR Indicator позволяет вам отслеживать текущий диапазон д
FREE

What is this indicator? This indicator is for comparing multiple charts and verifying the chart pattern. Synchronize each chart position with the common vertical line. By changing the chart mode, you can also display the chart like a real trade.
How to set up
1. Scroll the chart of the target currency pair to the end in the past direction and download all the historical data of that currency pair. 2. Install this indicator in the main window of each chart. 3. Customize each parameter on the In

The BandsFill Indicator is a modified Bollinger Bands with a colored cloud. It has two adjustable parameters: Period Deviation The cloud is colored as follows: If the price crosses the upper band, the cloud is blue. If the price crosses the lower band, the cloud is pink. Thanks to this, the BandsFill Indicator provides traders with an easy opportunity to detect various features and patterns in price dynamics that are invisible to the naked eye. Based on this information, traders can predict
FREE
Индикатор отображает график произвольного сочетания торговых инструментов, описываемого введенной арифметической формулой. Область применения индикатора весьма обширна и ограничивается только вашей фантазией: Использование индикатора для арбитража. Подбор сочетаний инструментов, торгующихся в определенном канале, для применения к ним сеточных стратегий. Исследование динамики вашего портфеля активов. Использование индикатора: Добавьте индикатор на любой график. Символ графика не обязательно долже
FREE

Description:
The PTB_MoneyFlow indicator is designed to help traders identify key price levels and potential price movements using Fibonacci retracement levels, alongside tracking recent highs and lows over both short and long periods.
Key Features:
Highs and Lows Tracking:
The indicator calculates and plots the highest and lowest prices over two user-defined lookback periods:
Short Lookback Period: Default is 3 bars.
Long Lookback Period: Default is 144 bars.
These levels are plotted
FREE

Простой и понятный индикатор помогает определить вероятное направление тренда, его длительность и интенсивность, оценить возможный размах ценовых колебаний. Вы сможете сразу увидеть, в каком направлении движется цена, как долго длится тренд и насколько он силен. Все это делает индикатор легкой в использовании трендовой торговой системой для начинающих и опытных трейдеров.
Параметры Period - период усреднения для расчета индикатора. Deviation - величина отклонения индикатора. Lag - база (количес
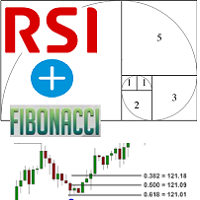
Fibonacci and RSI.
The indicator is a combination of the Fibonacci and RSI indicators.
Every time the price touches one of the fibonacci levels and the rsi condition is met, an audible alert and a text alert are generated.
Parameters number_of_candles : It is the number of candles that will be calculated. If you put 100, the indicator will give you the maximum and minimum of the last 100 candles.
sound_signal: If you want the indicator to notify you that the conditions are met using an aud

Ищете более эффективный способ идентификации поддержки, сопротивления и оценки трендов? Moving Average Band превращает скользящую среднюю в полосу, которая динамически адаптируется к рыночной волатильности, предлагая более реалистичный взгляд на движение цен. Что это? ️ Moving Average Band - это инструмент, представляющий скользящую среднюю как динамическую полосу. ️ Он автоматически регулирует ширину полосы в зависимости от рыночной волатильности. Что он мне дает? ️ Более реалистичный взгляд
FREE

I always wondered if I can have multiple time frame Moving average on same chart , it is not possible , now with my Indicator is possible , As you know Moving average is lagging not leading indicator , but how can I predict future levels of it ?
I came with this idea , I hope you will like it , I made a Mirror of Moving average , the other side of specific time will be shown in the other side of the chart where the price didnt reach yet , that will help you to know the levels you can start sell
FREE

NewTest https://backoffice.aurum.foundation/u/DHXP1U
Индикатор DuettoFXTompson создан для работы с двумя инструментами у которых высокий уровень корреляции, индикатор можно использовать для парного трейдинга по валютам, акциям, и др. финансовым инструментам. Индикатор показывает момент расхождения инструментов и сумму двух инструментов ( желтая линия), дополнительно рассчитывается параметр Среднего значения МА. Рекомендуемый таймфрейм для работы М5. Контакты для связи [email protected]
FREE

Это Бета версия моего трендового индикатора. Он построен на принципе схожем с нейросетями, и это расчет многомерного полинома. При установке его на график или при изменениях в параметрах индикатора, а также при переключении периода графика, происходит первоначальная инициализация индикатора. При инициализации не только пересчитывается весь период графика, но и происходит самообучение индикатора. Параметры индикатора: Sensitivity (100 max) - чувствительность к глобальным трендам, определяться ус
FREE

The RFOC Mini Chart was created to project a macro view of the market, which the option to select the timeframe of interest other than the main chart, it is possible to include 2 indicators: 1 - Moving average channel On the mini chart, the moving average will be created based on the prices of the selected time frame for the RFOC Mini Chart. The moving average period must be selected in the indicator settings pannel.
2 - Boillinger Band In the mini chart, a boillinger band will be created based
FREE

If you love this indicator, please leave a positive rating and comment, it will be a source of motivation to help me create more products <3 Key Takeaways Bulls Bears Eyes is another version of Laguerre RSI. Use Bull/Bear Power to calculate. One use of the Bulls Bears Eyes is to identify trends. This is done by looking for sustained periods when the indicator is above or below the 0.5 line. Also, a buy signal is generated when the Bulls Bears Eyes line crosses above the 0.15 level, while a s
FREE

This indicator is EXCLUSIVELY to be used on the Brazilian stock exchange "B3". It automatically calculates the yesterday's Settlement Price (Ajuste) of the Symbol "DOL". It uses a mathematical calculation over the ticks received from the borker server, it DOES NOT access external sources (websites, HTTP connections, etc) so it is safe and totally reliable! For practical purposes and to maintain the longevity of the indicator it was added in the Parameters the ability to control the Time Range in
FREE

Главное достоинство представленного индикатора - фильтрация сигналов на покупку и продажу в направлении рыночного импульса и ранжировании их по силе. Настройка с индикатора проста и интуитивно понятна. Все, что от вас требуется - реагировать только на сильные сигналы. Соблюдайте правила управления капиталом.
Описание индикатора Индикатор Color Stochastic with an analytical panel состоит из собственно самого индикатора стохастик и информационно-аналитической панели. Для индикатора имеются возмож
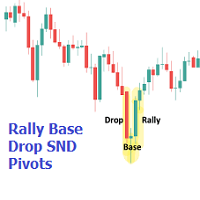
The Rally Base Drop SND Pivots indicator uses "Rally", "Base", and "Drop" Candles to determine pivot points at which supply and demand (SND) levels are drawn. (Figure 1) USAGE Figure 2 Rally, Base, and Drop (RBD) candles create a formula for seeing market structure through a fixed methodology. We are able to use this concept to point out pivot areas where Rallies and Drops directly meet.
The RBD SND Pivots are similar to traditionally identified "fractal" pivot points, with one key differ

A scalping indicator based on mathematical patterns, which on average gives signals with relatively small SL, and also occasionally helps to catch big moves in the markets (more information in the video)
This indicator has three main types of notifications: The first type warns of a possible/upcoming signal on the next bar The second type indicates the presence of a ready signal to enter the market/open a position The third type is for SL and TP levels - you will be notified every time price re

Dynamic Indicator --> YKL_DinDX Dynamic Indicator that creates a Band based on the distance from moving average specified by the user. The indicator considers the period entered by the user in order to calculate the average distance from moving average, creating an upper band and a lower band. This indicator is utilized by EA YKL_Scalper, version 2.0 or superior.
FREE

ToolBot Probabilistic Analysis - FREE An effective indicator for your negotiations
The toolbot indicator brings the calculation of candles and a probabilistic analysis so that you have more security on your own.
Also test our FREE tops and bottoms indicator: : https://www.mql5.com/pt/market/product/52385#description Also test our FREE (RSI, ATR, ADX, OBV) indicator: https://www.mql5.com/pt/market/product/53448#description
Try our EA ToolBot for free: https://www.mql5.com/market/prod
FREE

Smart Market Structure Simple is a powerful indicator that helps traders identify market structure based on the Smart Money Concept (SMC) . This indicator automatically detects Break of Structure (BOS), Change of Character (CHoCH), Fair Value Gaps (FVG), Order Blocks (OB), Liquidity Zones (LQZ), and key swing points Higher High (HH), Higher Low (HL), Lower High (LH), Lower Low (LL) . Main Objective: Assist traders in tracking institutional flow ( Smart Money ) and finding high-probability trade

"Moving Ratio Candle" is used to check the distance of a candle to a theoretical pressure point. Furthermore, we have two points of interest, the first for the mean and the second for the median. This indicator uses the shape of bars and the line that crosses the bar from left to right is based on the calculation of the closing price for both sides. The rest follows a more standard calculation. The same could be done as a line, but I want to know the behavior of this indicator in relation to the
FREE
The Percentage Average True Range (ATR) indicator measures market volatility by calculating the ATR of a selected asset and expressing it in one of three customizable formats: Percentage (%) relative to the current price, enabling easy comparison across assets with different price ranges. Basis Points (bps) , where 1 bps equals 0.01%. Real ATR values , representing the raw ATR in price terms. By normalizing ATR values using percentage or basis points, this indicator allows for direct comparison
FREE

Non-proprietary study of Joe Dinapoli used for overbought/oversold evaluation. Uses of Detrended Oscillator indicator Profit taking. Filter for market entry technics. Stop placement. Part of volatility breakout pattern. Determining major trend changes. Part of Dinapoli Stretch pattern. Inputs lnpPeriod: Perid of moving average Method: Calculation method ********************************************************************************* If you want to know market Overb
FREE
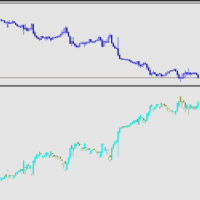
反转K线指标! 指标将主图的K线在副图中进行反转显示. 交易实用必备工具指标 波浪自动计算指标,通道趋势交易 完美的趋势-波浪自动计算通道计算 , MT4版本 完美的趋势-波浪自动计算通道计算 , MT5版本 本地跟单复制交易 Easy And Fast Copy , MT4版本 Easy And Fast Copy , MT5版本 本地跟单复制交易 模拟试用 Easy And Fast Copy , MT4 模拟账号运行 Easy And Fast Copy , MT5 模拟账号运行 The indicator of the attached figure shows that it is a mirror image of the candlestick chart of the main chart. The ordinate of the figure indicator is mirrored with the main image, and the coordinate value is a negative number.
For graphic reference on

The RFOC Symbol Background was created to display the name of the asset and the current timeframe in the background of the chart.
Displaying the name of the asset at the bottom of the chart is often used by traders who are designing the screen for spectators, making it easier to identify the asset and the timeframe during a class, for example.
It is available for the user to select the font size (small, medium or large) and select the color for better viewing according to the background color
FREE
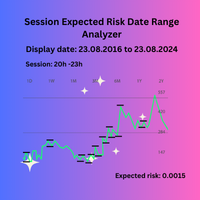
Session Expected Risk Date Range Analyzer: Analyzes price data across specified date ranges to provide detailed insights into financial risk and volatility, using each bar's price metrics for accurate risk assessment.
The Session Expected Risk Date Range Analyzer is a sophisticated tool designed to offer traders and analysts detailed insights into the expected financial risk across specific date ranges. Unlike traditional session-based analysis, this indicator focuses on calculating risk metr
FREE

Модифицированный и обновленный индикатор RSI. Пожалуйста используйте выводимые индикатором стрелки на графике для входа в сделки и для выхода из сделок. Индикатор предназначен для всех валютных пар и таймфреймов. Параметры: PeriodRSI - период индикатора;
OpenLevel - уровень для входа в сделки (диапазон 0-100);
CloseLevel - уровень для выхода из сделок (диапазон 0-100);
FlatMode - пожалуйста включите данный триггер в режиме флета (т.е. при отсутствии выраженных трендов).
FREE
MetaTrader Маркет - лучшее место для продажи торговых роботов и технических индикаторов.
Вам необходимо только написать востребованную программу для платформы MetaTrader, красиво оформить и добавить хорошее описание. Мы поможем вам опубликовать продукт в сервисе Маркет, где его могут купить миллионы пользователей MetaTrader. Так что занимайтесь только непосредственно своим делом - пишите программы для автотрейдинга.
Вы упускаете торговые возможности:
- Бесплатные приложения для трейдинга
- 8 000+ сигналов для копирования
- Экономические новости для анализа финансовых рынков
Регистрация
Вход
Если у вас нет учетной записи, зарегистрируйтесь
Для авторизации и пользования сайтом MQL5.com необходимо разрешить использование файлов Сookie.
Пожалуйста, включите в вашем браузере данную настройку, иначе вы не сможете авторизоваться.