Смотри обучающее видео по маркету на YouTube
Как купить торгового робота или индикатор
Запусти робота на
виртуальном хостинге
виртуальном хостинге
Протестируй индикатор/робота перед покупкой
Хочешь зарабатывать в Маркете?
Как подать продукт, чтобы его покупали
Технические индикаторы для MetaTrader 5 - 30
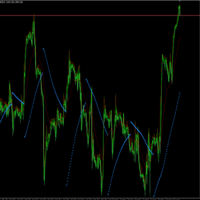
La idea de este indicador es la siguiente: reemplazar los precios High, Low del indicador SAR por los valores del indicador Moving Average. Al final tendremos la siguiente imagen:
Es decir, el indicador SAR cambia su dirección después de tocar el indicador Moving Average.
Parámetros de entrada SAR: Step - parámetro "Step" del indicador SAR; SAR: Maximum - parámetro "Maximum" del indicador SAR; MA: Period - parámetro "período de promediación" del indicador MA; MA: Shift - parámetro "des
FREE

The indicator shows when there are overpricing and divergences over a normalized MACD Plus, it displays signals with configurable alerts, self-regulating dynamic overprice levels, and a simple setup and interface. This indicator automatically calculates markup ranges. MACDmaxmin is an indicator based on the MACD oscillator that effectively identifies trend changes in price, as it is a momentum indicator that captures the trend and shows the relationship between two moving averages of the price.
FREE

Are you having trouble with too many events in the economic calendar? This reduces to the minimum number you need. You can filter by country code importance any key words and you can receive alerts before the set time of the event. ++++++++++++++ If country code is blank, display available code on the expert tab. You need to turn off the automatic calendar update setting in MT5. Any sound file of .wav format in Sounds directory. The length of keyword characters is limited by MT5.
FREE

Volume Cross Over is an indicator that measure positive and negative volume flow in a financial instrument, such as a stock, commodity, or index. It is base on the idea of On-Balance Volume developed by Joseph Granville. However instead of trending lines, this indicator shows volume cross over. When the closing price of an asset is higher than the previous closing price, then the Bull volume is greater than zero and Bear volume is negative. It suggests that buying volume is dominating, and
FREE

Wizard Poverty Sanitizer is a moving average based indicator, using three EMA'S being 2OO EMA which is the slow EMA, the 21 EMA which is the median and the 10 EMA which is the fast. When the median and the fast EMA cross a signal is given, when the fast EMA goes above the Median EMA a buying signal is given and when the fast cross below the median a selling is given. Note that you can change the moving averages to you own choices of moving averages, allowing you to set your own MA strategy. an
FREE

Индикатор Slope Channel для MetaTrader
Ищете инструмент для анализа рыночных тенденций, который подходит для любого стиля торговли? Slope Channel – ваш надежный помощник в определении направленного движения цены и ключевых уровней рынка! Что такое Slope Channel? Slope Channel – это инновационный индикатор, который строит наклонный канал на графике, автоматически рассчитывая его параметры на основе локальных экстремумов. Этот инструмент выделяет оптимальный вариант канала, позволяя вам быстр
FREE

ALPS – мультитаймфреймный индикатор тренда и импульса, позволяющий вашей прибыли расти . Индикатор объединяет Gator Oscillator, ADX и RSI на нескольких таймфреймах. Вы можете уверенно торговать на коротком таймфрейме, при этом отслеживая тренд и импульс на более крупном. Вы можете включать/отключать любой таймфрейм в любое время, чтобы не захламлять график ненужными данными. Бары разных цветов указывают на медленный, средний или сильный тренд на основе ADX. На линии импульса отмечаются состояния
FREE
Индикатор Custom ATR для торговли по горизонтальным уровням
Индикатор Custom ATR – это мощный инструмент, предназначенный для трейдеров, использующих горизонтальные уровни и понимающих важность среднего истинного диапазона (ATR) при принятии торговых решений. Этот индикатор вычисляет ATR на основе настраиваемого количества баров, фильтрует аномальные бары (слишком большие или слишком маленькие) и предоставляет наглядное отображение ключевых данных, включая значения ATR, количество пунктов для с
FREE

The currency strength momentum has a lot of similarities with currency strength meter presented in the previous page, but the difference are much more pronounced. You can try putting both in the same chart and see the difference in results. Currency strength momentum measures strength of a currency based on (you guess it) it's momentum relative to other currencies, while currency strength meter measures the strength of a currency based on pips it has moved in a certain direction.
FREE

Trading Signal for MetaTrader5 PC platform
The Signal is based on the Investologic EA trend strategy . Trend following indicator’s and oscillator’s, can work with any symbol or market in MT5 platform FOREX, GOLD, OIL, STOCKS, INDEXES, NASDAQ SPX500 The strategy
the strategy uses multi time frame combination of indicators and moving averages to find the best entry point wen the fast MA slow MA Crossover And Stochastic , RSI , Average Directional Movement Index ,combined together to
FREE

The Netsrac Correlation Trade Indicator (NCTI) was created to trade correlations between different assets. NCTI offers five different strategies to do this. Five different correlation trading strategies with two or three assets Fast access your assets with one click via asset buttons Your profit/loss at a glance Configurable alerts via screen or mobile You can use the indicator with every timeframe. Higher timeframes give fewer but better signals. If you have some questions or suggestions - plea
FREE

The Indicator indicator draws 2 clouds based on Envelopes indicator values. The upper cloud is formed by the upper lines values and the lower cloud by the lowers lines values. The indicator allows to change the Envelopes parameters and the clouds colors the period of the base line and the deviations of each Envelopes instance. The indicator holds 5 buffer index as follow: [0] - Outer values of the upper cloud [1] - Inner values of the upper cloud [2] - Base/Center line values [3] - Inner valu
FREE

Candle com coloração de Volume Price Analysis (VPA) segundo as definições da Anna Coulling, é possível configurar períodos de climax e rising, fator de extreme e fator de rising.
Pode-se usar volume real ou volume de ticks. O VPA considera a variação de preço por volume do período, indicando se um movimento está recebendo ignição, está em seu climax ou se já não existe mais interesse.
FREE

Definition : TPO is a Time Price Opportunity. Instead of using bars or candles with an Open, High, Low, and Close price, each "bar" in a Market Profile is represented by horizontal bars against the price It is called Market Profile terminology.
In other words time-price-opportunity (TPO) profiles are histograms of how much time was spent at each price within the span of the profile.
By using a TPO chart, you are able to analyze the amount of trading activity, based on time, for each price level

The DD_Profit_Monitor MT5 indicator is a trading tool developed by the Dagangduit Core Team . This indicator is designed to monitor profits in real-time with the following key features: All Time Profit : Displays the total profit earned since the beginning of the trading account's usage. This feature helps traders see the overall performance of their trading activities. Daily Profit : Displays daily profits, allowing traders to monitor their daily performance more specifically. Key Features: Al
FREE

У каждого индикатора есть свои достоинства и недостатки. Трендовые показывают хорошие сигналы во время тренда, но запаздывают во время флэта. Флэтовые прекрасно себя чувствуют во флэте, но при наступлении тренда сразу же умирают. Все это не было бы проблемой, если было бы просто предсказать, когда тренд сменится флэтом, а флэт сменится трендом, но на практике это крайне серьезная задача. Что если разработать такой алгоритм, который сможет в индикаторе устранить недостатки и усилить его достоинст

The 9-5 Count is designed to track a very powerful cycle that runs through all freely traded markets. This is not a time cycle but a price cycle. The time spent between two points is not as important as the price traveled between them. The 9-5 Count is called that because one complete upward cycle consists of measurement of 9 units plus 5 units of cycle time. This tool takes into account price and pattern together, so it’s more than just a simple cycle. The 9-5 theory classifies market movemen

Hello Seasonal Traders! The seasonality trading strategy works because the smart money is doing the same thing every single year more often than not. The month of the year or the day of the week and the time of the day can call the shots in any market. The seasonal cycle is another useful tool in your trading arsenal. I'm not saying to trade solely off of seasonality and forget anything else. I'm only giving you another trading tool that you can incorporate into your own trading strategy to ga

This MT5 version indicator is a unique, high quality and affordable trading tool. The calculation is made according to the author's formula for the beginning of a possible trend. MT4 version is here https://www.mql5.com/ru/market/product/98041 An accurate MT5 indicator that gives signals to enter trades without redrawing!
Ideal trade entry points for currencies, cryptocurrencies, metals, stocks, indices! The indicator builds buy/sell arrows and generates an alert. Use the standart B

The Danko Trend Color indicator is actually a candle coloring to bring practicality, ease and information to your charts.
Danko Trend Color combines PRICE AND VOLUME indicators to define the prevailing trend, so the colors are: Blue (indicates an uptrend)
Orange (indicates a downtrend)
White (indicates undefined trend)
I don't like to promise anything with my indicators, I ask you to download, test it for free (for use in backtesting) and see if the indicator can, in some way, help your oper

Are you ready to elevate your trading game and experience unparalleled accuracy in market predictions? The Scalping Range Grid Indicator is not just a tool—it’s your main weapon for pinpointing the next move in the financial markets. Designed for traders who demand the best, this cutting-edge indicator harnesses the power of grid-based analysis to scan future price transit zones with unmatched precision. Imagine having the foresight to know where the price is most likely to pause, consolidate,

Fast Trade Detector (FTD) - Самый правдивый индикатор, который показывает истинное
настроение Большого Игрока.
На бирже есть Игрок, у которого есть всё для того, чтобы быть в первых рядах в книге торговых
приказов (биржевом стакане). Эти сделки как индикатор рыночного настроения сильного игрока.
Вы поймёте, что всё не совсем так, как представляли раньше. Вам откроются алгоритмы и стратегии
крупного участника рынка. Исполнение индикатора в виде гистограммы в подвале графика. Гистограмма п

Описание
Range Detector - индикатор, который идентифицирует на рынке ренджи (периоды движения цены в горизонтальном канале), и отображает их наличие на ценовом графике.
Рекомендации
Вы можете использовать данный индикатор для определения флета и соответственно для определения направления открытия позиции или закрытия противоположной позиции.
Параметры
Maximum History Bars - максимальное количество баров истории для расчета индикатора. Average True Range Period - период индикатора ATR

"TPA Sessions" indicator is a very important tool to complement "TPA True Price Action" indicator . Did you ever wonder, why many times the price on your chart suddently turns on a position you can't explain? A position, where apparently no support or resistance level, or a pivot point, or a fibonacci level is to identify? Attention!!! The first run of the TPA Session indicator must be in the open market for the lines to be drawn correctly.
Please visit our blog to study actual trades with
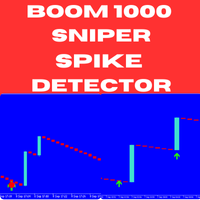
Boom and Crash Sniper Spike Detector - Boom 1000 The Boom and Crash Sniper Spike Detector is the ultimate tool for spike trading on Boom 1000, offering clear and reliable signals to help you capture high-probability trades. This advanced indicator is designed to enhance your trading strategy by simplifying spike detection and maximizing your profits. Key Features: Multi-Timeframe Compatibility : The indicator can be used on M1, M5, M15, M30, and H1 timeframes, but it works best on the M1 timefra
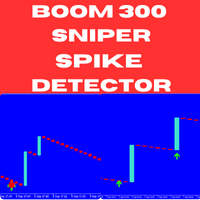
Introducing the Boom 300 Sniper Spike Detector – a powerful, non-repainting indicator specifically engineered to help you master spike trading in the Boom 300 market. Whether you're a seasoned trader or new to the game, this tool offers precise and timely signals, allowing you to catch spikes with confidence and improve your overall trading performance. Key Features: Non-Repainting Signals : Ensures consistent and accurate signals that do not repaint, providing you with reliable data to make con
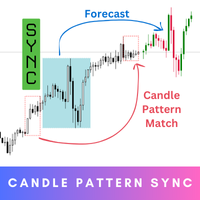
Candle Pattern Sync is your ultimate tool for precision and insight in trading. Step into the future of trading with this innovative indicator that’s designed to help you understand market behavior by analyzing historical patterns and giving you an idea of what might come next. While the forecasts provide valuable probabilities based on history, they’re not guarantees – think of them as a powerful guide to inform your decisions, not a definitive answer. MT4 Version - https://www.mql5.com/en/m

Бесплатная версия. Работает только на EURUSD Вы хотите всегда знать, куда пойдет цена, всего лишь взглянув на нее? Вы устали постоянно переключаться между таймфреймами, чтобы понять это направление? Возможно, этот индикатор - как раз то, что вы искали. Trend Signal Multitimeframe показывает то, является ли текущая цена выше или ниже цены N свечей назад на разных таймфреймах. Он всегда отображает количество пипсов, на которое текущая цена выше или ниже цены N свечей назад. Число N можно настроит
FREE
Индикатор Order Flow Balance - это мощный инструмент для чтения ленты (Time & Sales). Он помогает анализировать поток ордеров на рынке, определять движения игроков, рыночный дисбаланс, возможные точки разворота и многое другое! Индикатор работает на MOEX, BM&FBOVESPA, CME и т. Д. Есть 5 различных типа индикатора Cumulative Delta: Также известен как индикатор кумулятивного объема Cumulative Volume Delta, это продвинутый способ анализа объемов, позволяющий трейдерам наблюдать дневную разницу между
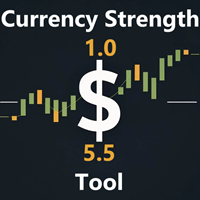
" Currency Strength Tool " — это простой и удобный индикатор, разработанный для анализа силы восьми основных валют на основе дневных изменений цен валютных пар. Он отображает информацию в компактном виде на графике в виде трёх строк, предоставляя трейдерам данные о текущей рыночной динамике. Индикатор служит инструментом для анализа, помогая принимать обоснованные торговые решения.
Выглядит следующим образом: -7.3% 0.5% 0.2% 6.4% 1.2% 3.2% 4.1% 0.4% (дневное) USD EUR GBP JP
FREE
The indicator displays support and resistance levels based on fibonacci level in multi period Creates lines indicating the latest support and resistance levels.
These lines are updated whenever there is a change in support or resistance levels. Labels are removed if the corresponding conditions are not met.
the period is availble in setting and level fibonacci
FREE

FLAT ADVANCED TREND V1.5 – Identify Trends with Professional Precision
Flat Advanced Trend is your ultimate solution. It combines the power of ADX, ATR and RSI into a visually intuitive, easy‑to‑use tool designed for serious traders. Key Features: Smart Trend Detection – Filters out market noise using ADX + +DI/–DI and displays only the most reliable signals. Advanced Filters – Includes ATR for volatility and RSI for momentum (fully customizable). Real‑Time Info Panel – Shows current trend, stre
FREE

The Bolliger Bands On-Off let you control the indicator using the keyboard or a button . You can choose if you want the indicator always shown or always hided while switching among different time frames or financial instruments . ---> This indicator is part of Combo Indicator OnOff
The Bollinger Bands identify the degree of real-time volatility for a financial instruments . A lower amplitude corresponds to a low volatility, conversely a greater bandwidth corresponds to high volatility.
FREE

516/5000 Average volume indicator to calculate the average volume for a given period. Useful as a filter to measure the strength of a trend, or false breaks in support or resistance.
It does not give a signal to buy or sell, it only acts as a filter to avoid entering into transactions with a drop in volume, or below-average volume, which may indicate disinterest in trading at the price level.
It has only the parameters of period, method of calculating the average and type of volume.
It h
FREE

ЭТОТ ИНДИКАТОР ЯВЛЯЕТСЯ ЧАСТЬЮ EA: HIPERCUBE PRO GALE BTC Код скидки 20% на Darwinex Zero: DWZ2328770MGM_20
Представляем новую версию индикатора Donchian
Мы рады представить новую версию индикатора Donchian , разработанную с использованием передовых улучшений и повышенной точности. Теперь полностью адаптирован для HiperCube Pro Gale , этот обновленный инструмент предлагает бесшовный опыт, адаптированный для более эффективной торговли.
Почему эта версия — настоящий прорыв:
Адаптирован для
FREE

В индикаторе SM Trend Cloud для расчета и отрисовки использовано два буфера. Одним из основных достоинств данного инструмента является простота, при этом его сигналы могут быть достаточно точны. Но, опять же, перед нами трендовый индикатор, а потому ложные сигналы он будет генерировать преимущественно в условиях консолидации. При этом не советую использовать индикатор в самостоятельном виде, тут без дополнительных фильтров не обойтись. В качестве дополнительно сигнала предлагаю использовать инди
FREE

Hey guys.
This indicator will show you, in the volume histogram, if the candle was a Doji, a bullish candle, or a bearish candle.
The construction of this indicator was requested by a trader who uses other indicators from my catalog, and I decided to release it free to help traders who think that the indicator can contribute to their operations.
The parameters are:
Volume Type: Real Volume or Tick Volume. Color if the candle is bearish: select the color. Color if the candle is high: select
FREE

The DD_PL Running MT5 indicator is a trading tool developed by the Dagangduit Core Team . This indicator is designed to display real-time running profit and loss (P/L), providing essential information about your trading account's performance. Key Features: Real-Time P/L Monitoring : Calculates and displays profit and loss in real-time. Visual Indicator : Uses labels and colors to provide a visual representation of profit and loss status. Customizable Display : Allows adjustment of text color, b
FREE

KF-BB
Professional Bollinger Bands with Alert.
Bollinger bands available in the market are mostly drawn based on simple moving average . KF-BB is the first bollinger bands that can draw the center line using all the usual methods simple , exponential, etc. A very professional indicator, it does not end here other advantages of this indicator include creating an alarm on the desktop and the mobile phone When the candlesticks hit one of the center lines or the upper and lower bands Download Demo V
FREE

MT5 Alert Indicator Please add Ema moving averages 60/100/200 & Rsi period 10 levels 30/70 to your chart. This indicator alert on a trend reversal strategy were - ema 60 > 100&200 - ema 100 < 200 And the Rsi is below 30 FOR BUY SIGNAL
Use this strategy in confluence with a larger timeframe trend in the same direction. This strategy identifies great entry opportunities to enter an early trend.
FREE

Media Band é um indicador que projeta 8 bandas paralelas a uma media movel de referencia. Podendo auxiliar na visualização da volatilidade do mercado financeiro. Este indicador foi inspirado na necessidade de avaliar melhor uma boa oportunidade de compra e venda dos ativos de acordo com o "seu" operacional. Não pode ser utilizado como recomendação e sim a fins de estudos do Mercado Financeiro.
FREE

The Zero-Lag MA Trend Levels indicator combines a Zero-Lag Moving Average (ZLMA) with a standard Exponential Moving Average (EMA) to provide a dynamic view of the market trend. This indicator automatically plots the EMA and ZLMA lines on the chart. The colors of the lines represent the market trend.
With EMA: ++ green (uptrend) when EMA > zlma ++ red (downtrend) when EMA < zlma With ZLMA: ++ green (uptrend) when the line is trending up ++ red (downtrend) when the line is trending down
When th

The VIX Fix is a volatility indicator developed by renowned trader Larry Williams. It's designed to measure volatility in assets that don't have options or futures, such as individual stocks and forex markets. Essentially, it acts as a synthetic VIX (Volatility Index) for any asset , providing a gauge of market uncertainty. This modified version of William's indicator helps you to find market bottoms and market tops. It comes with 2 styles: Stochastic and histogram style. Please see screenshots

Description: First of all Its worth emphasizing here that the Trend Breakout Catcher is Non-Repainting, Non-Redrawing and Non-Lagging Indicator, Which makes it ideal from both manual and robot trading. The Trend Breakout Catcher Indicator employs a sophisticated algorithm designed to predict trends early and generate timely Buy and Sell signals at the onset of a breakout. Utilizing a smart calculation based on numerous elements, the indicator forms a robust and redundant system to detec

If you have been anywhere near Forex forums or social media lately, you have no doubt been hearing people talk about Smart Money Concepts (SMC) trading. You may be wondering what SMC is, and whether it deserves all the hype. In this post, we will introduce Smart Money Concepts trading to you so you can make an informed decision about whether or not to give this strategy a try in your own trading. What is SMC Forex trading? Smart Money Concepts (SMC) is one of many forex trading methods. SMC

Description: The Range Breakout Catcher Indicator is a powerful tool known for its non-repainting, non-redrawing, and non-lagging capabilities, making it suitable for both manual and robot trading. This indicator utilizes a smart algorithm to calculate ranges and generate early signals for Buy and Sell positions at the breakout of these ranges, facilitating the capture of trends during ranging consolidations. The range calculation involves a comprehensive system based on various elements, prov

For those who feel that regular RSI is too fast and too noisy to be used on regular trades or in EAs and want to have an alternative to meter the Momentum of the Price, here is a solution presented on the great article of the Technical Analysis of Stocks & Commodities magazine (April, 2015), by Vitali Apirine, called: Slow Relative Strenght Index . Its reading is almost the same as the regular RSI, but its levels of Overbought and Oversold are 80 and 20 instead. SRSI is very powerful to show div
FREE

Представляю индикатор для профессионалов. Prof MACD по виду и своим функциям сильно напоминает классический MACD , но строится на абсолютно иных алгоритмах (к примеру, у него только один период усреднения) и более робастный, особенно на малых таймфреймах, поскольку фильтрует случайные блуждания цены. Классический индикатор MACD ( Moving Average Convergence/Divergence ) — это следующий за тенденцией индикатор, основанный на соотношении между двумя скользящими средними, а именно EMA

Индикатор отображает матрицу индикаторов по нескольким таймфреймам с общей суммой и отключаемыми оповещениями. В матрицу можно добавить пользовательские индикаторы с возможностью гибкой настройки. Порог оповещений можно настроить таким образом, чтобы указывался процент согласованности индикаторов для срабатывания оповещения. Оповещения можно включить/отключить при помощи полей выбора на графике. Также можно настроить отправку уведомлений на мобильное устройство или электронную почту, в дополнени

Автоматическое построение уровней поддержки и сопротивления ПЛЮС разрывы между свечами на вашем графике, чтобы вы могли видеть, куда цена, скорее всего, направится дальше и/или потенциально может развернуться.
Этот индикатор разработан для использования в рамках методики позиционной торговли, которая преподается на моем сайте (The Market Structure Trader), и отображает ключевую информацию для таргетинга и потенциальных входов. MT4 Version: https://www.mql5.com/en/market/product/97246/ В индик

Индикатор сканирует до 15 торговых инструментов и до 21 таймфрейма на наличие высоковероятностных моделей паттерна Двойная вершина/дно с ложными прорывами . Что определяет этот индикатор: Этот индикатор находит особую форму таких паттернов, так называемые двойных вершин и нижних частей, так называемый Двойная вершина/дно с ложными прорывами . Паттерн "Двойная вершина с ложными прорывами" формируется, когда максимальная цена правого плеча выше левого плеча. Паттерн "Двойное дно с ложными прорывам
FREE

Probability emerges to record higher prices when MACD breaks out oscillator historical resistance level. It's strongly encouraged to confirm price breakout with oscillator breakout since they have comparable effects to price breaking support and resistance levels; surely, short trades will have the same perception. As advantage, many times oscillator breakout precedes price breakout as early alert to upcoming event as illustrated by 2nd & 3rd screenshot. Furthermore, divergence is confirmed
FREE

The utility draws pivot levels for the selected timefram in classic method. Pivot = (high + close + low) / 3 R1 = ( 2 * Pivot) - low S1 = ( 2 * Pivot) - high R2 = Pivot + ( high - low ) R3 = high + ( 2 * (Pivot - low)) S2 = Pivot - (high - low) S3 = low - ( 2 * (high - Pivot)) you can change the timeframe, colors and fontsize. also you can change the text for the levels.
Have fun and give feedback...
FREE

Indicador MAPS Indicador é um oscilador que faz o plot da Curva de Retorno de uma regressão de segundo grau para os preços de fechamento do ativo do gráfico. A Curva de Retorno é a linha central do indicador MAPS e representa a região de equilíbrio do preço entre vendedores e compradores. Os plots do indicador são: Linha central - C0 - cor da mesma varia de acordo com a tendência do mercado, sendo verde para tendência de alta e vermelho para baixa; Linhas superiores: S1, S2, S3 e S4, sendo que a
FREE

Introducing The Day Trader System: Your Shortcut to Day Trading Success! Are you a day trader seeking simplicity without compromising profitability? Look no further! We present The Day Trader System – your go-to solution for identifying lucrative opportunities in the fast-paced world of Forex. Simple Yet Powerful: The Day Trader System is a straightforward yet highly effective indicator designed exclusively for day traders. Say goodbye to complexity and hello to a system that simplifies
FREE
Special offer : ALL TOOLS , just $35 each! New tools will be $30 for the first week or the first 3 purchases ! Trading Tools Channel on MQL5 : Join my MQL5 channel to update the latest news from me Индикатор Линейного Регрессионного Канала – мощный инструмент технического анализа, помогающий трейдерам улавливать ценовые тренды и возможные точки разворота. Расчет и отображение каналов линейной регрессии, полос и прогнозов дают углубленное понимание рыночной динамики. Этот индикатор

La **Media Móvil de Tercera Generación (TGMMA)** es una versión avanzada del indicador estándar de **Media Móvil (MA)**. Fue descrita por primera vez por Manfred G. Dürschner en su artículo "Gleitende Durchschnitte 3.0" (en alemán). Aquí están las características clave de la TGMMA:
1. **Reducción del Retraso**: - A diferencia de las MAs tradicionales, la TGMMA reduce significativamente el retraso. Se adapta más rápidamente a los cambios de precios, lo que la hace ideal para traders que busc
FREE

El indicador "Time Broker Deriv" está diseñado específicamente para su uso en los índices sintéticos Boom y Crash, así como en otros pares de trading disponibles en la plataforma MT5. Su función principal es proporcionar la hora del broker en comparación con nuestra hora local. Es importante destacar que el indicador "Time Broker Deriv" solo muestra la hora del broker.
FREE

Price Range MT5 - это система, которая распознаёт ценовые диапазоны и уровни, и понимает, когда заканчивается диапазон, и начинается тренд. Она показывает направление нового тренда с высокой степенью вероятности, а также отсылает вам пуш-уведомления, чтобы вы могли вовремя принять решение. Вот так торгует советник, базирующийся на Price Range MT5: https://www.mql5.com/ru/signals/2278827 В качестве бонуса, вы можете получить бесплатную копию этого торгового робота после покупки индикатора, есл
BBTrend is a powerful trend analysis tool designed to provide a clear overview of market volatility and trends at a glance.
This indicator calculates the difference between two Bollinger Bands of different periods,
visually indicating the strength of upward or downward trends to traders. Clear Trend Visualization: The upward trend is represented in green, and the downward trend in red,
allowing traders to intuitively grasp the direction and strength of the trend. Standardized Percentage Disp
FREE

Индикатор ADR ST Patterns Strategy является модификацией классического индикатора ADR . Этот простой индикатор соответствует параметрам ST Patterns Strategy ( https://stpatterns.com/ ) . Structural Target Patterns по своей сути и есть сам рынок, последовательно разделенный на составляющие. Для формирования ST Patterns не нужны линии тренда, геометрические пропорции самой модели, объем торгов или открытый рыночный интерес. Они легко распознаются и строятся только на основании факта пробития фракт
FREE

Take control of your trading workspace with the Switcher Dashboard – a smart and efficient tool that auto-detects all open charts (Forex, VIX, stocks) and turns them into neatly organized, color-coded buttons for instant chart switching. Key Features: One-click chart navigation – Seamlessly switch between charts with a single click. Trend visualization – Instantly identify bullish or bearish conditions with clear color cues. Flexible layout options – Choose from 4 customizable views (left, righ
FREE
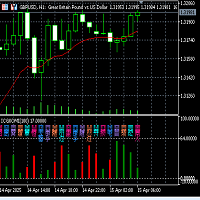
Fuxi Guaxiang Dual-color Oscillation Indicator Function and Usage Instructions (V2.1)
Fuxi Guaxiang Dual-color Oscillation Indicator Instructions: (1) This Guaxiang change indicator is based on the Yin-Yang transformation thought of the "Book of Changes" philosophy in ancient Chinese culture, integrating the results of the long-short game in each candlestick K-line period of the financial trading K-line chart, using China's oldest predictive coding method, in the form of the 64 Guaxiang of the
FREE

the AK CAP toolbox free to use;
it includes the same indicators we use for our daily trading and we think the simpler the better. Lightweight indicator for use on all timeframes. that includes VWAP with vwap value indicator on top right. 3 EMA: FAST, MEDIUM, SLOW the candle timer to show how much time left in a candle.
colors and positions are fully customizable.
enjoy
FREE

ToolBot Advisor Indicator (RSI, ATR, ADX, OBV) FREE An effective indicator for your negotiations
The toolbot indicator and advisor brings leading (OBV) and lagging (RSI, ATR, ADX) indicators so that you have more security in your negotiations. In addition, it informs you of possible up and down trends as well as providing you with incredible advisors who will give you information about trading opportunities.
With this indicator you will have more security and speed in your decision making of
FREE

Probability emerges to record higher prices when RVi breaks out oscillator historical resistance level. It's strongly encouraged to confirm price breakout with oscillator breakout since they have comparable effects to price breaking support and resistance levels; surely, short trades will have the same perception. As advantage, a lot of times oscillator breakout precedes price breakout as early alert to upcoming event as illustrated by last screenshot. Furthermore, divergence is confirmed in
FREE
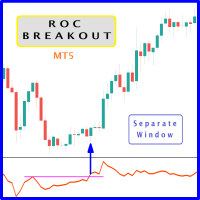
When prices breakout resistance levels are combined with Rate of Change oscillator "ROC" breaks out its historical resistance levels then higher chances emerges to record farther prices. It's strongly encouraged to confirm price breakout with oscillator breakout since they have comparable effects to price breaking support and resistance levels; certainly short trades will have the same perception. Concept is based on find swing levels which based on number of bars by each side to confirm peak or
FREE

Spread Indicator MT5 - NS Finanças. (http://www.nsfinancas.com.br) Auxiliary tool to give Spread visibility to all types of currency pairs and timeframes. The labels are well positioned in the upper right corner of the chart so as not to disturb the visualization during the trade, however it is also possible to drag the indicator to the best place on your screen. In addition to the current spread, this indicator also monitors the minimum, maximum and average spread of the selected currency pair
FREE

Everyone knows how to analyze the market , which level to buy / sell this is an easy job , which leads to unusual horrible loses , very little few people knows WHEN then enter the market , time is Money , this is the key!!!
This version is a Proof of concept limited version of ZamanCYcles founded here: https://www.mql5.com/en/market/product/81883?source=Site +Market+Product+Page This works Only on 3 Minutes Time frame for 45 Candles Get rest of planets and more than 10 other algorithms to pred
FREE

Special Offer ... It is totally free for all. New one coming soon...................
About This Indicator: RSI vs SMA Indicator: A Comprehensive Technical Analysis Tool for Better for Identify the Short and Long Signals.
The RSI vs SMA Indicator is a powerful technical analysis tool designed to understanding Market Price Fluctuation for Long or Short signals. This user-friendly Indicator good for both novice and experienced traders, providing valuable indication in price chart and separate wind
FREE
MetaTrader Маркет - лучшее место для продажи торговых роботов и технических индикаторов.
Вам необходимо только написать востребованную программу для платформы MetaTrader, красиво оформить и добавить хорошее описание. Мы поможем вам опубликовать продукт в сервисе Маркет, где его могут купить миллионы пользователей MetaTrader. Так что занимайтесь только непосредственно своим делом - пишите программы для автотрейдинга.
Вы упускаете торговые возможности:
- Бесплатные приложения для трейдинга
- 8 000+ сигналов для копирования
- Экономические новости для анализа финансовых рынков
Регистрация
Вход
Если у вас нет учетной записи, зарегистрируйтесь
Для авторизации и пользования сайтом MQL5.com необходимо разрешить использование файлов Сookie.
Пожалуйста, включите в вашем браузере данную настройку, иначе вы не сможете авторизоваться.