Смотри обучающее видео по маркету на YouTube
Как купить торгового робота или индикатор
Запусти робота на
виртуальном хостинге
виртуальном хостинге
Протестируй индикатор/робота перед покупкой
Хочешь зарабатывать в Маркете?
Как подать продукт, чтобы его покупали
Технические индикаторы для MetaTrader 5 - 21

Fibonacci Trend Indicator for MT5 Unlock the power of Fibonacci analysis on your MetaTrader 5 charts!
Our Fibonacci Trend Indicator automatically plots dynamic support and resistance levels so you can spot trends, reversals, and breakout opportunities at a glance. Features & Advantages Automatic Fibonacci Levels
Instantly displays seven key Fibonacci retracement levels based on the highest and lowest prices from your chosen lookback period — no manual work required. Dynamic Trend Adaptatio
FREE

The Supertrend etradro indicator is volatility based and is more of a trend following indicator in function. The ATR indicator, which is integrated into the calculation of the super trend, also calculates course gaps (gaps) and does not overlook them. This allows more accurate values to be calculated. When measuring volatility, the mean value of the current price serves as the basis. Since the Supertrend indicator features sliding stop and reversal lines, it is quite similar in function to the P
FREE

Индикатор реального волчка
Он обнаруживает точную волчку на графике со сбалансированным соотношением высоты тела и фитиля, что является истинным значением волчка, которое отличает его от Молотов и Доджи или Нулевой свечи.
Этот индикатор отображает иконку с крыльями на количестве волчков, найденных на графике.
Настройки включают
Количество баров: настроить поиск по количеству баров.
Цвет значка: изменить цвет значка
Код значка: изменить код крыла для значка
FREE

Highly configurable Williams %R indicator. Features: Highly customizable alert functions (at levels, crosses, direction changes via email, push, sound, popup) Multi timeframe ability Color customization (at levels, crosses, direction changes) Linear interpolation and histogram mode options Works on strategy tester in multi timeframe mode (at weekend without ticks also) Adjustable Levels Parameters:
Williams %R Timeframe: You can set the current or a higher timeframes for Williams %R. Williams
FREE

It makes it easier to see where there have been consolidation zones for previous prices and allows you to highlight the histogram where there is the biggest consolidation zone.
Input parameters Intervalo de preço Is the price between the histograms
Periodo Number of candle sticks to be analyzed
Porcentagem Highlights the histogram where there is minimal consolidation in relation to the analyzed period
FREE

Откройте для себя индикатор ATR Bands: ваш союзник в освоении волатильности и оптимизации сделок! ATR Bands используют ведущий индикатор Average True Range (ATR) для измерения волатильности и построения динамических полос вокруг цены. Эти полосы адаптируются в реальном времени к рыночным колебаниям, предоставляя вам четкое представление о критических ценовых зонах. Почему стоит выбрать ATR Bands? Определение сильных трендов: Пробитие полос сигнализирует о значительных движениях цен, что идеально
FREE

Раскройте истинные скрытые закономерности рынка с помощью торговой системы PREDATOR AURORA — финального босса гибридных торговых индикаторов. Увидьте то, что другие не видят! Система торговли PREDATOR AURORA — это мощный инструмент, созданный для тех, кто отказывается прятаться в тенях посредственности. Это не просто еще один индикатор; это код для читов; это ваше нечестное преимущество — сложная гибридная охотничья система, которая отслеживает движения рынка с летальной точностью в джунглях,
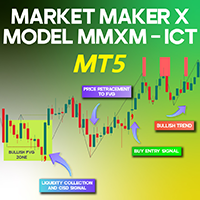
Market Maker X Model Indicator MMXM MT5 The Market Maker X Model Indicator (MMXM) is a strategic trading tool designed to detect price movement patterns and trend reversals. This indicator analyzes market flow, tracking the interaction between buyers and sellers to help traders understand liquidity shifts and key price zones more effectively. «Indicator Installation & User Guide» MT5 Indicator Installation | Market Maker X Model mmxm ICT MT4 | ALL Products By TradingFinderLab | Best MT5 In
FREE

To download MT4 version please click here . The Volume Oscillator measures volume by analyzing the relationship between two Moving Averages. The Volume Oscillator indicator subtracts a fast MA from slow MA. The fast and slow MA periods are configurable via input tab. Volume indicators are an ingredient of trading systems to avoid entry in thin liquidity markets. Having set a threshold on Volume Oscillator you can avoid entering chop. Buffers are available to access via EA.
FREE

Trade by levels for mt5 Индикатор Trade by levels for mt5 предназначен для автоматического определения формирования модели для входа в рынок на графике выбранного инструмента. Определения:
⦁ БСУ - бар, сформировавший уровень.
⦁ БПУ1 и БПУ2 - бары, подтверждающие уровень. Описание графической модели:
⦁ уровни хай\лоу у баров БСУ и БПУ1 должны совпадать с точностью до пункта
⦁ между БСУ и БПУ1 может быть какое угодно количество баров.
⦁ между Б
FREE

To download MT4 version please click here . - This is vortex indicator. - It is used to detect trend strength and direction. - It consists of two line(buffers). ==> VIM and VIP - There are three types of signals related to this indicator: 1. crossing VIM and VIP 2. threshold on distance between VIP and VIM 3. VIP above VIM vice versa. - This is a non-repaint indicator with light processing.
FREE

The HammerStar indicator is designed to search for the Hammer and Shooting Star patterns on charts of any currency pairs.
Hammer Downward trend.
The lower shadow is not less than 2 and no more than 3 times larger than the body.
There is no upper shadow, or it is very short (no more than 10% of the candlestick range).
The color of the body in the long game is not important, with the short - white hammer is much stronger than the black one.
Confirmation is suggested.
Shooting Star Uptrend.
The u
FREE

Volume Weighted Average Price (VWAP) is a trading benchmark commonly used by Big Players that gives the average price a Symbol has traded throughout the day. It is based on both Volume and price. This indicator contains Daily VWAP and MIDAS' VWAP, which means you are able to anchor the beggining of MIDAS' calculations and, therefore you will be able to use this methodology to study price versus volume moves after anchor point. You will be able to anchor up to 3 HIGH MIDAS VWAP's and 3 LOW.
Wish
FREE

- Displays horizontal lines for Previous Day High (PDH) and Previous Day Low (PDL) on the chart. - Customizable line colors via input parameters. - Sends sound alerts, pop-up notifications, and mobile push notifications upon the initial crossover of PDH or PDL. - Alerts are triggered only once per crossover event; they re-trigger only if the price moves away and re-crosses after a specified minimum interval. - Automatically updates the PDH/PDL levels at the start of each new day. - All indicator
FREE
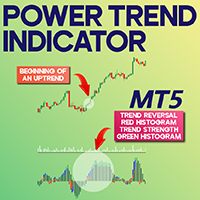
Power Trend Indicator for MetaTrader 5 The Power Trend Indicator for MetaTrader 5 is a dynamic trading utility designed to help traders pinpoint both the direction and momentum of ongoing market trends. This oscillator uses a color-coded histogram to visually represent trend strength. A red bar signifies a trend shift, blue indicates mild trend activity, green denotes strong momentum, and black reflects a flat or indecisive market. It's particularly useful for spotting trend reversals and rapid
FREE
Внимание - изначально индикатор разрабатывался для торговли фьючерсами и нюансами воскресной сессии. В данной модификации нет учёта воскресного премаркета, а идёт жесткая привязка ко времени на графике для корректной работы на споте. Стандартный индикатор АТР, можно включить игнорирование аномально больших свечей. Есть возможность менять расположение выводимого текста по 4 углам графика. Можно менять период расчёта (дней назад). Бонус - в индикатор добавлена корреляция с объёмами. Можно включит
FREE

This variant of the ZigZag indicator is recalculated at each tick only at the bars that were not calculated yet and, therefore, it does not overload CPU at all which is different from the standard indicator. Besides, in this indicator drawing of a line is executed exactly in ZIGZAG style and, therefore, the indicator correctly and simultaneously displays two of its extreme points (High and Low) at the same bar!
Depth is a minimum number of bars without the second max
FREE

This panel displays the price percentage change
Shows the percentage change in price from the last open: Daily, Weekly and Monthly timeframes. Numbers are easier to use than histogram currency meters. Line up the three timeframes strengths/weaknesses for strong trends. Compare currencies strongest against weakest. USD is the world's reserve currency to compare against.
How to use 1. Match the strongest currency with weakest currency; or 2. Match the strongest or weakest currency against USD;
FREE

O Indicador valida a força da tendência utilizando o volume negociado. Os candles são mostrados na cor verde indicando força compradora e cor vermelha na força vendedora. O movimento é encerrado pelo SAR parabólico. Vantagens: Filtra distorções de preço sem volume financeiro; Filtra consolidações e movimentos laterais; Filtra divergências de volume pelo indicador Money Flow. Desvantagens: Não filtra todos os falsos rompimentos, visto que rompimentos importantes geram altos volumes financeiros; N
FREE
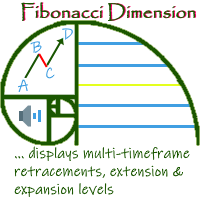
'Fibonacci Dimension' indicator allows display of preset or user-defined multi-timeframe Fibonacci levels. It automatically takes the previous high and low for two user-defined timeframes and calculates their Fibonacci retracement levels. It also considers the retraced level to draw the expansions on every change of price. A complete visual dimension in multiple timeframes allows deriving profitable strategies for execution. Enhanced functionality to view and customize the default Fibonacci Rang
FREE

Free for now, price is going to be 30 USD at Jan 1. 2025.
Features: Pin Bar Detection : The indicator is designed to identify bullish and bearish pin bars based on specific criteria, including the relative size of the candle’s body and shadow, as well as the position of the candle's body in relation to the 38.2% Fibonacci level. Customizable Labels : Custom text is displayed above each identified bullish or bearish pin bar, such as "[38.2]" for bullish and "[-38.2]" for bearish, helping traders
FREE
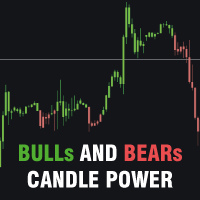
Bulls and Bears trend Power
The Bulls and Bears trend Power is a no repaint versatile technical analysis tool that helps traders identify market trends and see who's in control. It features dynamic trend capture logic that adapts to market conditions for a clear visual representation of trend direction. Traders can customize the colors to suit their preferences.
Features : Trend identification Compensation of market noise by strength of sellers or buyers
Recommendations : Use H1 timeframe a
FREE
Engulfing Pattern is a free indicator available for MT4/MT5 platforms, its work is to provide "alerts" when a "Bullish" or "Bearish engulfing pattern forms on the timeframe. This indicator comes with alerts options mentioned in the parameter section below. Join our MQL5 group , where we share important news and updates. You are also welcome to join our private channel as well, contact me for the private link. Engulfing Pattern Indicator MT4 Other Products Try our Martini EA with 2 years of liv
FREE
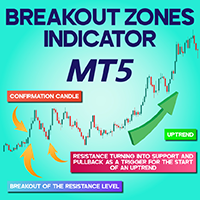
Breakout Zones indicator in MetaTrader 5 The Breakout Zones Indicator in MetaTrader 5 automatically draws support levels and resistance levels based on price movements on the chart. When the price crosses the resistance line, it indicates the start of an uptrend , and when it drops below the support line, it signals the formation of a downtrend . This indicator effectively helps identify bullish and bearish market trends. «Indicator Installation & User Guide» MT5 Indicator Installation | B
FREE
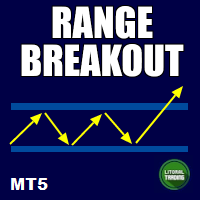
This is an indicator that highlights the price range, specifically in the morning. So it is very easy to identify when these zones are broken, giving you an excellent entry opportunity! Range Breakout works on all symbols and timeframes. It displays past price regions and projects the current one. If you find any bug or have any suggestion, please, contact us. Enjoy!

This indicator obeys the popular maxim that: "THE TREND IS YOUR FRIEND" It paints a Blue line for BUY and also paints a RED line for SELL. (you can change the colors). It gives alarms and alerts of all kinds. can be used for all currency pairs and timeframes. Yes, as easy and simple as that. Even a newbie can use it to make great and reliable trades. MetaTrader 4 Version

Eabotpro Signal Is indicator can scan all time frame and guide you where is the trend going with take profit and stop loss , Tp1 , Tp2 , Tp3 , he give 90% which is very good , preffer to work for scalping tf1 and for swings T15 till 4H , Nice indicator no more loss on your pocket , Eabotpro Signal scan Tf1 minutes till 1Day , Trading is not game , trading is ART, patient ,vision , in the end its your money and if you lose it no one will give it to you back , be responsible , accept the low minim

For those traders and students who follow the famous brazilian trader Igor Rodrigues (Mago Trader) here it is another tool he uses: a 2-line MACD specially set with Phi ratios. This MACD is packed with a twist: a Filling Area , to easily and visually spot the corresponding trend on the chart. Obviously, you can turn On and Off this filling feature. If you don't know Igor Rodrigues and you are a brazilian trader and student, just google for him... Very simple and useful indicator.
If you are loo
FREE
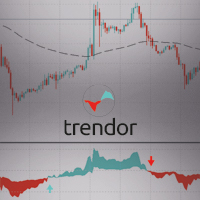
The TRENDOR 1.0 indicator is designed to identify and filter market trends using a combination of RSI and ATR indicators. This powerful trend detection system helps spot significant RSI crossovers while filtering out false signals using an ATR and an EMA (Exponential Moving Average). The purpose of this indicator is to provide clear and precise signals for optimal trading decision-making.
Main features:
Short and Long RSI: Combines the values of two RSIs (short and long) to detect market tr

Volume Horizon - это индикатор горизонтальных объёмов, предоставляющий возможность наблюдать за плотностью объёмов участников рынка в различных ценовых и временных интервалах. Гистограммы объёмов могут быть построены на основе восходящих или нисходящих волн рынка, а также по отдельным барам. Этот инструмент позволяет более точно определять моменты для открытия или закрытия позиций, опираясь на уровни максимальных объёмов или средневзвешенные цены по объёму.
Что делает Volume Horizon уникальным

Super Zone Несколько лет наблюдений за принципами работы рынка Super Zone работал, как тогда так и сейчас, потому что индикатор позволяет увидеть торговый диапазон недели и даже месяца, который используют крупные участники рынка. Очень прост в использовании работаем на H4 в недельном диапазоне ( в тестере на демо режиме не работает ) - от верхних зон продаем, от нижних покупаем. Отмечает зоны от начала недели (месяца) которые не перерисовываются , работает почти на всех валютных парах, отра

Real Spread Monitor — это мощный индикатор, который предназначен для точного измерения и анализа реальных спредов, предоставляя трейдерам возможность сравнивать торговые условия различных брокеров. Данный продукт также доступен для терминала MetaTrader 4 => https://www.mql5.com/ru/market/product/125769 Основные особенности Real Spread Monitor:
1. Два режима работы: Режим записи: В этом режиме индикатор собирает данные о реальных спредах выбранного торгового инструмента и записывает их в файл.

The selective pin bar is designed to identify reversals. To use the selective pin bar effectively, traders typically look for Strong Rejection: The tail of the pin bar should extend significantly beyond the surrounding price action. It indicates that there was a sharp rejection of higher or lower prices during the trading period. A strong rejection suggests that the market sentiment may be changing.
FREE

Smart Fibo Zones are powerful, auto-generated Fibonacci Retracements that are anchored to key market structure shifts . These zones serve as critical Supply and Demand levels, guiding you to identify potential price reactions and confirm market direction. Fibonacci calculations, widely used by professional traders, can be complex when it comes to identifying highs and lows. However, Smart Fibo Zones simplify this process by automatically highlighting order blocks and key zones, compl

Necessary for traders: tools and indicators Waves automatically calculate indicators, channel trend trading Perfect trend-wave automatic calculation channel calculation , MT4 Perfect trend-wave automatic calculation channel calculation , MT5 Local Trading copying Easy And Fast Copy , MT4 Easy And Fast Copy , MT5 Local Trading copying For DEMO Easy And Fast Copy , MT4 DEMO Easy And Fast Copy , MT5 DEMO
The homeopathic indicator is also called the CCI indicator. The CCI indicator was proposed
FREE

Технический индикатор Wave Vision измеряет относительную силу трендовых движений цены от ее средних значений за определенный период времени. Гистограмма показывает силу движения цены относительно линии нулевого уровня. Значения гистограммы, близкие к нулю, указывают на равенство сил между покупателями и продавцами. Выше линии нулевого уровня - бычий тренд (положительные значения гистограммы). Ниже линии нулевого уровня - медвежий тренд (отрицательные значения гистограммы).
Настройки:
Smo
FREE

This indicator draws the Donchian Channel, filling the background with colors. The color of the middle line is changed following the current trend, based on the standard interpretation of the Donchian Channel.
Input Parameters: Period of the Channel (default is 20) Validate Signals (boolean value to filter out false breakouts, default is false) Background Settings
Show Background (default is true) U ptrend Color (default is DodgerBlue ) Downtrend Color (default is Orchid) Background Tran
FREE

Kindly rate and comment about the product for upgradation & Support
The 5 EMA is plotted in green color ( Lime ).
The 14 EMA is plotted in red color ( Red ).
The 20 EMA is plotted in blue color ( Blue ).
The 200 EMA is plotted in yellow color ( Yellow ).
The Quarter EMA that provided calculates and plots four Exponential Moving Averages (EMAs) on the chart using different periods: 5, 14, 20, and 200. Each EMA is represented by a different color on the chart. Here's a description of each EMA:
FREE

Хотели бы вы знать какое влияние окажет экономическое событие на цену ? Что произойдет с рынком после наступления новостей? Как экономическое событие влияло на тики в прошлом? Этот индикатор поможет вам в этом. Вы любите технический анализ? Вам нравится изучать прошлое, чтобы предсказать будущее? Но, как думаете, что может быть важнее технического анализа, что могло бы улучшить технический анализ? Ну конечно же, это фундаментальный анализ! Ведь новости непосредственно влияют на рынок, а значит

Previous Candle Levels MT5 shows the previous candle levels, it shows the previous candle Open High Low Close levels (OHLC Levels) in different time frame. It's designed to help the trader to analyse the market and pay attention to the previous candle levels in different time frame. We all know that the OHLC Levels in Monthly, Weekly and Daily are really strong and must of the time, the price strongly reacts at those levels. In the technical analysis, the user can use them as a support and res
FREE

EMA Scalper Indicator is an indicator of EMA lines and reversal EMA lines. Each pair of EMA channels area that can be used to make reversal entry. After the EMA lines are widening because of major trend, the area can be used to find profitable entry and exit, especially after EMA reversal. Do the cut loss whenever candle closed outside the area.
The A, B, C, D, and E area are colored differently. Solid lines: Normal EMA lines. Dashed lines: Reversal EMA lines.

Direct Scalping shows the most SUPER SUPER SUPER EARLY opportunity to scalp the market. Do entry as early as possible, as soon as the first sign appears.
It plays sound alert so that you can wait the moment while doing something else.
Remember to cut loss below the '' area. Yes, it is not stop loss but cut loss (exit on candle close). Made for M1 timeframe, but higher is good too.
My new favorite setup: M3 using 8 indicators with different parameters: 11, 18, 25, 32, 39, 46, 53, and 60.
Combin

ToolBot Advisor Indicator (RSI, ATR, ADX, OBV) FREE An effective indicator for your negotiations
The toolbot indicator and advisor brings leading (OBV) and lagging (RSI, ATR, ADX) indicators so that you have more security in your negotiations. In addition, it informs you of possible up and down trends as well as providing you with incredible advisors who will give you information about trading opportunities.
With this indicator you will have more security and speed in your decision making of
FREE

Trendy Stock is a price following indicator that uses Stochastic to show when the price is out of the oversold or overbought areas. The algorithm allows you to stay longer in a trend where the bulls or bears are in control. The indicator changes color immediately the price exits oversold/overbought state. In short, the downtrend [red] bars start to paint when the buying pressure decreases while the uptrend [green] bars form as the buy pressure kicks in. For MT4 version, follow :: https://www
FREE

Indicator introduction:
The indicator is calculated by volumes and prices, It is a single side indicator, only has up arrow signals. It is better to use it in conjunction with other trend indicators, and you need to find the most efficient time to use it in order to acquire a high winning probability. The indicator can send emails, alerts and notifications to you when the indicator before k line has an up arrow. The indicator's parameters can be changed, including the computation period of the
FREE

The Expert Advisor for this Indicator can be found here: https://www.mql5.com/en/market/product/116472 Introducing the Rejection Candle MT5 Indicator, a robust tool designed to revolutionize your trading experience on the MetaTrader 5 platform. Built to pinpoint potential reversals with precision, this indicator offers unparalleled insights into market sentiment shifts, empowering traders to seize profitable opportunities with confidence. Key Features: Advanced Rejection Candle Detection: Uncov
FREE

Support Resistance Indicator The "Support Resistance" indicator is a versatile tool designed to help traders identify key support and resistance levels based on an underlying algorithm. These levels indicate price points where an asset historically experiences buying (support) or selling (resistance) pressure. The indicator allows traders to visualize these levels on their charts, making it easier to make informed decisions. All Products | Contact PARAMETERS: Timeframe :
Users can select the
FREE

This MT5 chart trend checker cuts through the noise of market volatility to provide a clearer picture of trends and price movements. It includes the following features that can provide more clarity during market assessments: 1 customizable multi-period moving average Optional Heikin-Ashi candles 3 switchable focus modes Distinct colors for easy analysis
Link to MT4 version: https://www.mql5.com/en/market/product/106708/
This indicator shows your preferred moving average from multiple time fram
FREE
NtickChart-BVcandle Features This is a free version with limited functionality.
This is a tick chart indicator that displays in a sub-window. Inspired by Bob Volman's (BV) scalping method, it is designed as a tool for achieving simple and effective trading. It is a tick chart specifically for day trading and scalping, focusing even on 1 pipette changes. Instead of time-based candle bars, it generates candle bars for a specified number of ticks (ticks_in_candle). This allows for a more detailed
FREE

Индикатор Custom Panel позволяет вам собрать всю необходимую информацию в одной таблице.
Содержимое таблицы можно настроить самостоятельно. В каждой из строк отображается состояние выполнения заданных условий или значения. Столбцы таблицы соответствуют таймфреймам. Панель может содержать до 10 строк и до 8 столбцов. Примеры использования:
Строка(Row) : Price > EMA(30)
Режим(Mode) : YES_NO
Значение : проверка условия: Price > EMA(30)
Строка : Ask < Bands[L]
Режим : YES_NO
Значение : проверка ус
FREE

Скользящая средняя Т3 Тиллсона была представлена миру технического анализа в статье «Лучшая скользящая средняя», опубликованной в американском журнале Technical Analysis of Stock Commodities. Разработанный Тимом Тиллсоном, аналитики и трейдеры фьючерсных рынков вскоре увлеклись этой техникой, которая сглаживает ценовой ряд, уменьшая при этом лаг (лаг), типичный для систем следования за трендом.
FREE
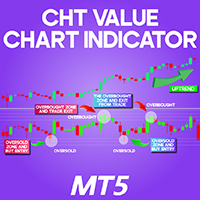
CHT Value Chart Indicator for MetaTrader 5
«Indicator Installation & User Guide» MT5 Indicator Installation | CHT Value Chart Indicator MT4 | ALL Products By TradingFinderLab | Best MT5 Indicator: Refined Order Block Indicator for MT 5 | Best MT5 Utility: Trade Assistant Expert TF MT5 | TP & SL Tool: Risk Reward Ratio Calculator RRR MT5 | Money Management: Easy Trade Manager MT5 | Trade Copier: Free Fast Local Trade Copier MT5 Introduction The CHT Value Chart Indicator is a s
FREE

This indicator draws the highest and the lowest prices of the previous periods on the chart. And If you want, Indicator can alert you when the current price arrives these levels. For example: If you are watching the H1 timeframe, Indicator shows you the lowest and the highest prices of H4, D1, W1 and M1 periods. So you don't need to open the other periods of chart windows. Alert Options: Send Mobil Message, Send E-mail, Show Message, Sound Alert Time Periods: M1, M5, M15, M30, H1, H2, H3, H
FREE

This indicator draws regular bullish and bearish divergences in real-time onto the charts. The algorithm to detect those divergences is based on my 10+ years experience of detecting divergences visually. The divergences are drawn as green and red rectangles on the charts. You can even do forward testing in the visual mode of the strategy tester.
Parameters Fast EMA Period: The period of the fast EMA of the MACD. Default value is 12.
Slow EMA Period: The period of the slow EMA of the MACD. Defau

Indicator that uses ATR and standard deviation to calculate the current trend. It has the top and bottom line. The top line is shown when it is high, and the bottom line when it is low. The indicator does not draw a trend line or show the trend for the day, or for a certain period. It has the function of indicating the current trend, and may indicate a reversal.
use it with caution and at your own risk.
FREE

В Clock GMT Live есть все, что вам нужно, чтобы узнать больше о нашем брокере, много раз вы задавались вопросом, на каком GMT я нахожусь или над каким GMT работает мой брокер, что ж, с помощью этого инструмента вы сможете узнать в режиме реального времени как GMT смещение времени брокера и вашего местного времени, вы также будете постоянно знать пинг брокера Просто поместив его на время суток, вы можете получить информацию
Цена увеличивается за каждое приобретение, с этим мы защитим, чтобы нем
FREE

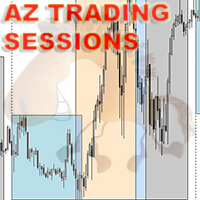
Этот продукт предназначен для отображения торговых сессий 15 стран на основе часового пояса вашего брокерского сервера и различных режимов отображения на основе желаемых вами настроек для предотвращения перегрузки графиков и возможности установки сессии в желаемое пользователем время.
На рынке Форекс никогда не заходит солнце, но его ритм танцует в такт отдельным торговым сессиям. Понимание этих сессий, их совпадений и их уникальной атмосферы имеет решающее значение для любого трейдера форекс,
FREE

Prior Cote — это простой, современный и необходимый индикатор для трейдеров, использующих технический анализ на основе уровней предыдущего дня. Он автоматически отображает на графике следующие уровни предыдущей торговой сессии: Открытие Максимум Минимум Закрытие Скорректированная цена (среднее значение между максимумом, минимумом и закрытием) Идеально подходит для: Стратегий разворота и пробоя Анализа уровней поддержки и сопротивления Настроек для внутридневной и свинг-торговли ️ Полностью н
FREE
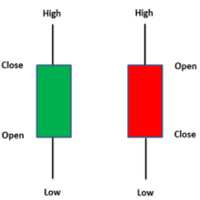
Индикатор показивает сила тренда если зеленый нумерация болше 50 надо искат сигнал на покупка и набарот красный нумерация болше 50 надо искат продажу,
индикатор основан на свечу хейкен аши
индикатор подойдет особенна для скалптнга и средный срок трейдинга
ПОМНИТЕ ИНДИКАТОР НЕ ГАРАНТИРУЕТ ПРИБИЛ НО ПОМОГАЕТ СДЕЛАТ ПРАВЫЛНЫЙ ТОРГОВЛЯ
РИСК НА СДЕЛКЕ СДЕЛАЕТЕ НЕ БОЛЕЕ 3 ПРОЦЕНТ
FREE

Japanese candlestick analysis has been in existence for hundreds of years and is a valid form of technical analysis. Candlestick charting has its roots in the militaristic culture that was prevalent in Japan in the 1700s. One sees many terms throughout the Japanese literature on this topic that reference military analogies, such as the Three White Soldiers pattern Unlike more conventional charting methods, candlestick charting gives a deeper look into the mind-set of investors, helping to establ
FREE

If there is only one MT5 indicator you ever buy for trading forex – this has to be it.
Your success as a forex trader depends on being able to identify when a currency or currency pair is oversold or overbought. If it is strong or weak. It is this concept which lies at the heart of forex trading. Without the Quantum Currency Strength indicator, it is almost impossible. There are simply too many currencies and too many pairs to do this quickly and easily yourself. You need help!
The Quantum Cur

Of all the four principle capital markets, the world of foreign exchange trading is the most complex and most difficult to master, unless of course you have the right tools! The reason for this complexity is not hard to understand. First currencies are traded in pairs. Each position is a judgment of the forces driving two independent markets. If the GBP/USD for example is bullish, is this being driven by strength in the pound, or weakness in the US dollar. Imagine if we had to do the same thing
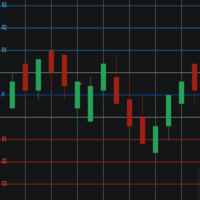
Pivot Points Levels Description The Pivot Points Levels indicator is an advanced and comprehensive tool for technical analysis based on support and resistance levels calculated from pivot points. This free indicator combines 6 different calculation methods with support for multiple timeframes, offering a robust solution for identifying key price reversal and continuation areas. Key Features 6 Calculation Methods : Traditional, Fibonacci, Woodie, Classic, DeMark (DM), and Camarilla Multi-Timefram
FREE

Этот новостной помощник предназначен для получения необходимых трейдерам экономических событий из основных издательских источников, которые публикуют новости в режиме реального времени на основе «Обзора рынка» терминала с различными и простыми фильтрами.
Трейдеры Форекс используют макроэкономические индикаторы для принятия обоснованных решений о покупке и продаже валют. Например, если трейдер считает, что экономика США будет расти быстрее, чем экономика Японии, он может купить доллар США и про
FREE

Functional in the Forex market. Functional on the B3 market - Bolsa Brasil Balcão. Motivation The Price Guide indicator is a tool that helps you insert support and resistance points at the chosen price and in the quantity you want, it depends on the agility of its configuration. This DEMO version will work on the Meta Trader 5 Demo account and Strategy Tester. Get the Full version that works with a Real account click: https://www.mql5.com/pt/market/product/111897 Operation The methodology publi
FREE

The TMA Centered Bands Indicator for MT5 draws bands on the chart and shows the overall price trend. It displays three bands - the lower and upper boundaries of the channel and the median. The bands are made up of moving averages, and each of them has an MA period. The name TMA comes from triangular moving averages, as the indicator draws triangular bands. The price will fluctuate between these ranges whenever the trend changes direction, thus creating entry and exit points. How to trade
FREE
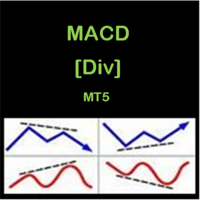
1. CONSTITUTION MACD [Div] MT5 is an indicator consisting of two oscillators (Main and Signal). This indicator draw arrows and lines in the main chart and subwindow chart according to the divergences detected. Using the inputs, we can: change the MACD values; change the colors of the divergence lines; enable and disable the alerts [poup up alerts and notification alerts]. enable or disable the drawing of divergence lines and arrows in the main chart or subwindow chart; 2. OPERATION CONDITIONS
FREE

Этот продукт получает информацию от индикаторов/сигнальных инструментов и отображает стрелки или уведомления при выполнении определенных условий.
Например, стрелки и уведомления отображаются, когда MA25 и MA50 пересекаются, когда SAR разворачивается, когда MACD меняет свой плюс/минус или когда цена закрытия пересекает полосы Боллинджера.
Пожалуйста, обратитесь к примеру изображения настроек для конкретных конфигураций.
Подробные руководства и файлы конфигурации:
https://www.mql5.com/en/blog
FREE

Break Even Line by MMD
The Break Even line is a useful indicator for people using strategies that allow simultaneous trades in both directions, such as the MMD methodology. This indicator is useful when playing statistical models and averaging positions in accumulation and distribution zones. The indicator draws levels by summing positions in three groups: positions included in BUY, positions included in SELL and all positions included.
Functionality description:
Show BUY BELine - shows or
FREE

Динамический индикатор поддержки и сопротивления - универсальный инструмент, объединяющий уровни поддержки и сопротивления с динамикой рынка в реальном времени. Путем учета предыдущих дневных максимумов и минимумов он предоставляет ценную информацию о психологии рынка и выявляет потенциальные уровни разворота цены или прорыва. Благодаря способности адаптироваться к изменяющимся рыночным условиям и настраиваемым параметрам, трейдеры могут опережать тренды и принимать обоснованные решения. Этот ин
FREE
Узнайте, как легко и просто купить торгового робота в MetaTrader AppStore - магазине приложений для платформы MetaTrader.
Платежная система MQL5.community позволяет проводить оплату с помощью PayPal, банковских карт и популярных платежных систем. Кроме того, настоятельно рекомендуем протестировать торгового робота перед покупкой, чтобы получить более полное представление о нем.
Вы упускаете торговые возможности:
- Бесплатные приложения для трейдинга
- 8 000+ сигналов для копирования
- Экономические новости для анализа финансовых рынков
Регистрация
Вход
Если у вас нет учетной записи, зарегистрируйтесь
Для авторизации и пользования сайтом MQL5.com необходимо разрешить использование файлов Сookie.
Пожалуйста, включите в вашем браузере данную настройку, иначе вы не сможете авторизоваться.