Conheça o Mercado MQL5 no YouTube, assista aos vídeos tutoriais
Como comprar um robô de negociação ou indicador?
Execute seu EA na
hospedagem virtual
hospedagem virtual
Teste indicadores/robôs de negociação antes de comprá-los
Quer ganhar dinheiro no Mercado?
Como apresentar um produto para o consumidor final?
Indicadores Técnicos para MetaTrader 5 - 90
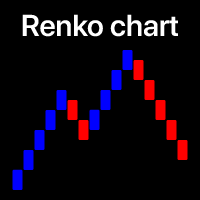
Filtre pequenos movimentos de preço e concentre-se na tendência geral . O indicador de gráfico Renko ajudará você a filtrar pequenos movimentos de preço para que possa se concentrar na tendência geral. O preço deve se mover uma quantidade especificada para criar um bloco Renko. Isso facilita identificar a direção atual da tendência em que o preço está se movendo. Utilitário multifuncional : inclui 66+ funções | Entre em contato comigo se tiver alguma dúvida | Versão para MT4 Nas configu
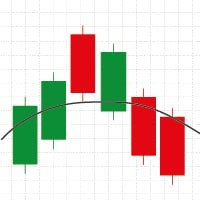
Wilder's Moving Average (Wilder's MA) is a smoothing technique developed by J. Welles Wilder, designed to reduce the impact of short-term price fluctuations and highlight longer-term trends. Unlike the standard Exponential Moving Average (EMA), Wilder's MA uses a unique smoothing factor, which gives it a slower and more stable response to changes in price. The calculation method emphasizes a more gradual adaptation to market changes, making it particularly useful in volatile markets. It helps tr
Introducing to your attention an innovative expert advisor created specifically for the most juicy and volatility currency basket: GBPUSD, XAUUSD and EURJPY. This system is designed using the main features of this market's movement, making it an ideal choice for dynamic trading on high-trending and medium-volatile pairs. The signals are focused on minimizing trading risks, aiming to reduce losses to a minimum.
Main features ESignals is designed to show open and close arrows at the beg
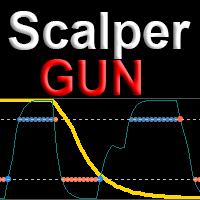
Scalper gun - главное оружие для торговли скальпингом и свингом, с визуализацией и алертом точек входа. Индикатор работает как в трендовых, так и в нетрендовых рыночных условиях. Подходит начинающим и опытным трейдерам. SCALPER GUN превосходит по скорости, качеству визуализации и точности входа популярные топовые индикаторы этого сайта!!!
Перед покупкой скачайте демо Scalper gun и сравните с аналогичными индикаторами для скальпинга в тестере MT4. Особенности Это готовая торговая система с визу

MultiFrame Trend Detector: Advanced Forex Trend Analysis Indicator The MultiFrame Trend Detector is a powerful MetaTrader 5 indicator that provides traders with comprehensive trend analysis across multiple timeframes. By dynamically adjusting trend thresholds based on the relationship between timeframes, the MultiFrame Trend Detector delivers reliable and consistent trend detection for all Forex pairs and precious metals. Key Features Custom Timeframe Analysis : Analyze trends across multiple, u

*Apresentando o Indicador Dourado para o NASDAQ 100!*
Você está em busca de uma ferramenta poderosa para aumentar seu sucesso nas negociações no NASDAQ 100? Não procure mais! Nosso indicador exclusivo foi desenvolvido meticulosamente após dois anos de extensa pesquisa e análise dos movimentos do NASDAQ 100.
Este avançado indicador de média móvel utiliza princípios da razão áurea, níveis de Fibonacci e ângulos de Gann para identificar os pontos de cruzamento mais precisos entre o preço e as mé

This code creates a custom indicator for the MetaTrader 5 platform. The indicator generates strong buy and sell signals using a combination of ZigZag, Moving Average (MA), and Relative Strength Index (RSI). Here’s a detailed explanation of the code: Indicator Definition and Features: The indicator is displayed in the chart window. It uses 5 indicator buffers and 3 plots. Separate graphs are defined for ZigZag, buy signals, and sell signals. Input Parameters: Various parameters are defined for Z
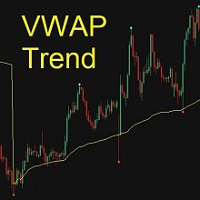
The Anchored VWAP (Volume-Weighted Average Price) indicator is a popular technical analysis tool used by traders and investors to analyze the price action over a period of time. This indicator will automatically identify the trend turning points to help traders more easily see when market is continuing the trend, pulling back, or reversing by crossing the VWAP line. Stack on multiple time frame periods to use like other moving average indicators. You can customize price calculatio
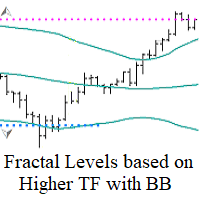
Fractal Levels based on Higher TF with BB Filter — esta ferramenta é projetada para construir níveis precisos de suporte e resistência com base em fractais do timeframe superior filtrados pelo indicador Bollinger Bands. Ela fornece sinais de compra e venda com alertas convenientes. Princípio de funcionamento:
O indicador analisa os níveis fractais filtrados pelo Bollinger Bands no timeframe superior e os exibe no seu gráfico atual. Você pode ajustar facilmente o timeframe superior nas configura
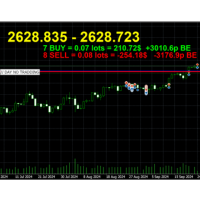
Breakeven Line v2 Indicator is a MetaTrader indicator that calculates breakeven level based on all open positions and displays it on your chart as a horizontal line. Additionally, it will calculate the total number trades, the total number of lots, and the distance to the breakeven line in points and profit/loss. The indicator is available for both MT5. Why use Breakeven Line Indicator? When you have multiple trades opened on a single symbol, it can be difficult to tell where your average ent

This LogReturnsIndicator.mq5 calculates and displays the logarithmic returns ("log returns") of the closing prices of a financial asset.
It computes the log-returns for each period using the formula:
log return=ln(close[i]close[i−1])
This measures the relative variation between consecutive closing prices in logarithmic terms, a method often used in finance to analyze the returns of financial assets.
Benefits of Log Returns:
Logarithmic returns are preferred in certain financial analyses b

This MQL5 indicator, named "Change Of State-(Poisson Law).mq5", is designed to identify significant change points in price movements using a model based on the Poisson distribution. Here’s a summary of how it works:
Purpose of the Indicator
The indicator aims to mark significant change points on the price chart by using arrows to indicate when price variation exceeds a threshold defined by the Poisson distribution.
Chart Display
The points where price variations exceed the Poisson threshold ar

This algorithm is a custom indicator for MetaTrader 5 (MT5) that plots two simple moving averages (SMA) on a financial chart to assist in the technical analysis of price movements. Here's what the algorithm does: Two Simple Moving Averages (SMA) : The indicator uses two different SMA periods: The first SMA (SMA1) has a longer period, set to 8 periods by default (SMA 8). The second SMA (SMA2) has a shorter period, set to 3 periods by default (SMA 3). Calculation of the Moving Averages : For each

This is an indicator that combines the Rate of Change and Bollinger Bands, with several functions: Identifying trends. Detecting overbought and oversold conditions. Determining potential reversal points. Applicable Chart: M5 The indicator is composed of four lines: the Upper Band, Lower Band, Fast Line, and Slow Line. Usage 1: Identifying Trends When the yellow line is above the red line and the green and blue lines are expanding, it indicates an upward trend. Conversely, if the yellow line is b

Machine Learning Adaptive SuperTrend - Take Your Trading to the Next Level!
Introducing the Machine Learning Adaptive SuperTrend , an advanced trading indicator designed to adapt to market volatility dynamically using machine learning techniques. This indicator employs k-means clustering to categorize market volatility into high, medium, and low levels, enhancing the traditional SuperTrend strategy. Perfect for traders who want an edge in identifying trend shifts and market conditio
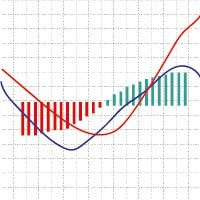
Wilder's MACD (Moving Average Convergence Divergence) is a variation of the traditional MACD indicator, incorporating Wilder's smoothing technique for more accurate trend signals. The indicator consists of three main components: MACD Line : This is the difference between two Exponential Moving Averages (EMAs) — a "Fast" EMA and a "Slow" EMA. The default periods are typically 12 for the Fast EMA and 26 for the Slow EMA. Signal Line : A smoothed version of the MACD Line using Wilder's Moving Avera

O indicador que você tem em mãos é, sem dúvida, uma das melhores ferramentas para operar no mercado do NASDAQ 100 em intervalos de tempo de 1 minuto e 5 minutos. Este indicador também funciona em outros intervalos de tempo, mas foi projetado especificamente para esses dois. Ele foi desenvolvido com alta precisão e não requer configurações iniciais. Basta executar o indicador e confiar em seus sinais. Precisão e Eficiência Esta ferramenta foi rigorosamente calibrada, combinando múltiplos indicado

The indicator now at your disposal is undoubtedly one of the best tools for trading in the NASDAQ 100 market, especially in the 1-minute and 5-minute timeframes. This indicator is meticulously designed for high precision and can be adjusted for other timeframes as well. Simply run it and receive good exit signals. Key Features: Specialized performance in the 1-minute and 5-minute timeframes: While this indicator works in other timeframes as well, its primary focus is on these two timeframes. Co
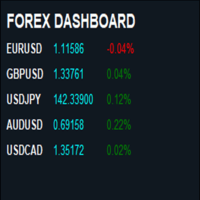
What’s the Forex Dashboard All About? Alright, so you’re diving into the world of forex trading, and you’ve probably heard about dashboards. But what are they exactly? Think of it as your command center for keeping tabs on multiple currency pairs all at once. It’s like having a radar that tells you what’s happening in the forex market without having to sift through tons of charts and data. What Does It Show You? Currency Pairs : You’ll see a list of popular currency pairs, like EUR/USD (Euro to
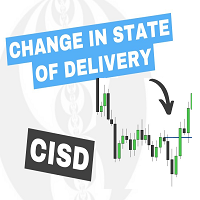
The Change In State Of Delivery (CISD) indicator detects and displays Change in State Of Delivery, a concept related to market structures.
Users can choose between two different CISD detection methods. Various filtering options are also included to filter out less significant CISDs.
USAGE Figure 2 A Change in State of Delivery (CISD) is a concept closely related to market structures, where price breaks a level of interest, confirming trends and their continuations from the resulting
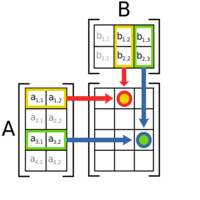
MT4 Version: https://www.mql5.com/en/market/product/124141 A Day in the Life of a Trader: Discovering the Forex Matrix Dashboard In the fast-paced world of forex trading, keeping track of multiple currency pairs can feel overwhelming. That’s where the Forex Matrix Dashboard comes in, making the life of a trader much easier. Imagine opening the dashboard and instantly seeing all your favorite currency pairs, like EUR/USD, GBP/USD, and USD/JPY, displayed clearly with their latest prices. No more
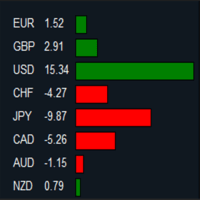
MT4 Version: https://www.mql5.com/en/market/product/124140 Imagine you’re at the helm of your trading terminal, scanning charts of various currency pairs, trying to figure out which ones are strong, which ones are weak, and where the real opportunities lie. It’s a lot to process—flipping between charts, calculating movements, and comparing performance. But what if all of that could be done for you, neatly displayed in one place? That’s where this Forex Strength Dashboard comes in. Picture thi

Дельта: танец цен на биржевом паркете Дельта - это не просто цифра, а отражение динамики рыночных сил, танцующих на биржевом паркете. Она показывает разницу между текущей ценой акции и ее начальной стоимостью. Подъем: Дельта в плюсе - это сигнал оптимизма. Цена акции растет, как пышный цветок, раскрывающийся под лучами солнца благоприятных новостей. Инвесторы видят перспективы и готовы платить больше за владение этой ценной бумагой. Падение: Дельта в минусе - это знак неуверенности. Цена акц

MT4 Version : https://www.mql5.com/en/market/product/124152 You’re sitting in your trading room, sipping coffee as the markets start their day. The screen in front of you is alive with numbers, price movements, and endless charts. Each one demands your attention. But you don’t have time to dive into every single detail. You need a quick, reliable way to read the market’s mood. That’s when you glance at your Sentiment Dashboard—a custom-built tool designed to simplify your trading decisions. Thi
This indicator is the mql version of the SuperTrend indicator. SuperTrend is one of the most common ATR based trailing stop indicators.
In this version you can change the ATR calculation method from the settings. Default method is RMA, when the alternative method is SMA. The indicator is easy to use and gives an accurate reading about an ongoing trend. It is constructed with two parameters, namely period and multiplier. The default values used while constructing a superindicator are 10 for
Crie seus próprios EAs de negociação de alta frequência com o Quantum Flash Todos nós já ouvimos falar sobre construtores e geradores em negociação, mas você já deu uma olhada no Quantum Flash? É um gerador revolucionário que ajuda você a criar seus próprios Expert Advisors (EAs) de negociação de alta frequência (HFT) com o código-fonte completo!
Como o Quantum Flash funciona? O Quantum Flash usa um algoritmo inteligente que emprega geração aleatória para preparar seu EA de HFT. Enquanto algun

Improve Your Trading with Buraq RSI Detector!
Buraq RSI Detector makes trading easier by spotting important RSI levels and marking them on your chart with clear bars. This helps you see exactly when to enter or exit trades. Key Features: Set Your Own RSI Levels: Choose the levels you want, and Buraq RSI Detector will mark them when the RSI touches those points. Clear Visual Signals: Bars appear on your chart as soon as the RSI hits your chosen levels, making it easy to find trading opportunitie
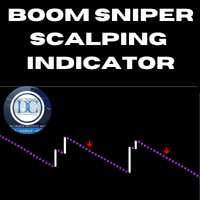
Boom Sniper Scalping Indicator for MQL5
The **Boom Sniper Scalping Indicator** is a highly accurate and reliable tool, specifically crafted for traders aiming to maximize profits in the Boom markets. Whether you're trading Boom 1000, Boom 900, Boom 600, Boom 500, or Boom 300 indices, this indicator provides precision signals to streamline your scalping strategy. With a focus on accuracy and efficiency, it is an indispensable asset for traders looking to capitalize on quick market movements.
K
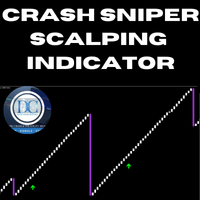
Crash Sniper Scalping Indicator for MQL5
The **Crash Sniper Scalping Indicator** is a powerful and reliable tool specifically designed for traders looking to profit from the Crash markets. Whether trading Crash 1000, Crash 900, Crash 600, Crash 500, or Crash 300 indices, this indicator provides high-precision signals to simplify scalping. With its clear visual cues and accuracy, it's an essential tool for traders aiming to capitalize on quick market movements.
Key Features: - **Multi-Timefram
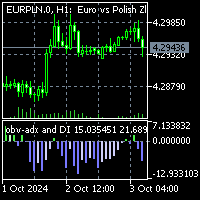
To get access to MT4 version please click here . This is the exact conversion from TradingView: "OBV ADX and DI" by " kocurekc ". This is a light-load processing and non-repaint indicator. All input options are available. Buffers are available for processing in EAs. You can message in private chat for further changes you need. I removed the background coloring option to best fit into MT platform graphics.

Want to create an Expert Advisor (EA) using an indicator that doesn’t store the required data in a buffer (visible in the Data Window) and only draws objects on the chart? This solution captures chart objects and places them into buffers, allowing you to create an EA—whether you're using EA Builder Pro or writing code with iCustom—by selecting the correct values using those buffers (modes). It works with any object visible in the Object List that has a unique Name or Description, such as: Trend

Indicator Description The indicator " TrendFusion " is designed for MetaTrader 5 and offers a comprehensive analysis by combining key technical indicators such as RSI, EMA, ATR, ADX, and MACD. It helps traders make informed decisions by visually representing these indicators and highlighting potential trading opportunities. This tool is especially useful for analyzing market dynamics across various assets, such as currency pairs or stocks. Functionality RSI (Relative Strength Index): Measures m
Daily Drawdown Indicator for MT5
Unlock your trading potential with our Daily Drawdown Indicator! This powerful tool provides real-time monitoring of daily drawdown levels, allowing traders to stay informed and make smarter decisions. Easily track your performance and manage risk by visualizing drawdown in a clear, user-friendly interface. Whether you're a beginner or an experienced trader, this indicator is essential for maintaining discipline and optimizing your trading strategy. Elevate you

The Neuro Trend Indicator leverages modern technology to provide early signals of trend reversals in the markets. Through precise color coding, the indicator displays the current trend direction: Green signals rising prices (bullish trend), while Red indicates falling prices (bearish trend). The further the indicator moves from the zero point, the stronger the trend. Values above zero indicate a strong upward trend, while values below zero point to a clear downward trend. With two customizable p

About indicator > The indicator is a function based on one value (open/high prices up to now) and then it is a mathematical representation of the whole function that is totally independent from any else values. So, if you ask yourself will the future be as it is on the graph... I can tell you - as it was the same as the trading function up to the moment "now"... In conclusion, the point of the indicator is to try to show the future of the trading function into eternity.
The graphic is sometime

O Suporte Resistência Whisperer MT5 é uma ferramenta poderosa projetada para ajudar os traders a identificar níveis cruciais de suporte e resistência no mercado. Este indicador usa a ação do preço para desenhar dinamicamente linhas de resistência vermelhas e linhas de suporte verdes em seu gráfico, oferecendo uma representação clara e visual das principais zonas de preço onde potenciais reversões ou rompimentos de mercado podem ocorrer. Ao contrário dos métodos tradicionais que depen
O Indicador de Zona FVG MT5 é uma ferramenta poderosa projetada para identificar Lacunas de Valor Justo (FVG) no mercado, destacando desequilíbrios de preço entre valor justo e preço de mercado. Essa identificação precisa de lacunas permite que os traders identifiquem potenciais pontos de entrada e saída do mercado, aumentando significativamente sua capacidade de tomar decisões comerciais informadas. Com sua interface intuitiva e amigável, o Indicador de Zona FVG escaneia automaticam
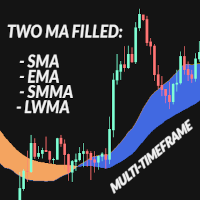
O Two MA Filled é um indicador de duas médias móveis projetado para traders que buscam uma análise técnica mais sofisticada e visual. Este indicador combina duas médias móveis personalizáveis com um preenchimento visual entre elas, permitindo que você visualize rapidamente a tendência do mercado e identifique oportunidades de entrada e saída. Recursos Principais: Médias Móveis Personalizáveis: Defina os períodos e os tipos de médias móveis (SMA, EMA, SMMA, LWMA) para as médias rápidas e lentas,

This indicator is based on the strategy shared by TheMas7er on his youtube channel.
The IDR/DR range will help you identify the high and low of the day once a candle closes above or below the the DR levels.
The IDR/DR range is determined 1 hour after session open, 09:30 am est.
I have incorporated the fibonacci tool to help you mark the retracement for a good entry in the premium or discount zone.
Important
This indicator is designed for the indices and M5 timeframe, but you
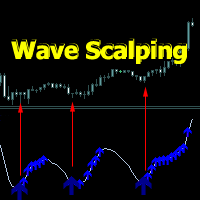
O indicador Wave Scalping é uma estratégia de negociação de curto prazo baseada no sistema de ondas. Inclui uma linha de onda, pontos de entrada e seguimento de posição.
Aparecem setas de sinalização quando a vela fecha.
Consiste numa linha de onda ao longo da qual são construídas as setas de sinalização e numa seta que confirma as direções após as setas de sinalização.
As setas de sinal são construídas tendo em conta a direção da tendência. Ao confirmar as setas de sinalização, existem vários
To get access to MT4 version please click here . This is the exact conversion from TradingView: "VolATR" by "barrettdenning" The screenshot shows similar results from tradingview and Metatrader when tested on ICMarkets on both platforms. This is a light-load processing. This is a non-repaint indicator. All input options are available. Buffers are available for processing in EAs. You can message in private chat for further changes you need. Here is the source code of a sample EA operating based

Indicador de Faixa de Preços Diária O Indicador de Faixa de Preços Diária é uma ferramenta poderosa, projetada para exibir os níveis de preços chave de cada dia de negociação, ajudando os traders a tomar decisões informadas com base na dinâmica do mercado. Este indicador desenha automaticamente retângulos no gráfico, destacando visualmente três pontos de preço importantes: Preço de Abertura Diária : Marcado com uma cor distinta para identificar facilmente o ponto de abertura do mercado a cada di

The Accumulation/Distribution (AD) Technical Indicator is a tool used in technical analysis to determine whether an asset is being accumulated (bought) or distributed (sold) in the market. Key Characteristics of the AD Indicator: Purpose: The AD indicator is used to assess the balance between buying (accumulation) and selling (distribution) of an asset. This helps traders and investors evaluate the strength of the current trend and potential reversals. Interpretation: Rising Indicator: Whe

The Accelerator Oscillator (AC) technical indicator measures the acceleration or deceleration of the current market strength. It is designed to identify potential trend reversal points and is used to determine the moment of buying or selling assets. The indicator helps traders make decisions based on changes in market dynamics. This implementation of the indicator is its creative version. Since the standard version is very limited by its built-in settings, this implementation has significantly

The AO (Accumulation/Distribution) technical indicator is a successful indicator for measuring market dynamics, which reflects specific changes in the market's driving force, which helps determine the strength of a trend, including its formation and reversal points. The AO indicator is a technical analysis tool that will help you trade more effectively. Main characteristics of the AO indicator: Purpose: The AO indicator is used to assess the balance between purchases (accumulation) and sales (di
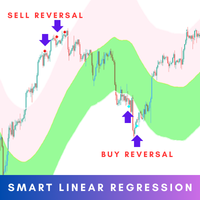
The Smart Linear Regression indicator is a powerful, non-repainting tool designed for traders looking for enhanced accuracy in market analysis. Unlike the typical linear regression channels that often repaint, this indicator provides reliable insights without changing past values, making it more trustworthy for forecasting future price movements. MT4 Version - https://www.mql5.com/en/market/product/124893/ Overview: The Smart Linear Regression Indicator goes beyond the basic linear regr

Automatic Fibonacci Levels Indicator The Automatic Fibonacci Levels Indicator is an essential tool for traders seeking to incorporate Fibonacci retracement and extension levels into their technical analysis seamlessly. This innovative indicator automatically identifies significant price movements and calculates key Fibonacci levels, providing traders with valuable insights into potential support and resistance areas. Key features: Automatic Calculation : Effortlessly plots Fibonacci levels base
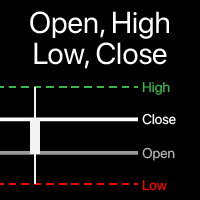
Visualização dos níveis Open, High, Low, Close no gráfico Você pode escolher qualquer timeframe , não apenas o atual. O deslocamento da barra calculada pode ser ajustado : a barra atual (flutuante) , ou um número definido de barras para trás. Utilitário multifuncional : inclui 66+ funções | Contate-me se tiver dúvidas | Versão MT4 Nas configurações do indicador, você pode configurar: Deslocamento da barra calculada: 0 = barra atual, 1 = barra anterior, 2 = 2 barras atrás... Opção " Incl

Automatic Trendline Indicator The Automatic Trendline Indicator is a powerful tool designed to simplify technical analysis by automatically identifying and drawing trendlines on a price chart. It analyzes price movements to detect key support and resistance levels, plotting ascending and descending trendlines based on historical price action. This indicator helps traders identify market trends, potential breakout points, and reversal areas with minimal effort. Key features: Automatic Detection

Antabod Genius Indicator—an advanced trading tool designed to give you accurate buy and sell signals directly on your MetaTrader 5 platform. Harnessing the combined power of Moving Averages (MA) and the Stochastic Oscillator, this indicator helps you identify optimal entry and exit points with ease. Key Features: • Precision with Dual Moving Averages: The Genius Indicator uses a fast and slow MA to detect key market momentum shifts. Crossovers between the MAs serve as reliable indicators for pot

Special Fair Value Gap (SFVG) Indicator
Unlock your trading potential with the Special Fair Value Gap (SFVG) Indicator! This innovative tool identifies critical price imbalances in the market, helping you pinpoint potential buying and selling opportunities with precision.
Key Features: - Multi Timeframe - Smart Money Tool - Identifies Key Price Levels: Automatically detects STRONG HIGH PROBABILITY gaps in price action where retracements are likely to occur, allowing you to make informed tra

Antabod Multiplier , the ultimate trading indicator designed to simplify your decision-making process and maximize your trading potential. Built with a robust combination of moving averages and stochastic oscillators, this tool provides clear, actionable signals for both buy and sell opportunities. The Antabod Multiplier stands out with its dynamic trend detection and precision filtering, giving you real-time visual signals to catch trend reversals and optimal entry/exit points with ease. Whethe

The "Profit and Fee" indicator was developed in MQL5 to help traders clearly visualize the fees involved in operations on the stock exchange (B3). It calculates and displays, in real time, the fees for emoluments and registration, allowing traders to understand the impact of these fees on their profit or loss.
Advantages and Features:
1. Financial Transparency: The indicator shows exactly how much you are paying in fees, providing a clear view of the real value of your operations. This helps
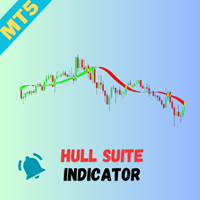
Overview
The Hull Suite is a highly responsive and smooth moving average indicator based on the Hull Moving Average (HMA), developed by Alan Hull in 2005. Known for its minimal lag and clear curves, the HMA has become a widely used technical analysis tool. This script brings together multiple Hull variations into one flexible and customizable indicator, ideal for traders looking for enhanced visual representation and trend analysis. Key Features
The Hull Suite offers three variations of the Hu

Description : In the world of trading, candlestick patterns are a popular technical analysis tool used by many traders. There are numerous candlestick patterns, ranging from reversal patterns to continuation patterns. However, remembering all these patterns can be challenging, especially for novice traders. This often leads to traders having to manually memorize and identify candlestick patterns, which can be time-consuming and prone to errors. Candle Pattern Pro is a powerful indicator desig

O Preditor Híbrido Boltzmann-Hopfield é um indicador MetaTrader avançado que combina previsão por rede neural com análise de volatilidade para prever movimentos de preços. Exibe setas verdes para movimentos de alta previstos e setas vermelhas para movimentos de baixa. O indicador só gera sinais quando condições específicas de volatilidade são atendidas, usando ATR, volatilidade histórica e reconhecimento de padrões para filtrar previsões. Características principais: Setas preditivas para direção
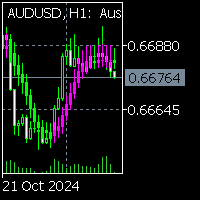
Apresentamos o Indicador de Velas de Regressão Linear para MQL5 - uma ferramenta poderosa projetada para funcionar perfeitamente em todos os instrumentos e períodos de tempo.
Este indicador avançado usa regressão linear para fornecer visualização precisa de tendências diretamente no seu gráfico de velas, ajudando os traders a identificar a direção do preço e possíveis reversões com precisão.
Quer esteja a negociar Forex, acções ou mercadorias, esta ferramenta versátil melhora a sua tomada d

Multi-Timeframe Fractal Indicator Description for MQL5 Introducing the Multi-Timeframe Fractal Indicator! Key Features: Multi-Timeframe Analysis: Analyze Fractals on a timeframe independent of your chart's current timeframe. Gain insights from higher timeframes for informed trading decisions. Customizable Parameters: Timeframe: Choose the timeframe on which Fractals will be calculated (e.g., Daily, H4, etc.). Number of Bars: Specify the number of bars considered around a potential Fractal for c

Introducing Your Ultimate Trading Edge: Dynamic Support & Resistance, Advance Entry Levels Indicator for MT5 platform Unlock the power of precision trading with our cutting-edge Dynamic Support & Resistance Indicator. Designed to give traders unparalleled clarity, this indicator is your roadmap to identifying exactly where to buy and sell, maximizing your potential for consistent, sustainable profits. Why Choose Our Indicator? Crystal Clear Entry and Exit Points : No more guesswork. Our indicat
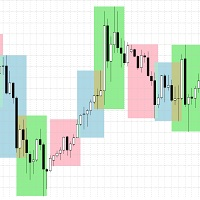
Session Boxes - Advanced Market Sessions Visualization Indicator
Overview The Session Boxes indicator is a powerful and highly customizable tool designed to help traders visualize major trading sessions directly on their charts. By clearly displaying the Asian, London, New York, Sydney, and Frankfurt sessions, traders can easily identify optimal trading times and potential market volatility periods.
Key Features
Multiple Session Support - Asian Session (Default: 00:00-09:00) - London Session

# Indicador MultiZigZag Pro para MetaTrader 5
O MultiZigZag Pro é um poderoso indicador técnico para a plataforma MetaTrader 5 que identifica, de forma inteligente e flexível, os principais pontos de inflexão e tendências nos gráficos de preços.
## Características principais: - Algoritmo avançado que filtra ruídos e movimentos irrelevantes do mercado - Múltiplos timeframes para análise de tendências de curto a longo prazo - Parâmetros de profundidade e desvio personalizáveis para adaptação a
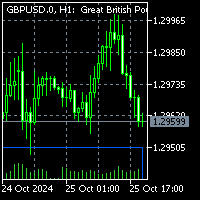
Note 1:To get access to MT4 version please contact via private message. Note 2: Multi time frame option is not available with this indicator. To order multi time frame please contact via private message. This is the exact conversion from TradingView: "Supply and Demand Visible Range by LuxAlgo". The screenshot shows similar results from tradingview and Metatrader when tested on ICMarkets on both platforms. This is a light-load processing. Updates are made based on new candle open and chart updat
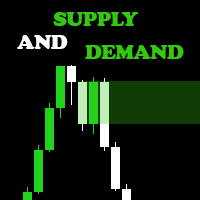
Are you ready to elevate your Forex trading game? Introducing the Supply and Demand Indicator , a powerful tool designed to help traders identify key market zones and make informed decisions with confidence! Key Features: Accurate Zone Identification : Our indicator pinpoints critical supply and demand zones, allowing you to spot potential reversal points and areas of price consolidation. User-Friendly Interface : With an intuitive design, you'll easily navigate through the settings and customiz
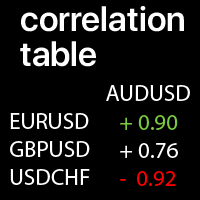
Valores de correlação entre os símbolos selecionados: compare as tendências atuais do mercado Um valor de +1: significa uma correlação positiva completa; Um valor de -1: significa uma correlação inversa completa; Um valor de 0: significa que não há correlação explícita (os preços não dependem um do outro, ou a correlação é aleatória ); Meu #1 Utilitário : 66+ recursos | Contate-me para qualquer dúvida | Versão MT4 Cada símbolo pode ser personalizado: removido /
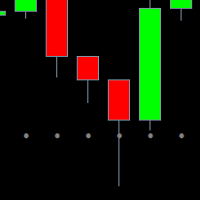
Quanto lucro é perdido por causa de um TakeProfit instalado incorretamente. E quantos padrões de velas se recusaram a funcionar devido ao fato de que no local de sua formação não havia uma área de interesse para os licitantes. Lucros perdidos e entradas perdidas com a escolha certa da direção Global-é sempre uma pena em trigêmeos. A negociação traz muita dor e caos quando tentamos negociar sem objetivos claros. Normalmente, em manuais de negociação ou em previsões de analistas, desenhar o canal

Supply & Demand Visible Range Indicator with Smart Alerts
Master the art of supply and demand trading with this powerful indicator that brings institutional-grade volume analysis to your charts! This sophisticated tool helps you identify key market levels where big players are active.
Key Features: - Dynamic supply and demand zone identification based on volume analysis - Smart alerts at crucial price levels (supply, demand, and mid-point zones) - Volume-weighted average calculations for pr

# Indicador MultiZigZag Pro para MetaTrader 5
O MultiZigZag Pro é um poderoso indicador técnico para a plataforma MetaTrader 5 que identifica, de forma inteligente e flexível, os principais pontos de inflexão e tendências nos gráficos de preços.
## Características principais: - Algoritmo avançado que filtra ruídos e movimentos irrelevantes do mercado - Múltiplos timeframes para análise de tendências de curto a longo prazo - Parâmetros de profundidade e desvio personalizáveis para adaptação a

Introducing Your Ultimate Trading Edge: Dynamic Support & Resistance, Advance Entry Levels Light Indicator for MT5 platform Unlock the power of precision trading with our cutting-edge Dynamic Support & Resistance Indicator. Designed to give traders unparalleled clarity, this indicator is your roadmap to identifying exactly where to buy and sell, maximizing your potential for consistent, sustainable profits. Why Choose Our Indicator? Crystal Clear Entry and Exit Points : No more guesswork. Our
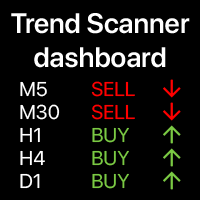
Painel de tendências: indicador de múltiplos timeframes, mostra o resumo da tendência atual Esta ferramenta é baseada em 3 indicadores principais: RSI, Estocástico e Índice de Canal de Mercadorias. A opção de alertas vai ajudar você a não perder o início da tendência. Utilitário multifuncional : inclui 66+ recursos | Entre em contato se tiver dúvidas | Versão MT4 Diversas opções permitirão personalizar o indicador de acordo com suas necessidades. Configurações: Ba
O Mercado MetaTrader contém robôs de negociação e indicadores técnicos para traders, disponíveis diretamente no terminal.
O sistema de pagamento MQL5.community está disponível para todos os usuários registrados do site do MQL5.com para transações em todos os Serviços MetaTrader. Você pode depositar e sacar dinheiro usando WebMoney, PayPal ou um cartão de banco.
Você está perdendo oportunidades de negociação:
- Aplicativos de negociação gratuitos
- 8 000+ sinais para cópia
- Notícias econômicas para análise dos mercados financeiros
Registro
Login
Se você não tem uma conta, por favor registre-se
Para login e uso do site MQL5.com, você deve ativar o uso de cookies.
Ative esta opção no seu navegador, caso contrário você não poderá fazer login.