Смотри обучающее видео по маркету на YouTube
Как купить торгового робота или индикатор
Запусти робота на
виртуальном хостинге
виртуальном хостинге
Протестируй индикатор/робота перед покупкой
Хочешь зарабатывать в Маркете?
Как подать продукт, чтобы его покупали
Технические индикаторы для MetaTrader 5 - 90
Daily Drawdown Indicator for MT5
Unlock your trading potential with our Daily Drawdown Indicator! This powerful tool provides real-time monitoring of daily drawdown levels, allowing traders to stay informed and make smarter decisions. Easily track your performance and manage risk by visualizing drawdown in a clear, user-friendly interface. Whether you're a beginner or an experienced trader, this indicator is essential for maintaining discipline and optimizing your trading strategy. Elevate you

Индикатор Neuro Trend использует современные технологии для предоставления ранних сигналов о разворотах трендов на рынках. Благодаря точной цветовой кодировке индикатор показывает текущее направление тренда: Зелёный сигнализирует о росте цен (бычий тренд), а Красный указывает на падение цен (медвежий тренд). Чем дальше индикатор от нулевой точки, тем сильнее выражен тренд. Значения выше нуля указывают на сильный восходящий тренд, а значения ниже нуля – на ярко выраженный нисходящий тренд. С помо

About indicator > The indicator is a function based on one value (open/high prices up to now) and then it is a mathematical representation of the whole function that is totally independent from any else values. So, if you ask yourself will the future be as it is on the graph... I can tell you - as it was the same as the trading function up to the moment "now"... In conclusion, the point of the indicator is to try to show the future of the trading function into eternity.
The graphic is sometime

The Поддержка Сопротивление Шепчущий MT5 мощный инструмент, разработанный для помощи трейдерам в определении важных уровней поддержки и сопротивления на рынке. Этот индикатор использует ценовое действие для динамического рисования красных линий сопротивления и зеленых линий поддержки на вашем графике, предлагая четкое и наглядное представление ключевых ценовых зон, где могут произойти потенциальные развороты или прорывы рынка. В отличие от традиционных методов, которые полагаются на

The Индикатор зоны FVG MT5 мощный инструмент, предназначенный для определения разрывов справедливой стоимости (FVG) на рынке, подчеркивающий ценовой дисбаланс между справедливой стоимостью и рыночной ценой. Это точное определение разрывов позволяет трейдерам определять потенциальные точки входа и выхода с рынка, значительно повышая их способность принимать обоснованные торговые решения. Благодаря интуитивно понятному и удобному интерфейсу индикатор FVG Zone автоматически сканирует гр
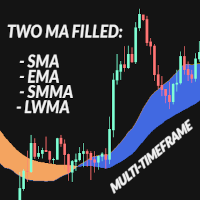
The Two MA Filled is a two moving averages indicator designed for traders seeking a more sophisticated and visual technical analysis. This indicator combines two customizable moving averages with a filling visual between them, allowing you to quickly visualize market trends and identify entry and exit opportunities. Key Features: Customizable Moving Averages: Set the periods and types of moving averages (SMA, EMA, SMMA, LWMA) for the fast and slow averages, tailoring the indicator to your tradin

This indicator is based on the strategy shared by TheMas7er on his youtube channel.
The IDR/DR range will help you identify the high and low of the day once a candle closes above or below the the DR levels.
The IDR/DR range is determined 1 hour after session open, 09:30 am est.
I have incorporated the fibonacci tool to help you mark the retracement for a good entry in the premium or discount zone.
Important
This indicator is designed for the indices and M5 timeframe, but you
To get access to MT4 version please click here . This is the exact conversion from TradingView: "VolATR" by "barrettdenning" The screenshot shows similar results from tradingview and Metatrader when tested on ICMarkets on both platforms. This is a light-load processing. This is a non-repaint indicator. All input options are available. Buffers are available for processing in EAs. You can message in private chat for further changes you need. Here is the source code of a sample EA operating based

Индикатор Дневного Диапазона Цен Индикатор Дневного Диапазона Цен — это мощный инструмент, предназначенный для отображения ключевых уровней цен для каждого торгового дня, который помогает трейдерам принимать взвешенные решения на основе динамики рынка. Этот индикатор автоматически рисует прямоугольники на графике, визуально выделяя три ключевые ценовые точки: Цена открытия дня : Отмечена особым цветом, чтобы легко определить, где начался рынок каждый день. Максимум дня (самая высокая цена дня) :

Технический индикатор AD (Accumulation/Distribution) — это инструмент технического анализа, который помогает определить, происходит ли накопление или распределение актива на рынке. Основные характеристики индикатора AD: Цель: Индикатор AD используется для оценки баланса между покупками (накоплением) и продажами (распределением) актива. Это позволяет трейдерам и инвесторам оценить силу текущего тренда и возможные развороты. Интерпретация: Рост индикатора: Когда индикатор AD растет, это ука

Технический индикатор AC (Accelerator Oscillator) измеряет ускорение или замедление текущей рыночной силы. Он разработан для выявления возможных точек разворота тренда и используется для определения момента покупки или продажи активов. Индикатор помогает трейдерам принимать решения, основываясь на изменениях в динамике рынка.
Данная реализация индикатора является его креативной версией. Поскольку стандартная версия очень ограничена встроенными в неё настройками, эта реализация имеет значител

Технический индикатор AO (Accumulation/Distribution) — это удачный индикатор для измерения рыночной динамики, который отражает конкретные изменения движущей силы рынка, что помогает определить силу тренда, включая точки его формирования и разворота. Индикатор AO– это инструмент технического анализа, который поможет вам торговать более эффективно.
Основные характеристики индикатора AO: Цель: Индикатор AO используется для оценки баланса между покупками (накоплением) и продажами (распределением)
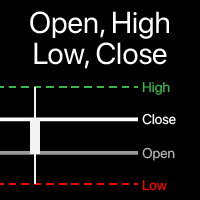
Визуализация уровней Open, High, Low, Close на графике Вы можете выбрать любой таймфрейм , не только текущий. Смещение рассчитываемого бара можно настроить : текущий (плавающий) бар , или заданное количество баров назад . У меня есть Многофункциональная утилита : содержит более 66 функций | напишите мне если есть вопросы | версия для MT4 В настройках индикатора можно настроить: Смещение рассчитываемого бара: 0 = текущий бар, 1 = предыдущий бар, 2 = 2 бара назад... Опция " Объединить

Antabod Genius Indicator—an advanced trading tool designed to give you accurate buy and sell signals directly on your MetaTrader 5 platform. Harnessing the combined power of Moving Averages (MA) and the Stochastic Oscillator, this indicator helps you identify optimal entry and exit points with ease. Key Features: • Precision with Dual Moving Averages: The Genius Indicator uses a fast and slow MA to detect key market momentum shifts. Crossovers between the MAs serve as reliable indicators for pot

Special Fair Value Gap (SFVG) Indicator
Unlock your trading potential with the Special Fair Value Gap (SFVG) Indicator! This innovative tool identifies critical price imbalances in the market, helping you pinpoint potential buying and selling opportunities with precision.
Key Features: - Multi Timeframe - Smart Money Tool - Identifies Key Price Levels: Automatically detects STRONG HIGH PROBABILITY gaps in price action where retracements are likely to occur, allowing you to make informed tra

Antabod Multiplier , the ultimate trading indicator designed to simplify your decision-making process and maximize your trading potential. Built with a robust combination of moving averages and stochastic oscillators, this tool provides clear, actionable signals for both buy and sell opportunities. The Antabod Multiplier stands out with its dynamic trend detection and precision filtering, giving you real-time visual signals to catch trend reversals and optimal entry/exit points with ease. Whethe

The "Profit and Fee" indicator was developed in MQL5 to help traders clearly visualize the fees involved in operations on the stock exchange (B3). It calculates and displays, in real time, the fees for emoluments and registration, allowing traders to understand the impact of these fees on their profit or loss.
Advantages and Features:
1. Financial Transparency: The indicator shows exactly how much you are paying in fees, providing a clear view of the real value of your operations. This helps
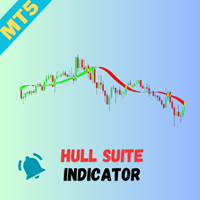
Overview
The Hull Suite is a highly responsive and smooth moving average indicator based on the Hull Moving Average (HMA), developed by Alan Hull in 2005. Known for its minimal lag and clear curves, the HMA has become a widely used technical analysis tool. This script brings together multiple Hull variations into one flexible and customizable indicator, ideal for traders looking for enhanced visual representation and trend analysis. Key Features
The Hull Suite offers three variations of the Hu

Description : In the world of trading, candlestick patterns are a popular technical analysis tool used by many traders. There are numerous candlestick patterns, ranging from reversal patterns to continuation patterns. However, remembering all these patterns can be challenging, especially for novice traders. This often leads to traders having to manually memorize and identify candlestick patterns, which can be time-consuming and prone to errors. Candle Pattern Pro is a powerful indicator desig

The Simple Market Sessions Indicator helps traders visualize the current status of major forex market sessions: Asian , London , New York , and Sydney . It shows whether each market is Open , Active (based on volume) , or Closed directly on the chart. With customizable session times and a volume threshold, this tool helps traders monitor session activity and volume strength, making it easier to decide the best times to trade.
Key features: Displays status: Open, Active (High Volume), or Closed
FREE

Гибридный предиктор Больцмана-Хопфилда - это сложный индикатор MetaTrader, который объединяет нейросетевое прогнозирование с анализом волатильности для прогнозирования движения цен. Отображает зеленые стрелки для прогнозируемых бычьих движений и красные стрелки для прогнозируемых медвежьих движений. Индикатор генерирует сигналы только при определенных условиях волатильности, используя ATR, историческую волатильность и распознавание паттернов для фильтрации прогнозов. Основные характеристики: Про
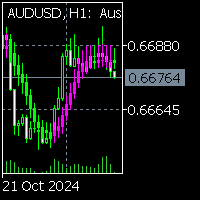
Представляем индикатор Linear Regression Candles для MQL5 - мощный инструмент, предназначенный для работы на всех инструментах и таймфреймах.
Этот продвинутый индикатор использует линейную регрессию для точной визуализации тренда прямо на свечном графике, помогая трейдерам точно определять направление движения цены и потенциальные развороты.
Торгуете ли вы на Форекс, акциями или сырьевыми товарами, этот универсальный инструмент поможет вам принимать решения, предлагая четкое понимание динам

Multi-Timeframe Fractal Indicator Description for MQL5 Introducing the Multi-Timeframe Fractal Indicator! Key Features: Multi-Timeframe Analysis: Analyze Fractals on a timeframe independent of your chart's current timeframe. Gain insights from higher timeframes for informed trading decisions. Customizable Parameters: Timeframe: Choose the timeframe on which Fractals will be calculated (e.g., Daily, H4, etc.). Number of Bars: Specify the number of bars considered around a potential Fractal for c

Introducing Your Ultimate Trading Edge: Dynamic Support & Resistance, Advance Entry Levels Indicator for MT5 platform Unlock the power of precision trading with our cutting-edge Dynamic Support & Resistance Indicator. Designed to give traders unparalleled clarity, this indicator is your roadmap to identifying exactly where to buy and sell, maximizing your potential for consistent, sustainable profits. Why Choose Our Indicator? Crystal Clear Entry and Exit Points : No more guesswork. Our indicat
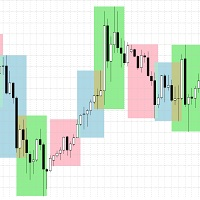
Session Boxes - Advanced Market Sessions Visualization Indicator
Overview The Session Boxes indicator is a powerful and highly customizable tool designed to help traders visualize major trading sessions directly on their charts. By clearly displaying the Asian, London, New York, Sydney, and Frankfurt sessions, traders can easily identify optimal trading times and potential market volatility periods.
Key Features
Multiple Session Support - Asian Session (Default: 00:00-09:00) - London Session

# Indicador MultiZigZag Pro para MetaTrader 5
O MultiZigZag Pro é um poderoso indicador técnico para a plataforma MetaTrader 5 que identifica, de forma inteligente e flexível, os principais pontos de inflexão e tendências nos gráficos de preços.
## Características principais: - Algoritmo avançado que filtra ruídos e movimentos irrelevantes do mercado - Múltiplos timeframes para análise de tendências de curto a longo prazo - Parâmetros de profundidade e desvio personalizáveis para adaptação a
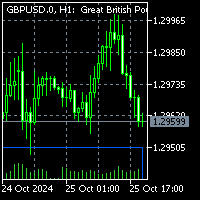
Note 1:To get access to MT4 version please contact via private message. Note 2: Multi time frame option is not available with this indicator. To order multi time frame please contact via private message. This is the exact conversion from TradingView: "Supply and Demand Visible Range by LuxAlgo". The screenshot shows similar results from tradingview and Metatrader when tested on ICMarkets on both platforms. This is a light-load processing. Updates are made based on new candle open and chart updat
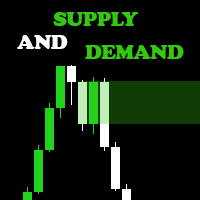
Are you ready to elevate your Forex trading game? Introducing the Supply and Demand Indicator , a powerful tool designed to help traders identify key market zones and make informed decisions with confidence! Key Features: Accurate Zone Identification : Our indicator pinpoints critical supply and demand zones, allowing you to spot potential reversal points and areas of price consolidation. User-Friendly Interface : With an intuitive design, you'll easily navigate through the settings and customiz
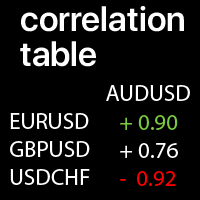
Значения корреляции между выбранными символами: сравнение текущих рыночных трендов Значение +1: означает полную положительную корреляцию; Значение -1: означает полную обратную корреляцию; Значение 0: означает отсутствие явной корреляции (цены не зависят друг от друга, или корреляция случайна ); Моя утилита #1 : 66+ функций | Свяжитесь со мной по любым вопросам | Версия для MT4 Каждый символ можно настроить: удалить / заменить. Вы можете добавить до 10 символов в с
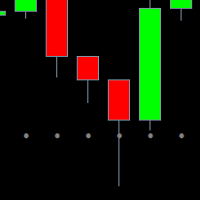
Как же много прибыли теряется из-за неправильно установленного тейкпрофита. А сколько свечных паттернов отказалось работать из-за того, что в месте их образования отсутствовала зона интереса участников торгов. Упущенные прибыли и убыточные входы при правильном выборе глобального направления – это всегда обидно в тройне. Трейдинг приносит очень много боли и хаоса, когда мы пытаемся торговать без четких целей. Обычно в пособиях по трейдингу или в прогнозах аналитиков, рисуют канал и уровни так-как

Supply & Demand Visible Range Indicator with Smart Alerts
Master the art of supply and demand trading with this powerful indicator that brings institutional-grade volume analysis to your charts! This sophisticated tool helps you identify key market levels where big players are active.
Key Features: - Dynamic supply and demand zone identification based on volume analysis - Smart alerts at crucial price levels (supply, demand, and mid-point zones) - Volume-weighted average calculations for pr

# Indicador MultiZigZag Pro para MetaTrader 5
O MultiZigZag Pro é um poderoso indicador técnico para a plataforma MetaTrader 5 que identifica, de forma inteligente e flexível, os principais pontos de inflexão e tendências nos gráficos de preços.
## Características principais: - Algoritmo avançado que filtra ruídos e movimentos irrelevantes do mercado - Múltiplos timeframes para análise de tendências de curto a longo prazo - Parâmetros de profundidade e desvio personalizáveis para adaptação a

Introducing Your Ultimate Trading Edge: Dynamic Support & Resistance, Advance Entry Levels Light Indicator for MT5 platform Unlock the power of precision trading with our cutting-edge Dynamic Support & Resistance Indicator. Designed to give traders unparalleled clarity, this indicator is your roadmap to identifying exactly where to buy and sell, maximizing your potential for consistent, sustainable profits. Why Choose Our Indicator? Crystal Clear Entry and Exit Points : No more guesswork. Our
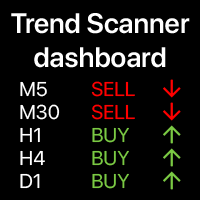
Мультитаймфреймовый индикатор, показывающий сводку текущего тренда Этот инструмент основан на 3 основных индикаторах: RSI, Stochastic и Commodity Channel Index. Функция оповещений поможет вам не пропустить начало тренда. Моя многофункциональная утилита в которой более 66 функций | свяжитесь со мной если у вас есть вопросы | версия для MT4 Разнообразные настройки позволят адаптировать индикатор под ваши нужды. Настройки: Расчетный бар: текущий (плавающий) или предыдущий

Разблокируйте мощь Фибоначчи с индикатором Adaptive Fibonacci Trend Ribbon (AFTR)! Готовы ли вы революционизировать свою торговую стратегию? AFTR — это не просто еще один индикатор — это ваш мощный инструмент для выявления трендов, анализа разворотов и точного принятия решений с безупречной ясностью. Построенный на основе мощного выравнивания последовательностей Фибоначчи и набора продвинутых скользящих средних, этот индикатор создан для трейдеров, которым нужны как точность, так и гибкость. Клю

The "NBank Levels MT5 Indicator" is an essential tool for traders looking to refine their market strategies with precision. This indicator identifies and displays the key price levels for both the current day and the previous day, allowing traders to pinpoint exact entry points. By focusing on these specific levels, traders can enhance their decision-making process, leading to more accurate trade executions.
This indicator is designed to simplify the trading experience. It presents data clearl

Hey there! If you are using Moving Average indicator into RSI indicator's window and always wondering if there could be a way to get alerts on your smartphone when those two indicators get a crossover that would be great, right!? Then you have found the right tool for that. This indicator is nothing but a mix of MA indicator and RSI indicator into one indicator window as well as it will give you alerts for crossovers on your smartphone app, email and also on your trading terminal's (desktop) cha

Индикатор Nro Lines с помощью построения линий предлагает точную и динамичную визуализацию ключевых уровней цен. Эта функциональность позволяет трейдерам выполнять оптимизированный технический анализ, что необходимо для разработки эффективных торговых стратегий и принятия уверенных решений о входе и выходе с рынка. Основные функции: - Динамические линии отсчета, которые корректируются в соответствии с изменениями рынка, предлагая обновленное и релевантное визуальное представление для трейдера.

Loud Key Levels MT5 Indicator The "Loud Key Levels" indicator for MetaTrader 5 is an innovative trading tool designed to enhance your market analysis by identifying critical support and resistance levels. This indicator simplifies the decision-making process for traders by providing a visual representation of average key levels, as well as upper and lower close key levels, facilitating a clearer understanding of potential price action. Key Features Average Key Levels : The core function of the
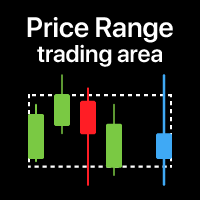
Визуализация торгового диапазона за выбранный период времени Особенно полезно при торговле на низких таймфреймах , чтобы видеть диапазон с более высокого ТФ . Я разработал многофункциональную утилиту в которой более 66 функций, включая этот индикатор | если есть вопросы - свяжитесь со мной | версия этого индикатора для MT4 Когда может быть полезно: При использовании нескольких таймфреймов Чтобы увидеть общую картину с другого периода Чтобы увидеть весь диапазон за выбранный период Настр
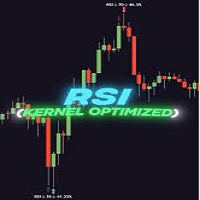
GENERAL OVERVIEW
Introducing our new KDE Optimized RSI Indicator! This indicator adds a new aspect to the well-known RSI indicator, with the help of the KDE (Kernel Density Estimation) algorithm, estimates the probability of a candlestick will be a pivot or not. For more information about the process, please check the "HOW DOES IT WORK ?" section. Features of the new KDE Optimized RSI Indicator :
A New Approach To Pivot Detection
Customizable KDE Algorithm
Realtime RSI & KDE Dashboard
Alert
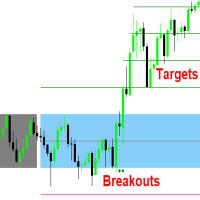
This indicator measures and displays the price range created from the first period within a new trading session, along with price breakouts from that range and targets associated with the range width. The Opening Range can be a powerful tool for making a clear distinction between ranging and trending trading days. Using a rigid structure for drawing a range, provides a consistent basis to make judgments and comparisons that will better assist the user in determining a hypothesis for the day's pr
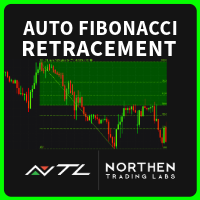
AutoFib: Advanced Fibonacci Retracement for MetaTrader 5 Automate Fibonacci Analysis for Smarter Trading Decisions AutoFib simplifies Fibonacci retracement analysis by automatically identifying key levels of support and resistance directly on your MT5 charts. Whether you're new to Fibonacci analysis or an advanced trader, AutoFib enhances your ability to identify potential reversals, continuations, and critical price levels. Key Features: Automatic Fibonacci Levels – Identify retracement and ext
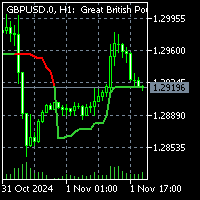
To get access to MT4 version please contact via private message. This is the exact conversion from TradingView:"ATR Trailing Stoploss" by "ceyhun" The screenshot shows similar results from tradingview and Metatrader when tested on ICMarkets on both platforms. This is a light-load processing indicator. It is a non-repaint indicator. Colored Candle option is not available. Buffers are available for processing in EAs. You can message in private chat for further changes you need.

This indicator automatically draws trendlines, Fibonacci levels, support and resistance zones, and identifies BOS (Break of Structure) and CHOCH (Change of Character) patterns on the chart. Just by placing it on the graph, it handles the essential technical analysis tasks for traders, providing a streamlined, effective trading tool this tools is alway make every one easy for trading.

Это продвинутый трендовый индикатор, разработанный для точного выявления разворотов и начала трендовых движений. С помощью этого инструмента вы сможете получать качественные сигналы для входа и выхода из рынка, минимизируя ложные точки входа и повышая прибыльность сделок. Индикатор подходит для любых активов (валютные пары, акции, индексы) и временных интервалов, от минутных до дневных графиков

PLEASE NOTE THIS IS PROACTIVE PRODUCT, NOT A DONE FOR YOU SET AND FORGET. YOU MUST KNOW ABOUT OTPIMIZATION AND WANT TO BUILD YOUR OWN EA . Prop Trading Code is one of a kind product that lets you build your own prop trading EA to attempt to pass a challenge taking it buy each day. This is a generator that has all the conditions to generate a code that you can then use to build your own prop trading EA in your strategy tester. This empowers the trader to generate, define, build, alter and use

Привет, ребята, это The Rangers Fx. Нам удалось создать индикатор для обнаружения всплесков индекса Boom 1000, индекса Boom 500 и индекса Boom 300. Фактически, слова этого индикатора применяются ко всем доступным бумам, а также к другим, которые еще появятся в будущем. Как использовать этот индикатор Прежде всего, вы должны изменить свой таймфрейм на таймфрейм M1/M5. Этот индикатор отправит вам предупреждение о том, когда открывать сделки на покупку и когда выходить/закрывать сделки (X), и не бо

Привет, ребята, это The Rangers Fx. Нам удалось создать индикатор для улавливания всплесков индекса Crash 1000, индекса Crash 500 и индекса Crash 300. Фактически, слова этого индикатора влияют на все доступные сбои, а также на другие, которые еще появятся в будущем. Как использовать этот индикатор Прежде всего, вы должны переключить свой таймфрейм на таймфрейм M1/M5. Этот индикатор отправит вам предупреждение о том, когда открывать сделки на продажу и когда выходить/закрывать свои сделки (X), и

Cycle Identifier Pro: Advanced Swing Highs & Lows Indicator Description: Unlock the full potential of your trading strategy with Cycle Identifier Pro , a cutting-edge indicator meticulously designed to pinpoint swing highs and swing lows with unparalleled precision. Whether you’re a seasoned trader or just starting out, Cycle Identifier Pro offers the tools you need to navigate any market condition across all timeframes with confidence. Key Features: Accurate Swing Detection : Swing Highs and Lo

Индикатор Supertrend — это мощный инструмент для определения тренда, предназначенный для трейдеров, которые хотят легко идентифицировать восходящие и нисходящие тенденции на рынке. Созданный для MQL5, он предоставляет анализ в реальном времени и помогает пользователям принимать обоснованные торговые решения, выделяя точки входа и выхода. С настраиваемыми параметрами этот индикатор адаптируется к различным рыночным условиям, обеспечивая гибкость и точность в торговых стратегиях.

MacD Power Trend — Multi-Timeframe, Color MACD Indicator Designed to help you avoid missing the most critical turning points in the market. Not a simple indicator, it speeds up the decision-making process for both novice and professional traders with its customizable color palette, multi-timeframe support, and clear visual signals. • Multi-Timeframe Support – Track 1-hour, 4-hour, daily, and more beyond your main chart with just one click. • Dynamic Color Coding – MACD line and histogram bars a
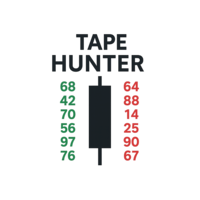
Tape Hunter – Ваш радар усилий и результата в MT5 Tape Hunter — это идеальный индикатор для трейдеров, которые хотят видеть настоящую игру за ценами на MetaTrader 5. Он четко и интуитивно показывает агрессивные объемы покупок и продаж на основе POC (Point of Control), позволяя визуализировать усилия рынка и реальный результат на каждом свече. ️ Почему это важно?
Не весь объем двигает цену! Tape Hunter показывает, действительно ли усилия (агрессивный объем) эффективно влияют на движение ц
Japanese Candle Patterns (JCP) User Guide Overview and Features Japanese candlestick patterns, a foundational element of technical analysis, provide traders with visual insights into market psychology. Each pattern represents the battle between bulls and bears, encapsulating critical information about market sentiment, potential reversals, and continuation signals. Developed centuries ago and later popularized by Steve Nison in Japanese Candlestick Charting Techniques , these patterns are now wi

ICT Liquidity Levels — это продвинутый индикатор, разработанный для трейдеров, стремящихся к точной торговле с использованием институциональных уровней. Этот индикатор отображает важные ежедневные и сессионные уровни цены, предлагая структурированный обзор, который соответствует стратегии ICT Silver Bullet для большей ясности и фокусировки. Функции: Полный набор ключевых уровней: Индикатор отмечает важные ценовые уровни для поддержки стратегической торговли, включая: Дневной максимум и миним

The First Dawn indicator uses a unique mechanism to search and plot signals.
This keeps searching for signals, making it a great indicator for scaping and identification of changes in direction, swing trading and trend trading.
The First Dawn helps you get early signals. The backtest gives the true picture of how the indicator works with real/demo accounts.
Although this is a tiny indicator it is packed with advantageous settings that will help you whether you desire to: Snap the Peaks a

О индикаторе Этот индикатор основан на моделировании Монте-Карло закрывающих цен финансового инструмента. По определению, Монте-Карло — это статистический метод, используемый для моделирования вероятности различных исходов в процессе, включающем случайные числа, основанные на ранее наблюдаемых результатах.
Как это работает? Этот индикатор генерирует несколько сценариев цен для ценной бумаги, моделируя случайные изменения цен с течением времени на основе исторических данных. Каждый пробный запус

This indicator identifies and visually displays Support and Resistance zones on a financial chart, providing traders with critical insights into market structure and potential price action areas. Here's how it operates: Key Features: Zone Identification: Detects Support Zones (price levels where buying pressure is historically strong). Detects Resistance Zones (price levels where selling pressure is historically strong). Categorizes zones into: Weak Zones Untested Zones Turncoat Zones (previousl
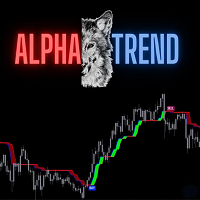
AlphaTrend is a brand new indicator which inspired by Trend Magic. In Magic Trend we had some problems, Alpha Trend tries to solve those problems such as:
1-To minimize stop losses and overcome sideways market conditions.
2-To have more accurate BUY/SELL signals during trending market conditions.
3- To have significant support and resistance levels.
4- To bring together indicators from different categories that are compatible with each other and make a meaningful combination regarding momen
20 Sources, Non-Repainting, Fast Performance
Introducing the All-In-One Supertrend: my first attempt at creating the ultimate trading tool. Designed with flexibility and customization in mind, each source is fully adjustable and integrates seamlessly with the others, allowing you to craft a strategy that fits your unique trading style, without compromising on speed or performance.
General settings (applicable across all sources):
ATR Period ATR Multiplier Change ATR Calculation [when switched

Бесплатная версия ProEngulfing - это QualifiedEngulfing с ограничением на один сигнал в день и меньшим количеством функций. Присоединяйтесь к каналу Koala Trading Solution в сообществе mql5, чтобы быть в курсе последних новостей о всех продуктах Koala. Ссылка для присоединения ниже: https ://www .mql5 .com /en /channels /koalatradingsolution Версия для MT4 этого продукта доступна по следующей ссылке: https ://www .mql5 .com /en /market /product /52023 Представляем ProEngulfing – ваш профессиона
TW Volume Signal Pro MT5 , использующий передовые технологии ИИ и собственные умные алгоритмы, позволяет вам торговать на рынке золота с большей уверенностью и предоставляет уникальный и несравненно лучший торговый опыт. Ищете ли вы высокую точность и исключительные торговые сигналы на рынке золота? С TW Volume Signal Pro MT5 вы можете стать профессиональным трейдером и добиться большого успеха на рынке золота. Так что попробуйте это бесплатно!
Ключевые особенности TW Volume Signal Pro MT5:
Т

Этот индикатор свечей Ганна объединяет ряд стратегий У. Д. Ганна в один торговый индикатор. Ганн был легендарным трейдером, который жил с 1878 по 1955 год. Он начинал как фермер, выращивающий хлопок, и начал торговать в возрасте 24 лет в 1902 году. Его стратегии включали геометрию, астрономию, астрологию, временные циклы и древнюю математику. Хотя Ганн написал несколько книг, ни одна из них не содержит всех его стратегий, поэтому для их изучения требуются годы. Он также был преданным исследоват

G-Labs Market Maker Dashboard - Exclusive Seasonal Offer Elevate your trading with the original G-Labs Market Maker Dashboard, available for a limited time at just $70 USD. Ideal for starter traders, this dashboard has been enhanced with new features and now includes a comprehensive training video. This indicator is for people trading the market makers method and is the entry level dashboard for that strategy is available for both mt4 and mt5. its a market scanner in real time showing peak forma

Hurst Cycles Diamonds Description This indicator is an alternative version inspired by the pioneering work of David Hickson and the Hurst Cycles Notes indicator developed by Grafton. The main objective is to provide a clear and intuitive view of the Hurst cycles. Credits Original Concept : David Hickson - Hurst Cycles Theory Inspiration : Grafton - Hurst Diamond Notation Pivots Alternative Version : Fillipe dos Santos Main Features Identifies and displays pivots in multiple time cycles Visual t
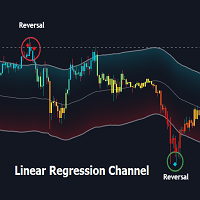
Overview:
The Linear Regression Channel Indicator is a versatile tool designed for Metatrader to help traders visualize price trends and potential reversal points. By calculating and plotting linear regression channels, bands, and future projections, this indicator provides comprehensive insights into market dynamics. It can highlight overbought and oversold conditions, identify trend direction, and offer visual cues for future price movements.
Key Features:
Linear Regression Bands: ( figur

Description :
The "MVRV by Age Approximation" indicator offers traders a unique on-chart visualization of the Market Value to Realized Value (MVRV) ratio, segmented by holding periods, or "age cohorts." This indicator is designed to approximate the MVRV metric by categorizing assets into short-term, mid-term, and long-term holders, providing a clear view of the relative unrealized profit or loss across different holding periods. Using simple moving averages over adjustable periods, this indicato
Индикатор MLD RSI MT5: Максимизируйте потенциал RSI с помощью настраиваемых оповещений Введение Индикатор MLD RSI для MT5 добавляет расширенные функции к классическому Индексу Относительной Силы (RSI), включая настраиваемые оповещения и возможности подтверждения тренда. Этот инструмент идеально подходит как для начинающих, так и для опытных трейдеров, и работает с множеством рынков, включая форекс, акции, криптовалюты и синтетические индексы. Что такое RSI? Индекс относительной силы (RSI) измер

GTrendDetector Индикатор GTrendDetector предоставляет сигналы на покупку и продажу. Индикатор рассчитывает границы канала по рекурсивному методу, а также среднее, полученное из этих границ. Выход цены закрытия за границы канала генерирует сигналы на покупку/продажу. Индикатор рисуте границы канала, окрашивает область между средней и ценой закрытия, и выводит на график значки в местах смены тенденции. Входные параметры: Source - тип цены для расчета границ канала. Length - количество баров для ра
MetaTrader Маркет - единственный магазин, где можно скачать демоверсию торгового робота и подвергнуть его проверке и даже оптимизации на исторических данных.
Прочитайте описание и отзывы других покупателей на заинтересовавший вас продукт, скачайте его прямо в терминал и узнайте, как протестировать торгового робота перед покупкой. Только у нас вы можете получить представление о программе, не заплатив за неё.
Вы упускаете торговые возможности:
- Бесплатные приложения для трейдинга
- 8 000+ сигналов для копирования
- Экономические новости для анализа финансовых рынков
Регистрация
Вход
Если у вас нет учетной записи, зарегистрируйтесь
Для авторизации и пользования сайтом MQL5.com необходимо разрешить использование файлов Сookie.
Пожалуйста, включите в вашем браузере данную настройку, иначе вы не сможете авторизоваться.