Смотри обучающее видео по маркету на YouTube
Как купить торгового робота или индикатор
Запусти робота на
виртуальном хостинге
виртуальном хостинге
Протестируй индикатор/робота перед покупкой
Хочешь зарабатывать в Маркете?
Как подать продукт, чтобы его покупали
Технические индикаторы для MetaTrader 5 - 83
The Corr indicator, also known as the Correlation Indicator, serves as a reference indicator for hedge institutions. It is used to measure the degree of relationship between two or more financial products. In the financial field, especially in the currency market, correlation coefficients are commonly used to study the correlation and degree of relationship between different currencies. Correlation coefficients are typically represented by values ranging from -1 to 1. Here are some common interp

神奇九转, 顾名思义就是每当出现数字9时,行情就很大的几率会发生逆转,这时应该注意止盈。是一个很有效的指标。 在序列显示和形成过程中,一旦出现不符合触发条件的情况,则前面序列数字消失,本次九转序列结构不存在。如果连续九天都达到触发条件,九转序列结构形成,价格走势可能发生反转。
九转序列可分为上升九转结构和下降九转结构,也就是九转序列在买多和买空以及判断各种走势反转是都可以使用。 九转序列买入建仓,即下降九转序列结构形成时,价格走势将要发生转变,考虑建仓买入。 买入条件:连续出现九根K线,并且满足收盘价都低于前一根K线收盘价,当第8、9根K线满足上述条件时,九转序列形成,投资者准备买入建仓。
使用分时九转时需要注意两点: 1、极端行情时(连续上涨或下跌),九转序列失效; 2、当九转序列完全形成时,再进场操作(尤其不用刚出现数字8或9就入场,一定要完全形成之后才可以。)

PTS - Divergence Buy Finder от Precision Trading Systems Precision Divergence Finder был разработан для точного определения дна рынка и часто успешно справляется с этой задачей. В техническом анализе искусство выбора дна обычно намного проще, чем выбор вершины, и этот инструмент разработан именно для этой задачи. После обнаружения быстрой дивергенции мудро подождать, пока тренд не изменится вверх, прежде чем покупать. Для входа можно использовать высокий уровень за 10 или 20 баров или скользящее
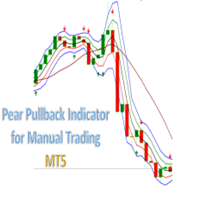
Grape PullBack Indicator for Manual Trading. Indicator (arrow) Type Strategy (Pullback) for all Symbols and Periodicity, Preferably from 30M periodicity. Can be used for manual trading. The indicator i s determined by strategies that is based on criteria for the location of candlesticks in the channel and for the Rsi, Atr, Fractal and Market facilitation index indicators. Its workspace corresponds to channel of 3 bars of Bill Willians with a channel extension . BUY when there is a Green A

PTS - Divergence Buy Finder от Precision Trading Systems Precision Divergence Finder был разработан для точного определения дна рынка и часто успешно справляется с этой задачей. В техническом анализе искусство выбора дна обычно намного проще, чем выбор вершины, и этот инструмент разработан именно для этой задачи. После обнаружения быстрой дивергенции мудро подождать, пока тренд не изменится вверх, прежде чем покупать. Для входа можно использовать высокий уровень за 10 или 20 баров или скользящее

This is a multi-timeframe indicator that detects and displays support and resistance (S&R) lines using the ZigZag indicator.
Features
The support and resistance lines are not redrawing. The indicator is capable of adding new support and resistance levels as they appear. Each S&R line has a tooltip that displays the price level and start time. Shows the start time, price level and number of touches of all S&R lines when pressing the shortcut Shift+I Save time for multi-timeframe analysis on tr

Introducing the "Bull vs Bear Price Strength Oscillator" Indicator: Your Key to Smart Trading Decisions! Are you looking for a trading tool that can provide you with a clear and visual representation of price trend strength? Look no further! The Price Strength Indicator is here to transform the way you analyze the markets and make trading decisions. Uncover Hidden Market Strength: The Price Strength Indicator is designed to help you assess the market's momentum with ease. It does this by evaluat

Этот индикатор сочетает в себе классические индикаторы MACD и Zigzag для обнаружения расхождения между ценой и индикаторами. Он также использует передовые технологии искусственного интеллекта (ИИ) для обнаружения достоверности расхождения. MACD известен как "король индикаторов", а Zigzag также является очень полезным индикатором. Объединяя эти два индикатора, этот индикатор использует преимущества обоих. Обнаружение расхождения является вероятностной проблемой. Часто расхождения возникают только

Индикатор DataSource AC — инструмент технического анализа разработанный автором на основе, Accelerator Oscillator (осциллятор ускорения). Все знают общие принципы работы с индикатором AC. Поэтому я не буду описывать их отдельно. Я сосредоточусь на различиях. Различия являются чисто технической реализацией и расширенной функций индикатора. Также важной особенностью является то, что индикатор не меняет свои значения даже при использовании цены закрытия, поскольку индикатор использует алгоритм без

Код индикатора Demand Index от Precision Trading Systems
Demand Index (Индекс спроса) был создан Джеймсом Сиббетом и использует сложный код для упрощения интерпретации объема и цены как комбинации.
Понимание объемов никогда не было легкой задачей, но этот красивый фрагмент программного обеспечения, безусловно, делает ее гораздо проще.
Существует несколько способов, которыми этот индикатор может быть полезен как для трейдеров, так и для инвесторов.
Дивергенции (как ведущий индикатор) Изучив

Trader! Don't you want to spend all day on your computer screen looking at quotes?
And do you want to receive stock buying/selling tips based on one of the most used indicators in FOREX on your cell phone?
Then discover the Vegas Tunnel
Support and product questions at the link below:
Support
This indicator searches for Buy and Sell SIGNALS in Stock Exchange Assets. It works on any asset on the market.
Select in the parameters which Fibonacci line the signal will be sent and then jus

This indicator provides the ability to recognize the SMC pattern, essentially a condensed version of the Wyckoff model. Once the pattern is confirmed by RTO, it represents a significant investment opportunity. There are numerous indicators related to SMC beyond the market, but this is the first indicator to leverage patterns to identify specific actions of BigBoy to navigate the market. The SMC (Smart Money Concept) pattern is a market analysis method used to understand the behavior of "smart

This MetaTrader 5 indicator helps traders by identifying and marking two important levels on the chart:
1. Previous Day's High (PDH):
- The highest price reached in the market during the previous trading day.
2. Previous Day's Low (PDL):
- The lowest price reached in the market during the previous trading day.
How it Works:
1. Initialization:
- When you attach the indicator to a chart, it initializes by calculating the PDH and PDL based on the highest and lowest prices of the previo

ICT Kill zone and Macros Indicator mark and display the following zone times on the chart: Kill zones Kill zone Forex Asian
London Open New York Open London Close Central Bank Dealing range
Kill zone Indices Asian London Open New York AM New York Lunch New York PM Power Hour
Macros London 1 London 2 New York Am 1 New York AM 2 New York Lunch New York PM 1 New York PM 2
Silver bullet London Open New York AM New York PM
Sessions Asian London New York
Chart The display of Kill zone , Macro ,

--- StudentK Ict Smc Structure --- 1. Inner Circle Trading
2. Smart Money Concept
3. Structure
--- What are included in tool --- 1. Market Session Box
2. Kill Zone
3. High/Low
4. Imbalance
5. FU Candle
6. Thicker Wick + Doji Candlestick
7. StudentK's Structure Line
8. Pivot Point
--- Context --- StudentK is not indicated as a master or K Sir for knowledgeable person who claims for winning all the time. (But lots of traders should know the fact that it is rarely truth, especially in fluctuated

Support and Resistance X3 calculate and show Support and Resistance in 3 different modes and 2 different Styles.
Modes:
ICT High / Low Mode Fractal Mode ZigZag mode Styles: Dot Line
Options:
Button to choose between 3 Modes Button to choose between 2 Styles
Alert when Support and Resistance touched
Alert when Support and Resistance break Button to hide / show Menu
Button take and save screenshot of current chart
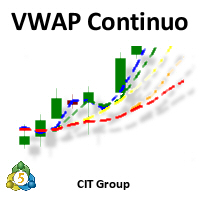
Apresentação:
- O Indicador "VWAP Contínua" da CIT Group é um indicador especializado na bolsa brasileira (B3). Objetivo:
- Especificamente desenvolvido para o perfil de pessoas que operam IntraDay.
Funcionamento:
- Calculado com base nos trades realizados durante o pregão, sendo atualizado a cada 1 segundo, tendo maior precisão dos preços Funcionalidades:
- Entrega de até 5 VWAPs simultâneas, onde as 4 primeiras são configuráveis, e a última é fixa sendo a diária - Opção para visualizar di
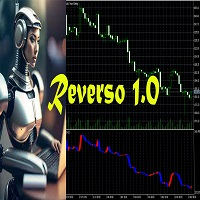
Reverso 1.0 est un Indicateur Technique basé sur la tendance. Cet Indicateur intègre une formule exceptionnelle qui permet de décider au croisement du signal et du prix de clôture d'entrer dans le marché.
Le timeframe indiqué est compris entre 2H et 1D.
Les symboles que je conseille sont les suivants:
BTCUSD-ETHUSD
XAUGBP-XAUEUR-XAUAUD-XAGEUR-XAUUSD
NZDJPY-GBPUSD-EURJPY-GBPJPY-USDJPY-CHFJPY-CADJPY-AUDJPY

Цель индикатора "черная лошадь" - выявление расхождений между движением цены и индикатором VWAP. Он использует фильтры для выявления потенциальных ложных расхождений и выдачи качественных, точных сигналов.
Медвежьи расхождения обозначаются красными точками над свечой, тогда как бычьи расхождения представлены зелеными точками под свечой.
Основной фильтр расхождений основан на ATR (Средний истинный диапазон) и движении цены в предыдущих свечах в пределах периода обзора. Расхождения определяются

Индикатор предназначен для того, чтобы вовремя закрывать позиции по рынку.
Например: досрочно фиксировать прибыль, если цена не достигла TakeProfit, а рынок разворачивается.
Индикатор анализирует импульс, а не тренд. О тренде никакой информации он не дает.
Индикатор хорошо подходит для поиска дивергенции.
Индикатор Ershov 38 Parrots динамически подстраивается под рынок и выявляет импульсы движения цены средней и высокой амплитуды. На мелкие скачки цены почти не реагирует.
Принципиальное отличи
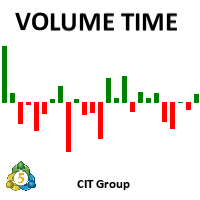
Apresentação:
- O Indicador "Volume Time" da CIT Group é um indicador especializado na bolsa brasileira (B3). Objetivo:
- Especificamente desenvolvido para o perfil de pessoas que operam IntraDay.
Funcionamento:
- Calculado com base nos trades realizados durante o pregão, sendo atualizado a cada 1 segundo, tendo maior precisão dos volumes Funcionalidades:
- Entrega de um conjunto de parâmetros como tipo de indicador (Financeiro, Volume ou Quantidade), estes podendo ser calculado (Unitário, U

Daily supply and demand levels for breakouts or reversals. Use on 1 Hour charts No nonsense, for the confident trader who trades price action supply and demand levels with daily projections without the fluff using 1 Hour charts. MT4 Version: https://www.mql5.com/en/market/product/108234 The Bank Trader Indicator is a sophisticated tool employed by institutional traders, particularly those in banking institutions, to navigate the complex world of forex markets. Rooted in the principles of daily

Unlock the power of the market with our game-changing SMC Liquidity Zone Scanner – the ultimate tool that transforms your trading strategy! Say goodbye to uncertainty and hello to precision with our cutting-edge indicator, engineered to elevate your trading game. The SMC Liquidity Zone Scanner isn't just another tool; it's your gateway to mastering market liquidity, identifying critical break of structure points, and pinpointing support and resistance levels effortlessly. Powered by state-of-th

Make your decisions easier when rolling Covered Call. This robot provides you with information that aids in decision on how and when to roll your structure. It works for any asset in the spot market that has authorized options series on B3 (Brazilian stock exchange). Associate the robot with the asset you want to use for the Covered Call. How to use the robot: Set parameters for your current structure: Purchase price of the base asset in your structure. Code of the Call you used to build your st
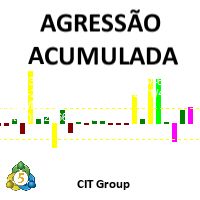
Apresentação:
- O Indicador "Agressão Acumulada" da CIT Group é um indicador especializado na bolsa brasileira (B3).
Objetivo:
- Especificamente desenvolvido para o perfil de pessoas que operam IntraDay.
Funcionamento:
- Calculado com base nos trades realizados durante o pregão, sendo atualizado a cada 1 segundo, tendo maior precisão da agressão
Funcionalidades:
- Entrega de um conjunto de parâmetros para calcular a média de agressão (Volume ou Quantidade), estes podendo ser calculado

BigPlayerRange — лучший индикатор для мини-индекса и мини-доллара | MT5 BigPlayerRange — лучший индикатор для мини-индекса и мини-доллара Используйте всю мощь BigPlayerRange — признанного лучшего индикатора для мини-индекса и мини-доллара на MetaTrader 5. Этот ключевой инструмент выделяет стратегические рыночные зоны, обеспечивая высокоточный институциональный технический анализ . Основные преимущества: Определение институциональных зон: выявляйте, где работают крупные игроки, и пред

ParabolicSAR is a multi-currency professional Expert Advisor that uses a variety of trading strategies in the foreign exchange market. Each of the individual strategies has gone through many years of development and testing on quotes with 100% simulation. Thanks to the use of several strategies for each currency pair, the Expert Advisor is successfully tested with 100% simulation of quotes over a long period of time. IMPORTANT! After the purchase please send me a private message to receive

Цена будет повышаться на 30 долларов после продажи каждых 5 копий. Первоклассный индикатор направлен на определение общего тренда рынка. Цветовая система с яркими и темными цветами призвана выявлять сильные и слабые условия рынка.
На мой взгляд, этот индикатор беспрецедентен; он отлично справляется, когда рынок начинает двигаться.
Если вы предпочитаете использовать индикатор для более длительного временного интервала, такого как 1 час, 4 часа или суточный, для достижения лучших результатов, п

An Implied Fair Value Gap (IFVG) is a three candles imbalance formation conceptualized by ICT that is based on detecting a larger candle body & then measuring the average between the two adjacent candle shadows.
This indicator automatically detects this imbalance formation on your charts and can be extended by a user set number of bars.
The IFVG average can also be extended until a new respective IFVG is detected, serving as a support/resistance line.
Alerts for the detection of bullish/be

It is 1 Minute Strategy. When Indicator Gives Signal Then Put on Buy. It's Best Work on Crash 300 & Crash 500. If you want to know anything details please Contact Me on Telegram In this Link: https://t.me/+mi_52VwFp3E4MGNl It is very nice for scalping & for who not gives enough time on market.
N/B: Please be carefully it's only for scalping & not trade all the day. It's only 10 or maximum 15 trade per day.
Thanks everyone.

简介: 六彩神龙指标【MCD Hot Money】进是一种常用的技术指标,被广泛应用于股票交易中。它由六人不同的指标组成,包括均线、相对强弱指标井、移动平均收盘线等。这人指标可以有效地帮助投资者确定股票的买入和卖出时机。 六彩神龙用来看筹码了解庄家动向。看个股买卖少踩炕,少被套;跟庄吃肉,用于判断个股趋势!
指标设置 : hot_money_sensitivity = 0.7; // Hot Money Sensitivity hot_money_period = 40; // Hot Money Period hot_money_base = 30; // Hot Money Base banker_sensitivity = 1.5; // Banker Sensitivity banker_period = 50; // Banker Period banker_base = 50;

Note: If you want to apply this indicators on indicators which are shown in a sub-window, then consider using this indicator instead: https://www.mql5.com/en/market/product/109066.  ; AIntel Predict - Your Gateway to Future Trading Success! Unlock the power of predictive analytics with AIntel Predict. Say goodbye to the guesswork and hello to improved forecasting, as AIntel Predict leverages historical data to unveil the future of your trades like never before. Whether you're a seasoned tra
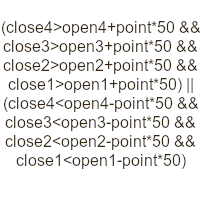
Indicator for research and finding candle bars patterns real time. Options: Alerts - Enabling alerts Push - Enable push notifications BarInd - On which bar to look for patterns for notifications (1 - formed, 0 - forming) ID - Identifier. Appended to the names of graphic objects and to the message Formula - Formula. In the bar price formula: open1, high1, low1, close1, etc. (open0, high25... any number, 0 is also possible - low0, open0...). Counting bars from right to left from zero. You can use

Индекс Higher - Lower основан на теории концепции умных денег (SMC) и является основой для анализа потока заказов. Для анализа зоны входа и точки выхода. Источник: Trading HUB 3.0 Хотя сам ICT (The Inner Circle Trader) не дал никакого названия этой стратегии, которую он придумал, его аудитория дала этой стратегии много имен и в основном была получена из слов, которые он преподавал, таких как ИКТ, которые часто говорят умные деньги, поэтому есть SMC (концепция умных денег); Когда ICT анал
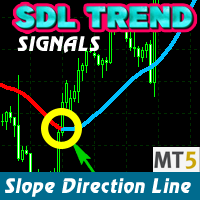
The SDL Trend Signals MT5 indicator shows the market direction with a colored moving average line. It has three inputs: Period (calculation period), Method (calculation method), and Applied price (price used for calculations).
The indicator has three buffers: Uptrend, Downtrend, and ExtMapBuffer (for indicator values). The Bullish slope is in BLUE, and the Bearish slope is in RED. For example, an upward slope indicates a Bullish market (Blue), and a downward slope indicates a Bearish market (R

Note: This indicator is for sub-window use and not for the main chart. If you need to apply it for the indicators in the main chart, then use this indicator instead: https://www.mql5.com/en/market/product/108876 AIntel Predict - Your Gateway to Future Trading Success! Unlock the power of predictive analytics with AIntel Predict. Say goodbye to the guesswork and hello to improved forecasting, as AIntel Predict leverages historical data to unveil the future of your trades like never before. Whe

Индикатор отображает уровни High и Low предыдущих дня, недели и месяца. Предназначен для определения пробоя экстремумов и определения направления входа в торговлю. Для более точного определения уровней разворота можно вывести уровни Фибоначчи. Так же есть возможность закрашивать пространство между High и Low для более наглядного отображения движения цены за предыдущий расчетный период. Есть индикация времени до закрытия текущей свечи (бара). В версии 2.0 добавлены сигналы 3-х уровней разворота
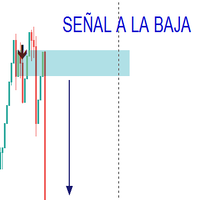
El indicador trabaja con patrones funcionales y divergentes obteniendo del mercado las mejores señales para compra y venta, ha sido testeado por 2 años mediante la estrategias personalizada. El indicador envia la señal para la compra y venta de acuerdo al analisis desarrollado en el mercado. Solo ha sido comprobado en el mercado de indice sintetico (CRASH, BOOM VOLATILITY, STEP)

In the dynamic world of financial markets, staying ahead of the curve is paramount. Traders and investors require sophisticated tools to analyze market trends, make informed decisions, and optimize their strategies. Introducing the Moving Average of Accumulation/Distribution (MAAD) Indicator – a powerful tool designed to provide insightful signals for navigating the complexities of the financial landscape. Key Features: Precision in Trend Analysis: The MAAD Indicator employs a moving average met

Этот индикатор эффективно отслеживает любые свечи других таймфреймов, которые вы хотите отслеживать на том же графике.
1. Выберите любой более высокий таймфрейм для загрузки баров на тот же график.
2. Настройте цвета и стиль свечей.
3. Выберите количество баров для рисования свечей.
4. Отслеживайте завершенные свечи более высоких таймфреймов вместе с фитилем и телом.
5. Легко и удобно для тех, кто не хочет переключать график.
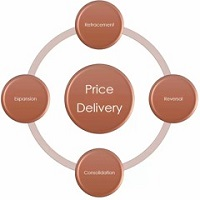
Consolidation is when price is moving inside a clear trading range. When prices are consolidated it shows the market maker placing orders on both sides of the market. This is mainly due to manipulate the un informed money. This indicator automatically identifies consolidation zones and plots them on the chart. The method of determining consolidation zones is based on pivot points and ATR, ensuring precise identification. The indicator also sends alert notifications to users when a new consolida

The Hurst Exponent gauges a time series' long-term memory and is named after Harold Edwin Hurst. The MetaTrader's Hurst Exponent Indicator analyzes an asset's price memory, helping predict future trends. It's valuable for traders of all levels, suitable for various styles like scalping or swing trading.
In Forex terms, the Hurst Exponent measures a series' dependence, indicating whether it regresses to the mean or clusters in a direction. H values between 0.5-1 suggest positive autocorrelation

MT5 RSI Experiment: This indicator leverages the Relative Strength Index (RSI) and floating levels to pinpoint potential buy and sell signals.
The code uses enums for prices and RSI calculation methods. These enums define indicator parameters.
Input variables include RSI period, price type for RSI calculation, smoothing method, and look-back period with levels for floating levels.
Index buffers store RSI fill, RSI up line, RSI middle line, RSI down line, and trend line data.
For each bar, i
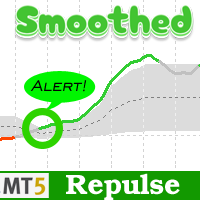
Smoothed Repulse Alert MT5 Indicator
The Smoothed Repulse Alert for MT5 is a powerful tool that visualizes market pressure through a filled area chart and two lines in a separate window. This indicator is based on the repulse indicator, assessing buying and selling pressure using high, low, open, and close prices over a specified period.
Key Features: - Customizable parameters include repulse period, moving average type, moving average multiplier, level period, upper and lower levels. - Color

This indicator builds upon the previously posted Nadaraya-Watson smoothers. Here we have created an envelope indicator based on Kernel Smoothing with integrated alerts from crosses between the price and envelope extremities. Unlike the Nadaraya-Watson estimator, this indicator follows a contrarian methodology.
Please note that by default this indicator can be subject to repainting. Users can use a non-repainting smoothing method available from the settings. The triangle labels are designed so

Elliott Wave Principle, developed by Ralph Nelson Elliott , proposes that the seemingly chaotic behaviour of the different financial markets isn’t actually chaotic. In fact the markets moves in predictable, repetitive cycles or waves and can be measured and forecast using Fibonacci numbers. These waves are a result of influence on investors from outside sources...

Scalping and Binary Signal Detector - Скальперский индикатор дающий направленные сигналы для открытия позиций по тренду.
Индикатор представляет собой полную торговую систему, которую можно использовать для Forex и бинарных опционов.
Система алгоритмов позволяет распознавать интенсивные движения цены в несколько последовательных баров.
Индикатор предоставляет несколько типов оповещений для стрелок.
Работает на любых торговых инструментах и тайм-фреймах (рекомендуется M5 или Выше).
Как использ

Forex traders often observe increased market activity near Supply and Demand zones, which are levels formed based on zones where strong price movements have previously occurred.
The Supply Demand Strong Weak Confirm Indicator utilizes fractals and the ATR indicator to identify and plot support and resistance zones on the price chart. These zones are categorized as follows:
- Weak: significant high and low points in the trend. - Untested: crucial turning points in the price chart that the pric
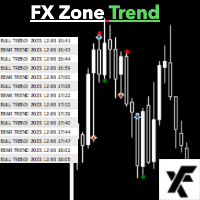
Разблокируйте свой торговый потенциал с FX Zone Trend - простым путем к прибыли! Почему выбирать FX Zone Trend? Упрощенная торговля: Никаких сложных графиков или запутанных индикаторов. FX Zone Trend дает четкие сигналы для легкого принятия решений. Универсальность в основе: Будь вы опытным трейдером или только начинающим, FX Zone Trend дополняет любую торговую стратегию. Создайте свой уникальный подход или используйте его как дополнительный уровень подтверждения. Ваша стратегия,

Ai Trend Spotter (D Originals).
Падение Форекса.
Мы часто спрашиваем: " Как брокерские компании зарабатывают деньги? ", и отмечаем любые небольшие выигрышные сделки с нашей стороны.
Но после использования (D Originals) вы спросите себя: "Как я стал богатым в одночасье?" .
Настолько глубоко, действие говорит громче, чем голос.
С Ai Trend Spotter не бойтесь:
*Манипулирование рынком *Разворот рынка * Снайперский вход и существование *Прыжок со свечой
Индикатор предназначен для каждой па
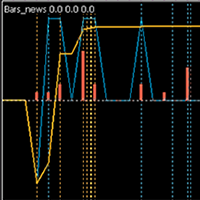
Индикатор новостей, привязанных к бару. Публикуемое актуальное значение новости имеет характеристику влияния на валюту к которой относится: позитивное, негативное, нейтральное . Индикатор суммирует все эти значения за выбранный период с учетом важности новости: высокой, средней, низкой . В результате рассчитывается процент для валютной пары, который показывает новости какой валюты доминируют. Если значение положительное, значит пара имеет давление новостей в сторону BUY, если отрицательное - SE

Введение в Smart Engulfing MT5:
Войдите в мир изысканной торговли с Smart Engulfing MT5 - вашим профессиональным индикатором для выявления высококлассных моделей поглощения. Разработанный с учетом точности и простоты использования, этот инструмент создан исключительно для пользователей MetaTrader 5. Обнаруживайте прибыльные торговые возможности легко, поскольку Smart Engulfing MT5 направляет вас с помощью оповещений, стрелок и трех различных уровней прибыли, делая его идеальным спутником для тр

This is my trusted friend of trading.
So... I musted re-write this in MQL5 to use in brokers where there is only MT5.
The indicator is like a mother-in-law, who talks often, talks a lot and often inappropriately.
The indicator, in addition to giving us an entry signal on parameters which I will then list, monitors the trend of the hourly timeframe, OSMA to understand the entry direction, RSI to sense any overbought or oversold conditions from which to abstain, ATR for the volatility and ADX fo
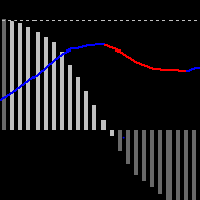
This indicator shows the MACD line and the difference WMACD - MACD to it. that is, the divergence between price and weighted acceleration. Divergence is shown with a histogram. It took a bit of math to get a readable result.
What does the histogram say?
If the course is consistent with the price movement, then the price is driven by volumes. It is passing through an area of higher liquidity, the market is being manipulated by strong money. Within Wyckoff's theory, these are typically climax and

Introducing FX Zone Custom Time OHLC Candle - Your Effortless Solution for 1-Minute Chart Analysis! Unleash the Power of Precision with Simplicity! Are you tired of complex indicators that clutter your charts? Meet FX Zone Custom Time OHLC Candle, a user-friendly tool designed for traders who value simplicity and precision in their 1-minute chart analysis. Key Features: Easy and Intuitive: Navigate effortlessly with a clean interface, making chart analysis a breeze. Custom Time OHLC

Introducing the Ultimate Custom Time Range Indicator: Unlock Precision in Your Trading Strategies! Versatile Applications: Ideal for kill zones, trading sessions, and time macro analysis, silver bullet timings. You can have as many time ranges as you need to help identify the highest to lowest range within the specified start to end broker time. Note: most brokers operate in GMT +3 - so please convert and use your own broker time.
SimSim Arrow BEAR это стандартный "Bears Power" индикатор, но стрелочной версии. Версия для MetaTrader 4
Параметры индикатора аналогичны стандартным, плюс один дополнительный параметр Delta .
Delta = 0 - 100 Deviations as of the Zero value. Изменение уровня нуля индикатора, Возможны плюс и минус. Индикатор формирует сигнал когда цена пересекает нулевую линию +- Delta.
Включите для работы "CONTROL DEAL" и сделки по сигналу индикатора, будут открыты автоматически.
Вы можете испо

Индикатор Priuce Spectrum раскрывает возможности детального анализа рынка.
Преимущества: Создание профиля объемов рынка: Индикатор помогает анализировать динамику объемов торгов на рынке. Это позволяет трейдерам выявлять важные уровни поддержки и сопротивления, а также определять структуру рынка. Фильтрация несущественных объемов: Использование индикатора помогает отфильтровывать несущественные объемы, позволяя трейдерам сосредотачиваться на более значимых движениях рынка. Гибкая система настр

Fibonacci Master Pro is an advanced Fibonacci projection indicator designed to optimize your trading strategies. It incorporates the principles of Fibonacci technical analysis, providing precise projections and entry and exit opportunities in the market.
Fibonacci Master Pro draws upward and downward Fibonnaci Projections based on the maximum and minimum value of the candle you specify.
Key Features :
**Accurate Projections:** Using sophisticated algorithms, Fibonacci Master Pro calcula
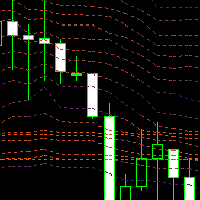
Market Profile, Volume Profile? Extra paid in TradingView, displayed for the last moment in time or discreetly, e.g. after 24 hours. Counting super-accurate values from a histogram...?
None of these ways suited me. I was looking for an expression of the dynamics of the market, its liquidity, I just wanted to clearly see where the money was flowing. I thought I would calculate the volume weighted price percentiles for a certain period.
To make the calculation more accurate, I calculate from a low

Hello, In this indicator, I started with a simple moving average crossover algorithm. However, in order ot get more succesfull results, I created different scenarios by basin the intersections and aptimized values of the moving averages on opening, closing, high and low values. I am presenting you with the most stable version of the moving averages that you have probably seen in any environment. We added a bit of volume into it. In my opinion, adding the Bollinger Band indicator from the ready-

All about time and price by ICT. This indicator provides a comprehensive view of ICT killzones, Silver Bullet times, and ICT Macros, enhancing your trading experience. In those time windows price either seeks liquidity or imbalances and you often find the most energetic price moves and turning points. Features: Automatic Adaptation: The ICT killzones intelligently adapt to the specific chart you are using. For Forex charts, it follows the ICT Forex times: In EST timezone: Session: Asia: 20h00-0

Cobra Pivot Points — это индикатор для построения наиболее оптимизированных точек разворота, который вы можете протестировать самостоятельно, загрузив ДЕМО-версию.
1. Выберите два лучших режима поворота: повороты Cobra или повороты Camrilla.
2. Вы можете использовать любой таймфрейм, не ограничиваясь D1.
3. Вы можете играть со значением High Low Close предыдущего дня с помощью параметра Shift. 1 = предыдущий бар, 2 = бар перед предыдущим баром и так далее. Этот параметр поможет вам в исследов
SimSim Arrow ADX это стандартный "Average Directional Movement Index" индикатор, но стрелочной версии. Версия для MetaTrader 4
Параметры индикатора аналогичны стандартным. Включите для работы "CONTROL DEAL" и сделки по сигналу индикатора, будут открыты автоматически. Вы можете использовать индикатор по его прямому назначению, как верный сигнализатор.
Однако, его вторичное предназначение заключается в том, чтобы служить поставщиком сигналов для утилиты " CONTROL DEAL " .
Симбиоз между индик

Марли Индикатор: Точная Торговля в MT5 Повысьте свой трейдинг с помощью индикатора Марли, разработанного для исключительной точности сигналов как в MT4, так и в MT5. Этот универсальный инструмент оптимизирован для рынков криптовалют и форекса, предлагая точность и гибкость в вашей торговой стратегии. Бесшовная интеграция с MT5: Для пользователей платформы MT5 индикатор Марли полностью совместим и доступен здесь. Оптимизирован для рынков криптовалют и форекса: Превосходство в Криптовалютах :
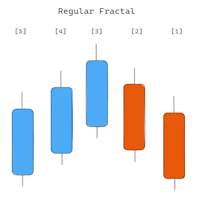
The indicator shows Fractals from the higher timeframe. It is possible to display two types of Fractals: 'Regular Fractal' and 'BW Fractal'. Consider the formation of the Fractal 'UP'. 'Regular Fractal' is a very strict Fractal in which each subsequent 'high' price (to the left and right of the central bar) is smaller. Whereas in 'BW Fractal' there is only one condition: the central bar (its price 'high') must be the highest. Visually, the difference between these two modes can be seen in diagr

Right hand очень точно воспроизводит колебания цены. Когда рынок растет, кривая Right hand идет вверх. Хотя иногда бывает так, что кривая идет вверх, в то время как цена консолидируется и нет тренда вверх. Аналогично, когда рынок падает, кривая тоже убивает, исключения возникают так же в зоне консолидация рынка. Анализ большого количества графиков Индекса Направленнрго Тренда ( DTI )позволяет выявить его специальные характеристики, полезные при отслеживании тренда. В положительной области т.е

The "ZScore Quantum Edge" is based on an advanced algorithm that combines volume analysis and price movement, providing a clear and accurate representation of market trends. Key Features: In-Depth Trend Analysis : The indicator uses a configurable period for trend analysis, allowing traders to adjust the indicator's sensitivity according to their trading strategies. Data Smoothing : With an adjustable range for data smoothing, the "ZScore Quantum Edge" offers a clearer view of the market, minimi

Operating Principle: The "RSDForce" merges trading volume analysis and price movements to provide valuable market insights. Here's how it works: Volume and Price Analysis : The indicator examines the trading volume (quantity of traded assets) and price variations over time. Market Force Calculation : It calculates a value that reflects the market's 'force', indicating whether the price trend is strong and based on substantial trading volume. Simple Visualization : The result is displayed as a li

Наша инновационная панель Basic Candlestick Patterns Dashboard специально разработана для автоматического определения прибыльных свечных моделей на графике. Эта панель использует передовые алгоритмы для сканирования ценовых графиков в режиме реального времени и выявления широкого спектра свечных моделей, от классических до сложных. Кроме того, он имеет простой в использовании интерфейс, который позволяет визуализировать обнаруженные паттерны на различных таймфреймах, что облегчает принятие
MetaTrader Маркет - лучшее место для продажи торговых роботов и технических индикаторов.
Вам необходимо только написать востребованную программу для платформы MetaTrader, красиво оформить и добавить хорошее описание. Мы поможем вам опубликовать продукт в сервисе Маркет, где его могут купить миллионы пользователей MetaTrader. Так что занимайтесь только непосредственно своим делом - пишите программы для автотрейдинга.
Вы упускаете торговые возможности:
- Бесплатные приложения для трейдинга
- 8 000+ сигналов для копирования
- Экономические новости для анализа финансовых рынков
Регистрация
Вход
Если у вас нет учетной записи, зарегистрируйтесь
Для авторизации и пользования сайтом MQL5.com необходимо разрешить использование файлов Сookie.
Пожалуйста, включите в вашем браузере данную настройку, иначе вы не сможете авторизоваться.