Смотри обучающее видео по маркету на YouTube
Как купить торгового робота или индикатор
Запусти робота на
виртуальном хостинге
виртуальном хостинге
Протестируй индикатор/робота перед покупкой
Хочешь зарабатывать в Маркете?
Как подать продукт, чтобы его покупали
Технические индикаторы для MetaTrader 5 - 85

Buy CTS scalping indicator, provide buying and selling signals, automatic channeling and sending signals to mobile phones
Using technical analysis and price action methods and modern methods, CTS indicator can draw price channels and recognize price trends with high accuracy and issue entry and exit signals according to them. Traders can easily fluctuate using this indicator in different time frames and in different markets. With the CTS indicator, you can signal in different ways. This indicato

Индикатор Chapon Channel - это классический канальный индикатор, который позволяет трейдеру реагировать на выход цены за границы установленного канала. Этот канал формируется на основе анализа нескольких свечей, начиная с последней, чтобы определить экстремумы в рассматриваемом промежутке. Эти экстремумы затем используются для построения линий канала.
Торговля в канале является одной из наиболее популярных стратегий на рынке Форекс, благодаря её простоте даже новички могут использовать этот ме
Buy DEMA 3 Scalp Indicator, Signaling and Trend Finder for Forex DEMA 3 indicator is a professional indicator for finding trends as well as finding entry and exit points for a symbol. This indicator is designed based on the DEMA indicator, which can tell you the signals accurately and quickly. The DEMA 3 indicator can give you accurate and early entry points for swings. Features of the DEMA indicator 3
Receive signals as notifications on the Metatrader mobile application. Receive signals by ema
Индикатор линейной регрессии с искусственным интеллектом: Линейная регрессия — это простой, но эффективный метод искусственного интеллекта, который лежит в основе сложных нейронных сетей. Этот индикатор построен на основе анализа линейной регрессии и пытается делать прогнозы относительно предстоящего события на рынке. Входы: train_bars: контролирует количество баров, на которых информация о ценах будет собираться и использоваться для обучения ИИ внутри него. Чем больше это значение, тем лучше, а

The best quality application of the famous Super Trend indicator that requires no introduction. It is completely faithful to the original algorithm and powered by the CCI indicator.
- easy to trade - It implements all kinds of warnings. - It implements a multi-timezone dashboard. - It cannot be repainted or backpainted.
Input parameters - ATR Period – This is the average true range period. - ATR Multiplier - The ATR multiplier that defines the trend. - CCI - Makes trend following powerful. - M
About:
Introducing the "Median Proximity Percentile" developed by AlgoAlpha, a sophisticated trading indicator engineered to augment market analysis. This tool adeptly monitors the proximity of median prices over a designated historical period and delineates its percentile position amidst dynamically evolving standard deviation bands. It furnishes traders with invaluable insights essential for well-informed decision-making.
Features: Color-Coded Visuals: Facilitate intuitive comprehension of
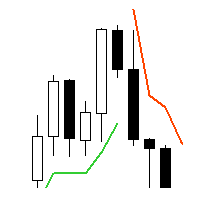
Supertrend - невероятно мощный и универсальный индикатор, предназначенный для помощи трейдерам в определении текущего тренда на конкретном торговом инструменте. С помощью двух встроенных индикаторов, Average True Range и Standard Deviation, трейдеры могут выбрать наиболее подходящий индикатор для своей стратегии торговли. Пользователи также могут настроить период этих индикаторов и выбрать цену (Close, High, Low, Open, Weighted), к которой он должен быть применен, с Typical price в качестве опци

Heikin Ashi Heikin Ashi is a charting technique that can be used to predict future price movements. It is similar to traditional candlestick charts. However, unlike a regular candlestick chart, the Heikin Ashi chart attempts to filter out some of the market noise by smoothing out strong price swings to better identify trend movements in the market.
To create Heiken Ashi, a formula is used in which price data is entered, while ordinary candles are built only on bare numbers, without using any c

An invention that will turn your working principles upside down.
Especially in horizontal and stagnant markets, annoying losses can occur.
Besides, following trend lines, support and resistance can be tiring.
To put an end to all this, I decided to create a professional "moving average" indicator.
All you have to do is follow the colors.
If you need additional support, I recommend the "Heiken-Ashi" candle indicator in my profile.
I wish you lots of profit..

The RSI Advanced tool will help traders capture trends and optimal entry points by:
- Enter a Buy order when the green line crosses the yellow line. Provided that the yellow line is near line 32 or 20 - Enter a Sell order when the green line crosses the yellow line. Provided that the yellow line is near line 68 or 80
Additionally, you can combine it with the convergence divergence that occurs at the green line.
**When you purchase the Mastering the RSI MT4 or Mastering the RSI MT5 indicator,

Description: Dimatis Watchtower is a powerful backtesting tool designed for traders seeking for an efficient way to test and optimize their trading strategies on the MetaTrader 5 platform. With a minimalist interface and advanced features, this tool provides an outstanding solution for evaluating the performance of your strategies in various market conditions. Key Features: Backtesting: Perform precise and reliable backtests of your strategies using historical data from your broker directly on M

StartPoint是一个很好的短线交易指示器,这个指标可以单独使用,但是最好是配合 HighQualityMap 一起使用,适用于任何时间框架,喜欢超短线的朋友可以使用M5时间框架。它能很好的体现出短期趋势的启动点,你可以很快的从这个指示器上寻找到最佳的buy和sell位置,同时也能很好根据指示器去坚守自己的持仓定订单。指标不含有未来函数,不会重新绘制,不仅能够应用到自己的手动交易过程中,还能完全可以写入到自己的EA中。(如果你感觉到这个指标能够帮助你进行更准确的交易,请帮忙给个好评,希望我的作品能够帮助更多有需要的人) ===================参数列表===================== 所有参数均采用默认参数即可,无需更改,若为激进型交易者,可以根据自己的需要来调整参数。 =================参考使用方法=================== 此指标可以适用于任何交易品种。

Индикатор Source Trend : Мощное Средство для Анализа Рынка!
Преимущества: Обнаружение Тенденций: Индикатор Source Trend поможет вам незамедлительно выявить направление движения цены и понять взаимодействие между покупателями и продавцами. Универсальность: Работает на всех таймфреймах и с любыми валютными парами, обеспечивая гибкость и адаптацию к различным рыночным условиям. Точные Сигналы: Предоставляет достоверные сигналы как на трендовых, так и на флетовых рынках, помогая принимать информир

PricePulse Pro - Индикатор простых решений! Использование этого индикатора очень просто - просто следуйте за цветными стрелками на графике. Алгоритм индикатора учитывает дневные колебания цены и фокусируется на измерении "свечной" доли в тренде.
Этот индикатор использует алгоритм, который учитывает изменения цен, основанные на различных параметрах, таких как H/C (высшая цена/закрытие), H/O (высшая цена/открытие), LC (низшая цена/закрытие), LO (низшая цена/открытие). Это позволяет получить боле

Индикатор Spread Pulse - это эффективный инструмент, который предоставляет трейдерам информацию о текущем спреде на графике. Спред - это разница между ценой покупки и ценой продажи инструмента.Индикатор представлен в виде текста, который отображается на графике. Это позволяет трейдеру легко отслеживать текущий спред. Один из главных преимуществ индикатора Spread Pulse заключается в его цветной визуализации. В зависимости от размера спреда, цвет текста изменяется. По умолчанию, при маленьком
SimSim Arrow CCI это стандартный "Commodity Channel Index" индикатор, но стрелочной версии. Версия для MetaTrader 4 Параметры индикатора аналогичны стандартным, плюс один дополнительный параметр Delta .
Delta = 0 - 100 Deviations as of the Zero value. Изменение уровня нуля индикатора. Индикатор формирует сигнал когда цена пересекает линию уровня ноль +- Delta.
Включите для работы "CONTROL DEAL" и открывайте сделки по этому сигналу. Вы можете использовать индикатор по его прямому назначению, к
Supertrend is a trend following indicator based on the Average True Range (ATR) . Calculating the odd line combines trend detection and volatility. It can be used to detect changes in trend direction and position stops.
Basic knowledge Supertrend is a trend following indicator. It takes up space on the main chart and its plots show the current trend. A Supertrend can be used for varying durations (daily, weekly, intraday, etc.) and varying instruments (stocks, futures or forex). Supertr
Introducing the Reversal and Breakout Signals
This innovative tool is crafted to enhance your chart analysis by identifying potential reversal and breakout opportunities directly on your charts. It's designed with both novice and experienced traders in mind, providing intuitive visual cues for better decision-making. Let's dive into the key features and how it operates:
### Key Features:
Dynamic Period Settings: Customize the sensitivity of the indicator with user-def

Индикатор PriceActionOracle значительно упрощает процесс принятия торговых решений, предоставляя точные сигналы о разворотах на рынке. Своей основой он использует встроенный алгоритм, который не только распознает возможные развороты, но и подтверждает их на уровнях поддержки и сопротивления. Этот индикатор воплощает в себе концепцию цикличности рынка в разновидности технического анализа.
PriceActionOracle отслеживает рыночный тренд с высокой степенью надежности, игнорируя краткосрочные флуктуа

Introduction
One of the patterns in "RTM" is the "QM" pattern, also known as "Quasimodo". Its name is derived from the appearance of "Hunchback of Notre-Dame" from Victor Hugo's novel. It is a type of "Head and Shoulders" pattern.
Formation Method
Upward Trend
In an upward trend, the left shoulder is formed, and the price creates a new peak higher than the left shoulder peak . After a decline, it manages to break the previous low and move upward again. We expect the price to

Индикатор VolatilityVanguard основан на анализе длинной и короткой волатильности цены. Он помогает определить точки входа на рынок, отображая стрелками благоприятные моменты входа. Этот индикатор можно использовать как фильтр в торговле или как инструмент, показывающий точное направление тренда. Он подходит как для скальпинга на малых временных интервалах, так и для долгосрочной торговли. Важно помнить, что успешная торговля требует комплексного подхода, и для входа на рынок необходима дополнит

Индикатор Pivot Point Pioneer основан на уникальных индикаторах, способных обнаруживать экстремумы. Он идеально подходит для выявления разворотов или резких движений цены в одном направлении. Благодаря этому индикатору вы будете проинформированы о предстоящих событиях: синяя точка появится при сигнале на покупку, а красная - на продажу.
Этот технический индикатор позволяет оценить текущее состояние рынка и принять решение о входе в трендовое движение с минимальным риском. Он использует процесс

Certainly! Let’s discuss the RSI Rush , an aggressive momentum indicator that combines weighted moving averages (WMAs) at lows, mid-price, and tight highs. Here are the key components: Weighted Moving Averages (WMAs) : The RSI Rush employs three WMAs: WMA at Lows : Calculated based on the lowest prices during a specific period. WMA at Mid-Price : Considers the average price (midway between highs and lows) during the same period. WMA at Tight Highs : Based on the highest prices during the speci

up down v6 for mt5 is no repaint all timeframe and all pairs indicator. red histogram cros trigger that is up point,and put a red point on histogram. and blue histogram cros trigger that is deep point.and put blue point on histogram. this indicator need to sometimes zoom out .for thise pres + button. if newly comes signal is too high makes before invisible.red and blue points are there.to see the signals. indicator is no repaint and can use all time frame and all pairs. only need minimum 500 bar

Breakouts with strong momentum are challenging to catch. The purpose of the Super Breakouts Monitor is to identify such market conditions. This indicator is inspired by a concept from renowned Technical Analyst Tushar Chande, who combines two highly adaptive indicators, VIDYA and the Dynamic Momentum Index (both his creations), to capture the early stages of a successful breakout. At Minions Labs, we've added our unique enhancements to adapt these great ideas for modern markets like stocks, cryp

Moving Average Scanner — это многокадровый сканер, который идеально подходит для быстрого просмотра тренда на нескольких таймфреймах без изменения графика.
Он может использовать до 4 скользящих средних по вашему выбору за 9 единиц времени. Он полностью настраиваемый и может быть перемещен в любое место графика простым «перетаскиванием».
Скользящие средние можно настроить в 4 различных методах расчета. Вы также можете установить оповещения на основе количества скользящих средних и количества пе
Trend Chart Histogram — индикатор, основанный на алгоритме с использованием двух скользящих средних и нескольких осцилляторов. Благодаря цветовому коду он позволяет быстро определить тенденцию и воспользоваться крупнейшими рыночными импульсами. Светлые цвета указывают на тренд, темные цвета определяют импульсы, а серый указывает на то, что вам не следует входить в рынок.
Версия для МТ4 здесь.
Входные параметры: - Период 1 (быстрый период) - Период 2 (медленный период) - Период осциллятора
Вы

Представляем NakaSide - ваш идеальный индикатор рыночных возможностей!
Вы устали упускать прибыльные торговые возможности? Готовы ли вы взять свои торговые операции на новый уровень? Тогда не ищите далее, потому что NakaSide здесь, чтобы революционизировать ваш подход к торговле!
NakaSide - это не просто еще один обычный индикатор; это ваше секретное оружие для навигации в сложном мире финансовых рынков с уверенностью и точностью. Благодаря своим передовым алгоритмам и передовым технологиям,

indicator seems to be a sophisticated tool for trend analysis in financial trading. It utilizes Bollinger Bands with an exponential method and color-coding to indicate the current trend direction—whether it's with the trend (bullish) or against it (bearish), as well as using the intermediate color, blue, to suggest a potential trend reversal.
Additionally, the indicator uses a total of six tracks—upper band, upper band EMA, middle band, middle band EMA, lower band, and lower band EMA—to assess

1. CONSTITUTION Goby Momentum is a momentum indicator based on the Stoch. It consists of one momentum oscillator and three floating levels (upper, middler, lower). The inputs can be used to adjust the oscillator, the floating levels and the alert signals. It is designed for the MT5 platform only. 2. OPERATION CONDITIONS Buy signal: Goby [dotted line] crosses one of the levels crosses from bottom to top . Sell signal: Goby [dotted line] crosses one of the levels crosses from top to bott

Представляем Volatility Doctor RSI, новаторский инструмент, созданный на основе надежного индикатора RSI, призванный улучшить ваш опыт торговли как никогда прежде.
Наш индикатор не только предоставляет текущие показатели RSI в реальном времени, но также точно прогнозирует, где будет находиться показатель RSI через 10 шагов в будущем на выбранном вами интервале времени и любом предпочтительном символе для торговли.
Адаптивный Интеллект: Этот инструмент учится и настраивается под любой рынок, бе

BS Time Band是一个很好的波段交易指示器,这个指标可以单独使用,但是最好是配合 StartPoint 一起使用效果更好,适用于任何时间框架,非常适合喜欢做波段交易的朋友。它能很好的体现出一个波段的完整信息,你可以很快的从这个指示器上寻找到最佳的预警区域,然后配合 StartPoint 找到最佳的buy位置和最佳的sell位置,也能很好根据指示器去坚守自己的持仓定订单。指标不含有未来函数,不会重新绘制,不仅能够应用到自己的手动交易过程中,还能完全可以写入到自己的EA中。(如果你感觉到这个指标能够帮助你进行更准确的交易,请帮忙给个好评,希望我的作品能够帮助更多有需要的人) =================参考使用方法=================== 此指标可以适用于任何交易品种。 做波段建议参数 timeFame:M5 如果配合 StartPoint 建议 StartPoint 的参数为(240,60)

Сверхбыстрое распознание параболических каналов ( а также линейных, горизонтальных и волнообразных) на всей глубине истории, создавая иерархию каналов. Необходима настройка: Max bars in chart: Unlimited Данный индикатор предназначен в первую очередь для алгоритмического трейдинга, но можно использовать и для ручной торговли Данный индикатор будет иметь в ближайшем будущем очень активную эволюцию и подробные описания, как применять для создания роботов
I’m excited to introduce the Trading Cycle Array indicator, inspired by the fifth bar on Martin Armstrong’s Forecast Array. This powerful tool brings to life a transverse form of cyclical frequency analysis, providing traders with a unique and visually intuitive way to forecast market behavior.
What It Does The Trading Cycles Indicator identifies cyclical highs and lows across time using a color-coded system: Green : Indicates the ideal time for market highs (bullish cycles). Red : Ind

Подписывайтесь на канал MA7 Trading для получения уведомлений о новых программах, обновлениях и другой информации. Задавайте вопросы через профиль на MQL5 .
Описание работы Индикатор MA7 Clover основан на свечных формах. Показывает свечной паттерн «Пин-бар». Подробная информация о индикаторе MA7 Clover .
Настройки индикатора General settings – общие настройки: Min body size – минимальный размер тела, проценты; Max body size – максимальный размер тела, проценты; Min nose size – минимальный раз
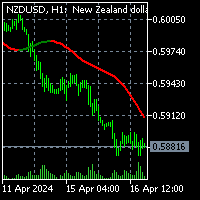
To download MT4 version please click here. - This is the exact conversion from TradingView: "Sentiment Range Ma" By "ChartPrime". - This is a non-repaint and light processing load indicator - You can message in private chat for further changes you need. - All input options are available. - Buffers are available for processing within EAs. - Highlight option is omitted as does not show good in Metatrader.

To download MT4 version please click here .
- This is the exact conversion from TradingView: " PA-Adaptive Hull Parabolic " By "Loxx".
- This is a non-repaint and light processing load indicator
- You can message in private chat for further changes you need.
- All input options are available.
- Buffers are available for processing within EAs.
- Highlight option is omitted as does not show good in Metatrader.

This DYJ PowerSignalSource is a complete trading system based on ATR technical indicators. This indicator will analyze and record the trend intensity of each cycle and current currency pair from M1-MN
DYJ PowerSignalSource creates a trend intensity and entry point signal list display by evaluating this data. When the trend percentage reaches 75% or greater, we consider it a strong currency. If the trend intensity percentage reaches 100%, we consider it the strongest, and a warning will pop up

Сканер Bollinger Bands Multicurrency Scanner Dashboard MT5 — это универсальный торговый инструмент, предназначенный для мониторинга торговых сигналов по множеству валютных пар и таймфреймов с использованием полос Боллинджера. Он организует сигналы в интуитивно понятном табличном формате, отображая статус каждого символа по таймфреймам от M1 до MN1. Трейдеры могут включать или отключать определенные таймфреймы в соответствии со своими стратегиями. Инструмент отображает сигналы на основе следующи
Индикатор RSI Pro Analyser — это мощный инструмент, предназначенный для трейдеров, стремящихся принимать обоснованные решения одновременно на нескольких таймфреймах. Этот индикатор использует RSI для предоставления сигналов перекупленности , перепроданности и тренда, что упрощает определение возможностей входа в рынок. Его главным преимуществом является простота чтения благодаря четким и четким цветовым кодам, обозначающим различные рыночные условия.
Индикатор отображает значения RSI и связанны

Savia Forex Pro Indicator (MT5) The Savia Forex Solutions Forex Pro Indicator gives you highly accurate entries on all Forex/Currency pairs, Indices and Cryptocurrencies. The Forex Pro Indicator is dynamic and powerful and is optimized for all timeframes and ALL Currency pairs, Indices, Commodities, and Cryptocurrency pairs. Trade with improved confidence and maximize your success rate. Benefits Dynamic and Powerful. Forex Pro Indicator is fully optimized for all chart timeframes. Forex Pro Indi

Boom and Crash Pro Indicator The Savia Forex Solutions Boom and Crash Pro Indicator gives you highly accurate entries on all Boom and Crash Indices. The Boom and Crash Pro Indicator is dynamic and powerful and is optimized for all timeframes. Trade with improved confidence and maximize your success rate. Benefits Dynamic and Powerful. Boom and Crash Pro Indicator is fully optimized for all chart timeframes. Whether price action is an uptrend, downtrend or trading sideways, Boom and Crash Pro Ind
Сканер ADX Multicurrency Scanner Dashboard MT5 — это мощный торговый инструмент, разработанный для трейдеров, желающих одновременно отслеживать несколько валютных пар и таймфреймов с использованием индекса среднего направления (ADX). Он упрощает процесс отслеживания рыночных трендов, выявления сигналов сходимости и получения уведомлений в реальном времени, что делает его незаменимым активом для стратегий, основанных на ADX. Панель организует сигналы в интуитивно понятном табличном формате, отобр
Сканер CCI Multicurrency Scanner Dashboard MT5 — это надежный торговый инструмент, предназначенный для мониторинга сигналов по множеству валютных пар и таймфреймов с использованием индекса товарного канала (CCI). Он предоставляет упрощенный табличный интерфейс, который организует сигналы по символам и таймфреймам, от M1 до MN1. Пользователи могут включать или отключать определенные таймфреймы, чтобы сосредоточиться на предпочитаемых стратегиях, обеспечивая эффективный и целенаправленный анализ р

The DYJ StochasticSignalSource is displayed as two lines. The main line is called %K. The second line, called %D, is a Moving Average of %K. The %K line is usually displayed as a solid line and the %D line is usually displayed as a dotted line. There are several ways to interpret a Stochastic Oscillator. four popular methods include: Buy when the Oscillator (either %K or %D) falls below a specific level (for example, 20) . Sell when the Oscillator rises above a specific level (for example, 80)
Сканер MACD Multicurrency Scanner Dashboard MT5 — это комплексный инструмент для отслеживания сигналов по множеству валютных пар и таймфреймов с использованием индикатора схождения-расхождения скользящих средних (MACD). Он организует сигналы в табличном формате, отображая статус каждого символа по таймфреймам от M1 до MN1. Трейдеры могут включать или отключать определенные таймфреймы для фокусировки на своих стратегиях. Версия для MT4 доступна здесь: MACD Multicurrency Scanner MT4 Для подробной

Volatility Index Pro Indicator The Savia Forex Solutions Volatility Index Pro Indicator gives you highly accurate entries on all Volatility Indices and Jump Indices. The Volatility Index Pro Indicator is dynamic and powerful and is optimized for all timeframes. Trade with improved confidence and maximize your success rate. Benefits Dynamic and Powerful. Volatility Index Pro Indicator is fully optimized for all chart timeframes. Volatility Index Pro Indicator works with Volatility Indices and Jum

Welcome to the future of trading! Are you ready to elevate your trading game to new heights? Introducing a groundbreaking trading indicator that is set to redefine the way you approach the markets. With its unparalleled features and cutting-edge technology, this indicator is not just another tool in your arsenal – it's your secret weapon for success. Imagine having access to real-time alerts that keep you ahead of the curve, ensuring you never miss a lucrative opportunity. Picture a tool that

Smart Sniper Entry Spike Detector
Advanced AI-Powered Spike Detection for Boom and Crash Markets
Here are my Socials, make sure you contact me to see How I Use The Spike Detector:
Free Telegram Group: https://t.me/+4jj1artnc_1mMzM8 WhatsApp: https://wa.me/+27659660169 Official Website: https://smartsniperentry.site
The Smart Sniper Entry Spike Detector harnesses cutting-edge artificial intelligence to identify high-probability trading opportunities in Boom and Crash synthetic indices. De

Технический индикатор — TrendGenius , строится на значениях статистических показателей торговли. Он позволяет прогнозировать будущую стоимость актива. Расчеты проводятся по определенному алгоритму на основании данных о котировках за некоторый период. Инструмент создан для упрощения технического анализа и применяется на разных рынках и биржах, включая криптовалютные.
Смена направления, с точки зрения рыночного фундамента, означает смещение торгового интереса в сторону продавцов или покупател

SmartTrend Analyzer - это надежный индикатор без перерисовки, который заинтересует любого трейдера.
SmartTrend Analyzer - это инструмент, который проводит анализ всех пяти аспектов (цены открытия, максимума, минимума, цены закрытия и объема) на основе математических вычислений. С помощью алгоритма форекс-индикатора SmartTrend Analyzer вы быстро сможете определить, какая тенденция развивается на рынке в данный момент. Технический индикатор SmartTrend Analyzer строится на графике в виде набора

Наш индикатор Basic Support and Resistance - это решение, необходимое для повышения технического анализа.Этот индикатор позволяет вам проектировать уровни поддержки и сопротивления на диаграмме/ версия MT4
Особенности
Интеграция уровней Fibonacci: с возможностью отображения уровней Fibonacci наряду с уровнями поддержки и сопротивления, наш показатель дает вам еще более глубокое представление о поведении рынка и возможных областях обращения.
Оптимизация производительности: При возможности о

Индикатор "Trend Orbital" представляет собой инструмент для отслеживания тренда на рынке финансовых активов. Он основан на анализе ценовых данных и обеспечивает визуальную интерпретацию текущего направления движения цены.
Параметры: InpAmplitude: Амплитуда - определяет размер волатильности, который индикатор учитывает при определении тренда. Группа "Arrow" (Стрелка): InpCodeUpArrow: Код стрелки вверх - определяет символ стрелки для отображения вверхущего тренда. InpCodeDnArrow: Код стрелки вни

This indicator is used to detect spike movements in Boom and Crash pairs in Deriv company and enter into transactions. The pairs used are Boom300, Boom500, Boom1000, Crash300, Crash500, Crash1000.
When the indicator gives an arrow sign in the expected direction, the transaction is entered and Stop Loss should be placed on the support/resistance areas shown by the indicator.
The indicator does not repaint. It is not used for trend following, but for entering transactions in the direction of th

MOST is applied on this RSI moving average with an extra default option added VAR/VIDYA (Variable Index Dynamic Moving Average)
MOST added on RSI has a Moving Average of RSI and a trailing percent stop level of the Moving Average that can be adjusted by changing the length of the MA and %percent of the stop level.
BUY SIGNAL when the Moving Average Line crosses above the MOST Line
LONG CONDITION when the Moving Average is above the MOST
SELL SIGNAL when Moving Average Line crosses below MOS

Индикатор Trend based on Extremum Levels and Volatility - это удобный инструмент, предназначенный для помощи трейдерам в определении точек перелома тренда и потенциальных уровней фиксации прибыли на различных таймфреймах. Применение индикатора возможно как на рынке форекс, фьючерсов, акций, индексов, сырья так и криптовалюты.
Этот универсальный индикатор строит тренды на основе локальных экстремумов, волатильности и среднего отклонения цены, предоставляя ценные сведения, которые можно исполь

ATR Bands Alert is a channel indicator where the channel width is calculated as a constant multiplier ("Multiplier") and the value of the "Average True Range" indicator. Unlike Bollinger Bands, the bandwidth is not changed so often – in the ATR Bands Alert indicator, the bands often have long straight lines.
The interpretation of the ATR Bands Alert is based on the fact that the price is inside the bands for most of the time, and if the price reaches one of the boundaries, it may indicate a tr

Этот мощный инструмент автоматически идентифицирует линии тренда, помогая оптимизировать вашу торговую стратегию и принимать более обоснованные решения. версия MT4
Ключевые функции автоматическое обнаружение линии тренда : индикатор «основной линии тренда» сканирует рынок для потенциальных линий тренда и мгновенно отображает их на вашей диаграмме.Это экономит вам ценное время и гарантирует, что вы никогда не пропустите важную тенденцию. Панель для пользователя : наш индикатор поставляется с

The DYJ SignalSourceOfMACD is based on the MACD indicator. Generally, signals are generated when crossing the MACD and SIGNAL lines of the MACD indicator. Signals to buy are generated if the MACD line crosses over the SIGNAL line in the negative area below the MACD open level. The negative area is where the values of MACD and SIGNAL lines are below zero. The MACD open level parameter is set in pips. However, in the code it is converted as follows: MACD Open level * Instrument.PipSize. For exa

ENG-GOLD Scalper It is an auxiliary indicator that identifies potential targets and determines the place of entry with a stop loss that works on Heiken Ashi candles
The green lines are usually the targets, the red lines are the stop loss, and the yellow lines are the entry location.
This file is recognized on small and medium frames, usually less than the watch frame
I highly recommend using XAUUSD Nasdaq100 Dow30 USOIL
DYJ SignalSourceOfRSI is a momentum oscillator which shows price strength by comparing upward movements of Close prices to their downward movements over a selected number of periods. There are two kinds of signals provided by RSI: RSI reaching of either overbought or oversold level and then making a bit of reversal: Signals to buy are generated falling of RSI below level(30) and Signals to sell are generated rising of RSI above level(70) Falling of RSI below level(30) and then rising above level

The Heikin Ashi Delta Pro leverages the refined elegance of Heikin Ashi candlesticks, renowned for their ability to filter market noise and highlight clearer trends and reversals. Building on a solid foundation, this advanced indicator integrates the Hull Moving Average method, enhancing its precision and responsiveness. Alongside an intuitive alert system, it transforms raw market data into actionable trading insights, empowering traders to make more informed decisions swiftly. Learn more about

Индикатор TimeCycleCaptor представляет собой инновационное средство для точной визуализации рыночного тренда и генерации сигналов на покупку и продажу.
Рыночный тренд играет ключевую роль в принятии торговых решений, и наш индикатор предоставляет надежный инструмент для его определения. Мы воплотили мечту трейдеров о незапаздывающих скользящих средних в нашем индикаторе.
TimeCycleCaptor способен прогнозировать будущие значения и предназначен как для определения основного тренда, так и для выя

В мире трейдинга нет универсального индикатора, который всегда обеспечивает исключительно прибыльные сигналы независимо от рыночных условий. Не смотря на ваше упорство, такой инструмент просто не существует. Однако, с индикатором Trend Master Arrow у вас будет надежный помощник в создании вашей собственной торговой системы.
Хотя следовать стрелочным сигналам необходимо с осторожностью и учитывать дополнительные фильтры, индикатор Trend Master Arrow обеспечивает ценную информацию для определени

Индикатор Market Might, несмотря на свою внешнюю простоту, основан на сложных аналитических алгоритмах, позволяющих точно определять моменты входа и выхода из сделок. Сигналы, генерируемые этим индикатором, являются точными и своевременными, появляясь непосредственно на текущей свече.
Основная задача индикатора Market Might заключается в определении моментов входа и выхода из сделок. Поэтому он отображает только линию тренда и точки входа, что обеспечивает ясное представление о местах входа на
The "No Reversal Accumatrix AI" is a cutting-edge MetaTrader 5 indicator designed to assist traders in confirming trends without the inconvenience of repainting. Built upon advanced artificial intelligence algorithms, this indicator offers a reliable tool for identifying and validating trends in financial markets. Key Features: Non-Repainting Technology : Unlike traditional indicators prone to repainting, the "No Reversal Accumatrix AI" utilizes innovative algorithms to provide accurate trend co

The indicator show Higher timeframe candles for ICT technical analisys Higher time frames reduce the 'noise' inherent in lower time frames, providing a clearer, more accurate picture of the market's movements.
By examining higher time frames, you can better identify trends, reversals, and key areas of support and resistance.
The Higher Time Frame Candles indicator overlays higher time frame data directly onto your current chart.
You can easily specify the higher time frame candles you'd li
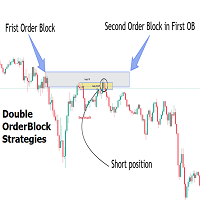
Introduction
The Price Action, styled as the "Smart Money Concept" or "SMC," was introduced by Mr. David J. Crouch in 2000 and is one of the most modern technical styles in the financial world. In financial markets, Smart Money refers to capital controlled by major market players (central banks, funds, etc.), and these traders can accurately predict market trends and achieve the highest profits.
In the "Smart Money" style, various types of "order blocks" can be traded. This indicator uses
With this indicator TheStrat bar numbers can be displayed above and below candles of the chart. The numbers have the following meaning: 1 = Inside Bar 2 = Directional Bar 3 = Outside Bar. In TheStrat-method there are Actionable and In-Force patterns / combos to define entries for trades. These patterns are also displayed by the indicator.
Here are the settings that can be configured: Number of lookbar bars : For how many candles in the past numbers are dislayed Color of inside bar : The color o

Rent with a discount of 75% for 1 Year the FOTSI! Offer valid from 01/05/2025 to 30/05/2025! Hurry Up & Rate the indicator!
FOTSI (Forex Overview True Strength Index) for MT5! FOTSI is an indicator that analyzes the relative strength of currencies in major Forex pairs. It aims to anticipate corrections in currency pairs following strong trends by identifying potential entry signals through overbought and oversold target areas. Theoretical Logic of Construction: Calculation of Individual Curren
А знаете ли вы, почему MetaTrader Market - лучшее место для продажи торговых стратегий и технических индикаторов? Разработчику у нас не нужно тратить время и силы на рекламу, защиту программ и расчеты с покупателями. Всё это уже сделано.
Вы упускаете торговые возможности:
- Бесплатные приложения для трейдинга
- 8 000+ сигналов для копирования
- Экономические новости для анализа финансовых рынков
Регистрация
Вход
Если у вас нет учетной записи, зарегистрируйтесь
Для авторизации и пользования сайтом MQL5.com необходимо разрешить использование файлов Сookie.
Пожалуйста, включите в вашем браузере данную настройку, иначе вы не сможете авторизоваться.