Смотри обучающее видео по маркету на YouTube
Как купить торгового робота или индикатор
Запусти робота на
виртуальном хостинге
виртуальном хостинге
Протестируй индикатор/робота перед покупкой
Хочешь зарабатывать в Маркете?
Как подать продукт, чтобы его покупали
Технические индикаторы для MetaTrader 5 - 86

The indicator illustrates the divergence between the price movements of two financial instruments, such as EURUSD and GBPUSD or US500 and US30 or Gold and Silver. These divergences are plotted in the form of segments on the price chart of the dominant instrument. The dominant instrument refers to the one that exhibits a stronger bullish trend in the case of a bullish divergence, or a stronger bearish trend in the case of a bearish divergence. Investors are encouraged to independently seek correl

THis indicator is a typical trend following indicator. ION BOT is based on the price position and its trail stop. When the price is above its trail stop the indicator is in an uptrend, and therefore the candles are coloured green, signalling the beginning of a trend with a green arrow.
Here are some of its key functionalities: Trend Analysis: The UT Bot Alert Indicator uses advanced algorithms to analyze market trends and identify key support and resistance levels. This information can help tra

The Ultimate Trend and Reversals Detector The Ultimate Trend and Reversals Detector is a powerful tool designed to identify potential trend reversal zones in the financial markets. Here are the key features: Objective : Detect trend directions and reversals. Signal Colors : Green : Indicates a potential bullish trend reversal. Red : Signals a potential bearish trend reversal. Non-Repainting : The indicator’s signals are not redrawn, providing reliable information. Suitable for All Styles : Scal

Используя индикатор Future Trend, вы сможете предвидеть будущее движение цены на определенное количество баров вперед. Этот индикатор создает линию, отображающую моделированные будущие значения цен, что предоставляет вам ценную информацию для принятия решений о входе или выходе с рынка, а также для установки или коррекции стоп-лоссов, сопровождающих вашу позицию.
Кроме того, у индикатора Future Trend есть несколько параметров: HistoricBars - определяет количество исторических баров, которые ис
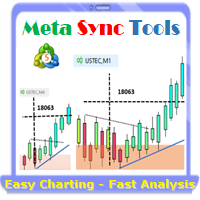
Supercharge Your MetaTrader Analysis and Trading with Meta Sync Tools! Struggling to analyze price action across different timeframes? Meta Sync Tools eliminates the frustration of unsynced crosshairs and charts, allowing seamless multi-timeframe analysis. Missing key correlations between assets and constantly switching between charts? Meta Sync Tools empowers you to visualize relationships between instruments effortlessly. Tired of wasting time on repetitive tasks? With 30+ Customizable Short

Introduction
"Smart money" is money invested by knowledgeable individuals at the right time, and this investment can yield the highest returns.
The concept we focus on in this indicator is whether the market is in an uptrend or downtrend. The market briefly takes a weak and reversal trend with "Minor BoS" without being able to break the major pivot.
In the next step, it returns to its main trend with a strong bullish move and continues its trend with a "Major BoS". The "order block" beh

Представляем индикатор астрономии для MT4 / MT5 : Ваш незаменимый небесный товарищ в торговле Готовы ли вы поднять свой опыт торговли до небесных высот? Не ищите дальше, чем наш революционный индикатор астрономии для MT4. Этот инновационный инструмент выходит за рамки традиционных торговых индикаторов, используя сложные алгоритмы для предоставления вам беспрецедентных астрономических понимания и точных расчетов. Вселенская информация под рукой: Взгляните на обширную панель, раскрывающую сокр

Introduction
The "Smart Money Concept" transcends mere technical trading strategies; it embodies a comprehensive philosophy elucidating market dynamics. Central to this concept is the acknowledgment that influential market participants manipulate price actions, presenting challenges for retail traders.
As a "retail trader", aligning your strategy with the behavior of "Smart Money," primarily market makers, is paramount. Understanding their trading patterns, which revolve around supply, de
This is one of the most powerful indicators I've ever made.
I was tired of looking at other windows/websites for economical news, and regularly something would happen without me realising.
So I made this indicator which displays all news at the exact time of arrival, directly on the charts!
Now you too can just focus on the charts and know that you won't miss any news events.
There are options:
1. You can choose to display on the price line, or at the bottom of the chart. 2. You can choose t
This is one of my most important indicators. Did you ever miss the session open/close? I did, which is why I made this indicator. It took a long time to get this right, since depending on your platform and timezone, it can be incorrect. It should be accurate for everyone now. It takes into account Daylight savings for NY and EU timezones, and should just work like magic on your charts.
## Check screenshots to see proof that this indictor is a must! ##
Do you hate having to have a Monthly, Weekly, Daily chart when looking at your lower timeframes? I hated it too, so I made this. It will show you the High and Low of other timeframes on your chart, so you will always be aware where some support/resistance may be! Even on the 1 minute chart!
I recommend you use it 3 times, one with Day, Week and Month selected with different line widths.
I use this on every chart I look at. Yo

PMax is a brand new indicator developed by KivancOzbilgic in earlier 2020.
It's a combination of two trailing stop loss indicators;
One is Anıl Özekşi's MOST (Moving Stop Loss) Indicator and the other one is well known ATR based SuperTrend. Both MOST and SuperTrend Indicators are very good at trend following systems but conversely their performance is not bright in sideways market conditions like most of the other indicators.
Profit Maximizer - PMax tries to solve this problem. PMax combi

The Fat and Slim indicator tracks strong and weak money in the market. It is derived from RSI, MFI and many similar indicators. Input values are closing prices and volumes. The RSI (yellow curve) is in the range -100 ... 100. It is additionally multiplied by a coefficient so that the curve is not compressed to the middle values at higher periods (a problem with the classic RSI with different periods). Strong/Fat red curve is RSI weighted by higher volumes. Weak/Slim blue curve is calculated so t
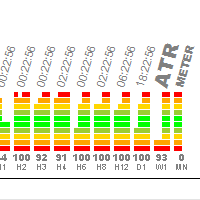
Индикатор предназначен для быстрого определения волатильности на инструменте. Очень удобно меняя графики сразу понимать на каких инструментах и временных периодах идет бойкая торговля, а где происходит затишье. Индикатор использует данные индикатора ATR переведенные в проценты. Если нанести ATR на график, на экране будут видны примерно 100-300 баров, я усреднил это значение и по умолчанию установил 150 (можете изменить в настройках на ваше усмотрение). Принцип работы: берем 150 значений ATR нахо

Heikin Ashi candlesticks are a powerful tool for traders, offering a clear and smooth visualization of market trends. Unlike traditional candlesticks, they filter out market noise, providing a cleaner view of the market's direction and strength, which helps traders make more informed decisions. The Hull Heikin Ashi Smoothed indicator from Minions Labs takes this a step further by integrating the Hull Moving Average for enhanced smoothing and precision. This indicator not only simplifies trend id

Следуйте тренду. Да, дождитесь сигнала на вход, будь то покупка или продажа, на 15-минутном фрейме и проверьте сигнал, если он появится на 30-минутном фрейме (иногда для появления сигнала требуется час или больше. Вы можете вернуться на 15-минутный фрейм и вернитесь к 30-минутному фрейму и повторяйте это до тех пор, пока у вас не появится основной сигнал. Если сигнал появляется на 30-минутном фрейме, входите по цене и фиксируйте прибыль при изменении линии рисунка. , фиксируется прибыль или при
>>> MEGA SALE: 40% OFF! - Promo price: $77 / Regular price $129 <<< - The promotion will end soon!
The Forex Trend Tracker is an advanced tool designed to enhance the trading capabilities of forex traders. This sophisticated indicator uses complex mathematical formulas alongside the Average True Range (ATR) to detect the beginnings of new upward and downward trends in the forex market. It offers visual cues and real-time alerts to give traders a competitive advantage in the fast-paced world o

Volume plays a crucial role in trading, serving as a key indicator of market activity and investor sentiment. Here are some important roles of volume in trading:
Confirming trends: Dow Theory emphasizes the importance of volume in determining market trends. Larger volume usually indicates greater disagreement between bulls and bears, while smaller volume may indicate higher market agreement with the current price. Capturing institutional moves: By analyzing volume over a period of time, one ca

Overview
In the evolving landscape of trading and investment, the demand for sophisticated and reliable tools is ever-growing. The AI Trend Navigator is an indicator designed to meet this demand, providing valuable insights into market trends and potential future price movements. The AI Trend Navigator indicator is designed to predict market trends using the k-Nearest Neighbors (KNN) classifier.
By intelligently analyzing recent price actions and emphasizing similar values, it helps t

MultiFractal Levels MultiFractal Levels – это модифицироанный индикатор фракталов Била Вильямса с добавлением уровней. Фракталы строятся со всех ТФ, разрешённых в настройках.
Уровни строятся только по самым последним фракталам, которые ещё не были протестированы ценой.
Преимущества перед оригинальным терминальным индикатором:
Удобство Наглядность Информативность Самые свежие уровни Настраиваемый фрактал Настраиваемые уровни Индикатор удобен, поскольку не нужно переключаться на разные та

This is the MT5 version of Ku-Chart.
This is an indicator devised by Ku-chan, a famous Japanese trader, based on the dealings of Lehman Brothers' discretionary traders. Unify the measuring stick of currencies to display the true value of currencies.
Although it is an indicator, it does not use a buffer and is displayed using objects such as trend lines. Also, instead of drawing on the subchart, it is drawn in an area far above the current price of the main chart, so you can switch from the no
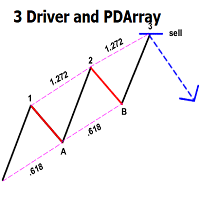
This indicator automatically identifies the SMC 3-Drive pattern and sends notifications to users when the pattern is detected. Additionally, the indicator identifies PDArray (including FVG and OB) and offers an option to combine the 3-Drive pattern with PDArray. This combination provides users with more reliable signals. What is the 3-Drive Pattern? This pattern is formed by three price pushes in one direction, providing a strong reversal signal (Figure 3). The key to identifying this pattern is

Introduction
The "Smart Money Concept" transcends the realm of mere technical trading strategies to embody a comprehensive philosophy on the dynamics of market operations. It posits that key market participants engage in price manipulation, thereby complicating the trading landscape for smaller, retail traders.
Under this doctrine, retail traders are advised to tailor their strategies in alignment with the maneuvers of "Smart Money" - essentially, the capital operated by market makers.

Introducing our state-of-the-art Wave Indicator, meticulously designed for the discerning traders of the MQL5 community! At the core of this innovative tool lies an unmatched sensitivity to capture even the slightest market movements. Our Wave Indicator serves as the foundational element for constructing comprehensive trading strategies, providing you with an unwavering edge in the dynamic world of finance. Whether you're aiming to refine short-term tactics or develop long-term systems, this ind

TMA CG FAST MT4 REPLICADO PARA MT5 Cuenta con todas las caracteristicas del original con la funcion adicional de tener señal al fallo que consiste en que despues de una cantidad de velas establecida por el usuario emita una preseñal para una potencial entrada tiene alerta sonora para la posible entrada y la entrada definitiva tiene la posibilidad de repintar o no , queda a eleccion de usuario
Раскройте весь потенциал своего торгового индикатора с помощью XDashboard MT5, лучшего индикатора информационной панели для MetaTrader 5. XDashboard MT5, созданный для трейдеров, которым требуется точность и эффективность, предлагает беспрецедентное представление любого индикатора на нескольких символах и таймфреймах. все из единого настраиваемого интерфейса. ** Эта цена ограничена по времени ** Функции: Интеграция пользовательских индикаторов
Комплексный многосимвольный мониторинг Мульти
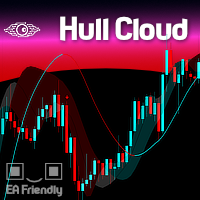
The Hull Moving Average is known for its ability to reduce lag and provide a clearer, more accurate depiction of market trends. By smoothing price data more effectively than traditional moving averages, it helps traders identify trend directions and reversals with greater precision. The Hull Cloud indicator elevates this by using four Hull Moving Averages working together like an orchestra. This combination creates a dynamic system that highlights short, medium, and long-term trends, giving trad
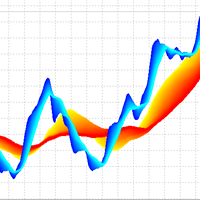
3D Trend Indicator is a non-repaint indicator using multiple moving averages with a 3D surface view. By using this indicator, you can remove uncertainties that can happen using a single and fixed moving average period. You can use a cloud area using a range of moving average periods. Also a wide range of visual settings are added to this indicator to have a better view from the cloud area. Alert and notification system added to the indicator to inform the trader about the action of candles on t
Apresentamos o Indicador de novo grafico - uma ferramenta poderosa para traders que buscam uma análise de preço suave e clara. Este indicador inovador calcula a média simples dos preços, oferecendo uma visão precisa e ajustada dos movimentos do mercado. Como Funciona : O Indicador de Média de Preços Simples (SMA) utiliza uma fórmula simples e eficaz: Ele soma o valor do último preço com o preço anterior. Em seguida, divide essa soma por 2 para obter a média. Fórmula : SMA = U ˊ ltimo Pre c ¸ o +

The Multi Asset Monitor Panel is a game-changer for traders who need to keep an eye on multiple markets simultaneously. This innovative panel allows you to monitor any symbol and any timeframe you need, all within a single, organized interface. With up to three lists of symbols and customizable MT5 templates, you can tailor your monitoring setup to fit your specific trading strategy. What sets the Multi Asset Monitor Panel apart is its flexibility and customization options. You can control the s

Course Crystal — индикатор, который помогает трейдерам определить направление тренда на рынке. Он использует уникальный алгоритм для анализа движения цен и отображает результаты на графике в виде цветных областей. Синий цвет указывает на возможность покупки, а красный — на возможность продажи. Инструкция по использованию - https://www.mql5.com/en/blogs/post/757800 Ручная торговая система:
Определение тренда: индикатор Course Crystal анализирует текущие и прошлые данные о ценах, чтобы определит

Unlock the power of Fibonacci with our advanced indicator!
This tool precisely plots Fibonacci levels based on the previous day's high and low, identifying the next day's key support and resistance levels. Perfect for day trading and swing trading, it has consistently generated weekly profits for me.
Elevate your trading strategy and seize profitable opportunities with ease.
NOTE: In the Input section make sure the draw labels are set to "True" so you can see each levels.

MinMax Levels – это индикатор уровней максимальной, минимальной и цены открытия за важные торговые периоды: дня, недели и месяца.
Каждый участник рынка форекс испольует уровни в своей торговой системе. Они могут быть как основным сигналом к совершению сделок, так и дополнительным, выступая в качестве аналитического инструмента.
В данном индикаторе в качестве важных периодов были выбраны дни, недели и месяцы, поскольку они являются кючевыми периодами торговли крупных участников рынка. Как изв

Если вам нужен индикатор, который показывает точки входа в рынок, то это ваш индикатор. Индикатор не перерисовывается. Показывает точки покупки и продажи для любого ТФ (таймфрейма) и любой валютной пары. Настройки регулируются для всех инструментов. Каждый параметр вы можете настроить для любого брокера, для любого счёта. Это ПОДУШКА, на которой удобно:)) Просто проверьте это.....

Description of the Indicator The indicator "BullsBearsPulse" is designed for MetaTrader 5 and provides a visual representation of the Bulls Power and Bears Power indicators. These indicators are useful tools for technical analysis, particularly for the EUR/USD currency pair, to help traders identify potential trading opportunities. Functionality Bulls Power : This indicator measures the strength of the bulls (buyers) in the market. It calculates the difference between the highest price and a 20

O LIVRO VISUAL é uma ferramenta que auxilia na identificação de escoras e renovação de ordens, para quem opera Tape Reading ou fluxo no gráfico é uma excelente ferramenta. Porem ele funciona somente em Mercados Centralizados ou com profundidade nível 2. É de fundamental importância você saber que ele não funciona em Mercado de FOREX. Porem pode ser utilizado no Mercado da B3.

Оптимизируйте свои торговые стратегии с индикатором RAR (Relative Adaptive RSI)! Этот продвинутый индикатор технического анализа сочетает в себе мощь индекса относительной силы (RSI) с адаптивными технологиями, предоставляя более точные и надежные сигналы по сравнению с обычным осциллятором. Что такое индикатор RAR? RAR - это индикатор, разработанный для MetaTrader 5, который использует экспоненциальные скользящие средние (EMA) и адаптивные скользящие средние (AMA) для сглаживания RSI и динамиче

Raymond Cloudy Day Indicator – Advanced Pivot Analysis for MetaTrader 5 Elevate your trading analysis with the Raymond Cloudy Day Indicator , a powerful tool for MetaTrader 5 (MT5). Developed by Shi Xiong based on Raymond’s innovative vision, this indicator enhances traditional Pivot Point analysis with a unique calculation method to identify reversal points, trend extensions, and support/resistance levels. Optimized for XAUUSD on the H1 timeframe, it is ideal for traders seeking reliable mar

PyNinjaTrader — перетаскивание API-коннектора Python для NinjaTrader 8
PyNinjaTrader легко соединяет ваши скрипты Python с NinjaTrader 8, используя простую стратегию перетаскивания. Это полностью протестированное, быстрое и эффективное решение использует веб-сокеты для связи, при этом стратегия выступает в роли сервера, а сценарий Python — в качестве клиента.
Функции: - Вход на Python в терминал NinjaTrader 8 - Функция Keep-Alive для непрерывного соединения - Получить информацию об учетной за
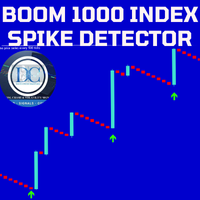
Our Spike Detector is specifically engineered to cater to the unique needs of traders in the Boom and Crash indices markets. This tool is optimized for M1 (1-minute) and M5 (5-minute) timeframes, ensuring you receive timely and actionable insights.
Key Features: 1. **Non-Repainting**: Our detector guarantees accuracy with non-repainting signals, ensuring your data remains consistent and reliable. 2. **Push Notifications**: Stay updated with real-time push notifications, so you never miss a cri
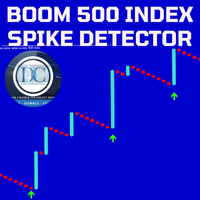
Our Spike Detector is specifically engineered to cater to the unique needs of traders in the Boom and Crash indices markets. This tool is optimized for M1 (1-minute) and M5 (5-minute) timeframes, ensuring you receive timely and actionable insights.
Key Features:
1. Non-Repainting**: Our detector guarantees accuracy with non-repainting signals, ensuring your data remains consistent and reliable. 2. Push Notifications**: Stay updated with real-time push notifications, so you never miss a criti

Our Spike Detector is specifically engineered to cater to the unique needs of traders in the Boom and Crash indices markets. This tool is optimized for M1 (1-minute) and M5 (5-minute) timeframes, ensuring you receive timely and actionable insights.
Key Features:
1. **Non-Repainting**: Our detector guarantees accuracy with non-repainting signals, ensuring your data remains consistent and reliable. 2. **Push Notifications**: Stay updated with real-time push notifications, so you never miss a cr
The Interactive RSI indicator can generate RSI divergence with the availability of user defined filters. It can generate voice alerts for RSI oversold and RSI Overbought situations. Moreover it can also generate voice alerts for RSI Divergneces as well as when price breaks above or breaks below the support and resistances created upon divergence ouccurence. The voice alerts are generated in a way that you will know which market has reached the oversold and overbought conditions as well as the r

This indicator shows the engulfing pattern, which is the most direct manifestation of capital flow. Engulfing Pattern is a common price reversal pattern in technical analysis, which usually appears at the end of a price trend or at key support and resistance levels. It can be divided into two types: Bullish Engulfing Pattern and Bearish Engulfing Pattern. Bullish Engulfing Pattern feature: Previous K-line: This is the negative line of a small entity (the opening price is higher than the closing

Trend reversal identification: The K-line countdown indicator helps traders capture trend reversal signals by identifying excessive buying and selling behavior in the market. This indicator is particularly effective when the market is in extreme states. Risk management: This indicator can help traders identify potential risks in the market before the trend reverses and adjust positions in time to avoid losses. For example, you might consider reducing your long position when a bullish countdown c

Price update indicator — can issue any type of alert when the price reaches certain levels set by a trader. There are three types of price levels: the first one is used when the price rises above certain level (displayed with the green line on the chart), the second one is used when the price falls below certain level (displayed with the red line on the chart), and the third one is used when the price reaches the certain level exactly (displayed with the yellow line). Three alert types include

Индикатор "Channel Craft" представляет собой классический инструмент из семейства канальных индикаторов, который позволяет трейдеру своевременно реагировать на выход цены за пределы установленного канала. Этот канал формируется на основе анализа нескольких свечей, начиная с последней, что позволяет выявить экстремумы в изучаемом диапазоне и построить линии канала. Торговля внутри канала является одной из наиболее распространенных стратегий на рынке форекс, благодаря своей простоте она доступна д

Точки входа, предоставляемые индикатором Olo May, следует рассматривать как потенциальные моменты изменения направления рынка. Этот индикатор основан на использовании циклически-волновой зависимости, что делает каждую точку входа оптимальной для выявления изменений движения. Самый простой способ использования этого индикатора - открытие позиции в направлении текущего тренда. Однако наилучшие результаты достигаются при комбинировании его с фундаментальными новостями, так как он может использовать

Этот индикатор технического анализа позволяет с высокой вероятностью определить, преобладает ли на рынке тренд или плоскость. Он может использоваться как для торговли внутри канала, так и для торговли на пробой, при условии использования стоп-лоссов для защиты от ложных сигналов.
Индикатор отображает канал в виде линий, расположенных выше и ниже цены, как и другие подобные индикаторы. Верхняя и нижняя линии также могут выступать в качестве уровней сопротивления и поддержки.
Он достаточно точн

Определение текущего рыночного тренда - ключевая задача для успешной торговли. Именно для этой цели был разработан индикатор Book Scheme, который представляет собой передовой алгоритм для наглядного отображения тренда на графике. Многие трейдеры мечтали о наличии надежных скользящих средних, которые не отставали от рынка. Именно эту мечту я превратил в реальность с помощью моего индикатора. Book Scheme позволяет предсказывать будущие значения и создавать точные сигналы для входа и выхода из рынк

Descubra o poder do nosso indicador de alta precisão, projetado para identificar as regiões de alvo e exaustão de qualquer ativo. Testado e validado por mais de 3 anos nos mercados de mini dólar e mini índice, ele oferece confiabilidade e eficácia incomparáveis. Transforme sua estratégia de trading e alcance novos patamares de sucesso com nossa ferramenta inovadora.

Evaluate operational viability in each timeframe and in any instrument, according to their respective spread and percentage volatility, which are essential for correct risk management in your trades.
This indicator is essential for both Day Traders and Swing Traders, as in addition to evaluating operational viability in each timeframe, it is also possible to identify the fair minimum stop for each period and instrument.
Example in Swing Trade: your broker charges a spread equivalent to 0.05%
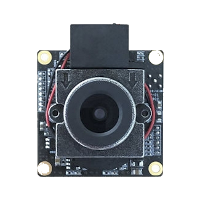
Индикатор Oriole разработан для выявления ценовых тенденций и позволяет быстро определить не только направление тренда, но и уровни взаимодействия покупателей и продавцов. Он функционирует на всех таймфреймах и валютных парах.
Индикатор Oriole предоставляет достаточно точные сигналы и может использоваться как на трендовых, так и на флетовых рынках. Рекомендуется применять его в сочетании с другими инструментами для получения более надежных сигналов и принятия обоснованных решений.
Индикатор н

Индикатор Market Matrix - это эффективный инструмент для определения трендов на рынке Форекс. Он служит надежным помощником для трейдеров, помогая выявить зоны тренда и флета. Ниже представлены основные характеристики и преимущества данного индикатора:
Особенности индикатора Market Matrix: Надежность и стабильность: Индикатор не перерисовывает предыдущие значения, что обеспечивает стабильность сигналов. Быстрая реакция на изменение тренда: Алгоритм индикатора позволяет оперативно реагировать н
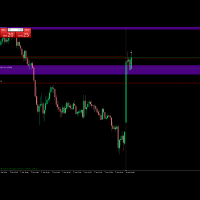
Your average price indicator for the position you were looking for. This indicator inserts a horizontal line on your chart when you are positioned, long or sold, after completing the partial. After completing the partial, it inserts the horizontal line on the graph visually showing where the true BreakEven of the operation is. Take a look the line of point 0 of operation.
OBS: This indicator only works in Netting Account.
Seu indicador de preço médio da posição que estava procurando. Este indi
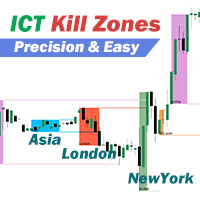
ICT killzones - это определенные временные периоды на рынке, во время которых объем торгов и волатильность часто увеличиваются. Для того чтобы помочь трейдерам получить полное понимание ситуации на рынке и лучше сформулировать торговые стратегии, мы разработали индикатор торговой сессии. Все 5 killzones настраиваются с помощью собственных цветов и таймфреймов, их можно точно настроить на свой вкус или перенастроить на совершенно другой часовой пояс. Индикатор будет автоматически отслеживать изме

StochastiX is an extension of a well-known indicator.
1) StochastiX is displayed in the range of -100 to 100.
2) A histogram is calculated from the difference of the main and signal curves - again as a stochastic, but without smoothing.
The histogram gives the user a hint about the dynamics of oscillator changes. Patterns need to be studied from real graphs.
I wish you successful trading.
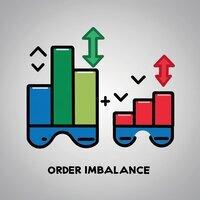
The Order Imbalance indicator, crucial in the toolkit of traders and market analysts, serves to highlight significant disparities between buy and sell orders within a specific financial asset. Essentially, it reveals the difference in volume between buy and sell orders over a defined period, typically in short, frequent intervals ( You can choose the frequency ). For traders, Order Imbalance can be interpreted as a signal of buying or selling pressure in the market. A positive imbalance, where s

Индикатор тренда Onion — это революционное решение для торговли по трендам и фильтрации рыночных данных, объединяющее все важные функции инструмента тренда в одном инструменте! Он отлично подходит для любого трейдера, будь то Форекс или бинарные опционы. Никаких настроек не требуется, всё оптимизировано временем и опытом, эффективно работает как в условиях флета, так и при тренде.
Индикатор тренда Onion — это инструмент технического анализа финансовых рынков, который отражает текущие отклонени

The indicator identifies critical support and resistance areas. It also can give alerts and notifications to your mobile. A lot of customization options are available:
You can have different timeframe on your current chart. For example, if your current chart timeframe is H1, you can assign the indicator timeframe to M15.The indicator identifies critical support and resistance areas. It also can give alerts and notifications to your mobile. A lot of customizations are available. There is an optio

Индикатор Supernova Momentums упрощает визуальное восприятие ценового графика и сокращает время на анализ: если сигнал отсутствует, сделка не открывается, а при появлении противоположного сигнала рекомендуется закрыть текущую позицию. Этот стрелочный индикатор разработан для определения тренда.
Supernova Momentums реализует стратегию торговли по тренду, обеспечивает фильтрацию рыночных шумов и включает все необходимые функции в одном инструменте. Его работа основана на автоматическом определен

Индикатор Dorian - это интуитивный инструмент для определения текущего рыночного тренда. Он основан на простой визуализации в виде двухцветных линий, что делает его удобным для использования как начинающими, так и опытными трейдерами.
Этот индикатор не только помогает определить направление тренда, но и служит ценным советником для принятия решений о входе в рынок или закрытии позиций. Благодаря своей простоте и эффективности, Dorian рекомендуется для трейдеров любого уровня опыта.
Интерпрета
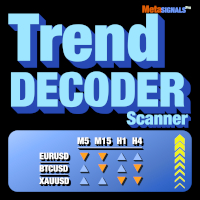
Получайте сигналы TrendDECODER для нескольких активов и нескольких временных единиц | Определите лучшую временную единицу для входа | Максимизируйте свою прибыль и выигрышные сделки Индикатор и скринер без перерисовки и задержки - идеален для ручной и автоматической торговли - для всех активов и всех временных единиц. 49$ за первые 50 копий - затем 99$ . После покупки, пожалуйста, оставьте комментарий или отзыв, и мы отправим вам ДОПОЛНИТЕЛЬНЫЙ индикатор стоимостью 99$.
О чем это?
Этот скрин

Powerful Order Block indicator in Tradingview platform. Indicator type: Price Action indicator Introduction: The Order Block Indicator - Elevating Your Price Action Analysis. If you're seeking a comprehensive Order Block indicator on the MQL5 platform, look no further.
Firstly, according to this indicator, an OB is understood as a zone of pending orders from large institutions that haven't been fully executed, revealing themselves in the market through subtle signs. Prices react strongly when

Індикатор Lumina Parallax разработан на основе оригинальных индикаторов поиска экстремумов и отлично подходит длЯ определениЯ разворотов или резких движений цены в одну из сторон. ‘ помощью этого индикатора вы сможете заранее знать о таких изменениЯх, так как он уведомит вас поЯвлением синей точки для покупки и красной для продажи‚ своей основе индикатор использует процесс выЯвлениЯ скорости изменениЯ роста цены, что позволЯет находить оптимальные точки входа и выхода с рынка.
Індикатор Lumina

Swing Sentry — это передовой технический индикатор, специально созданный для трейдеров на рынке Форекс. Он работает на основе уникального алгоритма, который позволяет прогнозировать будущие цены, анализируя исторические данные за указанный пользователем период.
Индикатор предоставляет трейдерам ценную информацию о возможных изменениях в направлении движения цены. Специальная формула, лежащая в основе работы Swing Sentry, точно рассчитывает сигналы, эффективно определяя моменты разворота или

Индикатор Rising представляет собой полноценную торговую систему, обрабатывающую данные от нескольких технических инструментов. Появление его сигналов – это результат сложных вычислений. Индикатор самостоятельно оценивает силу рыночных сигналов и указывает на смену направления, уведомляя об этом трейдера, который затем принимает торговое решение. Этот индикатор функционирует на всех таймфреймах. Важно понимать, что любой индикатор – это лишь визуальное представление сигнала. Валютные пары никог

Introduction The “RSI Continuous Detection” is an innovative trading indicator developed by TvT Trading. It integrates the principles of the Average Directional Index (ADX) and the Relative Strength Index (RSI) to analyze market trends and pinpoint potential profitable entry points for traders. Our observations indicate that during a trend, prices typically retract temporarily before continuing in the direction of the prevailing trend. This insight forms the basis of our “RSI Continuous Detectio

Триллиантовый индикатор тренда.
Trilliant тренд является передовым форекс индикатор, который сочетает в себе скрытые уважаемые индикаторы для раннего обнаружения тренда. Как указывает название, это индикатор тренда, но встроенный в торговле практически всеми стратегиями форекс (все в одном), манипулируя настройками, лентами и линиями в индикаторе.
КАЖДОЙ форекс стратегии можно торговать с использованием триллионный тренд. Условия выполнены, когда формирующие свечи касаются триллиантовой верх

Предлагаю попробовать торговлю по индикатору Bph всем, кому это интересно.
Bph – это инструмент технического анализа, который использует математические вычисления для определения различных аспектов движения цен, основываясь на исторических данных. Индикатор работает на принципе циклично-волновой зависимости, что позволяет находить оптимальные точки входа, где изменяется направление движения цены. Bph выявляет ключевые аспекты движения цены, помогая трейдерам принимать обоснованные решения. Все
MetaTrader Маркет - уникальная площадка по продаже роботов и технических индикаторов, не имеющая аналогов.
Памятка пользователя MQL5.community расскажет вам и о других возможностях, доступных трейдерам только у нас: копирование торговых сигналов, заказ программ для фрилансеров, автоматические расчеты через платежную систему, аренда вычислительных мощностей в MQL5 Cloud Network.
Вы упускаете торговые возможности:
- Бесплатные приложения для трейдинга
- 8 000+ сигналов для копирования
- Экономические новости для анализа финансовых рынков
Регистрация
Вход
Если у вас нет учетной записи, зарегистрируйтесь
Для авторизации и пользования сайтом MQL5.com необходимо разрешить использование файлов Сookie.
Пожалуйста, включите в вашем браузере данную настройку, иначе вы не сможете авторизоваться.