• Visão global
  • Comentários
  • Discussão
  • O que há de novo

AlphaTrend AM

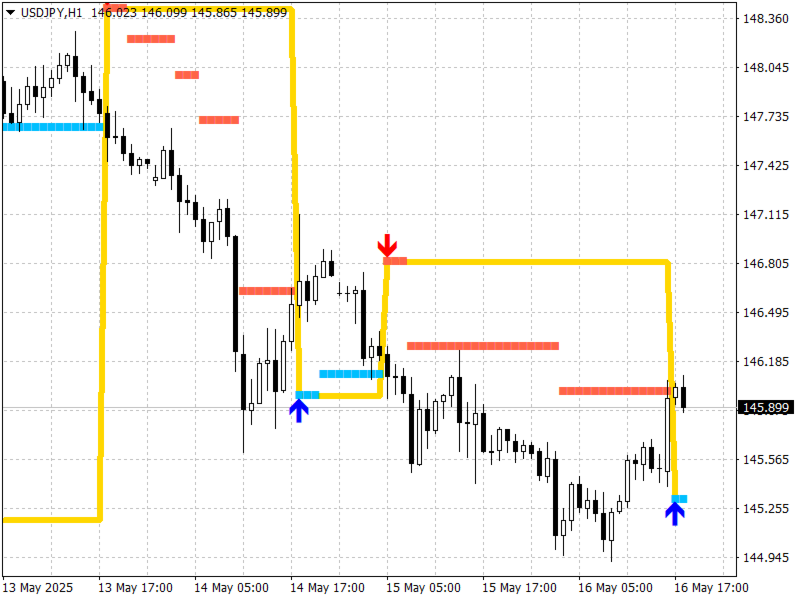
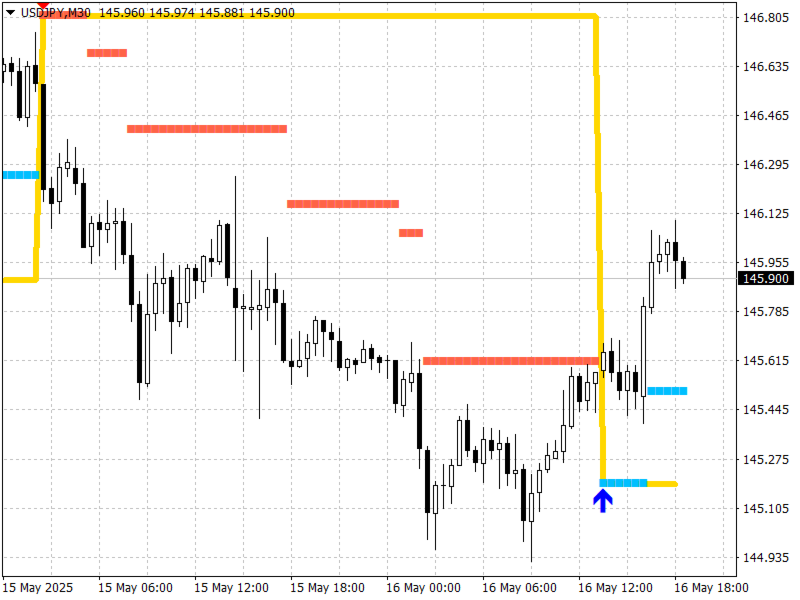
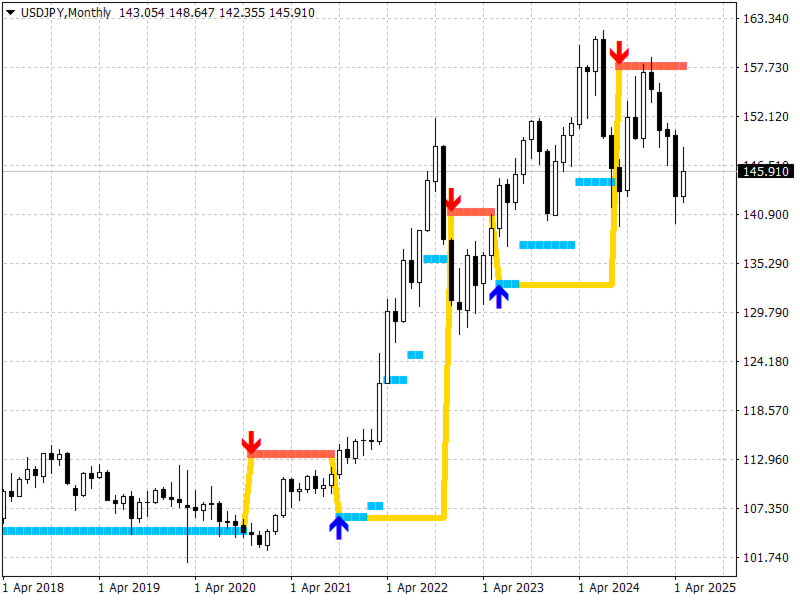
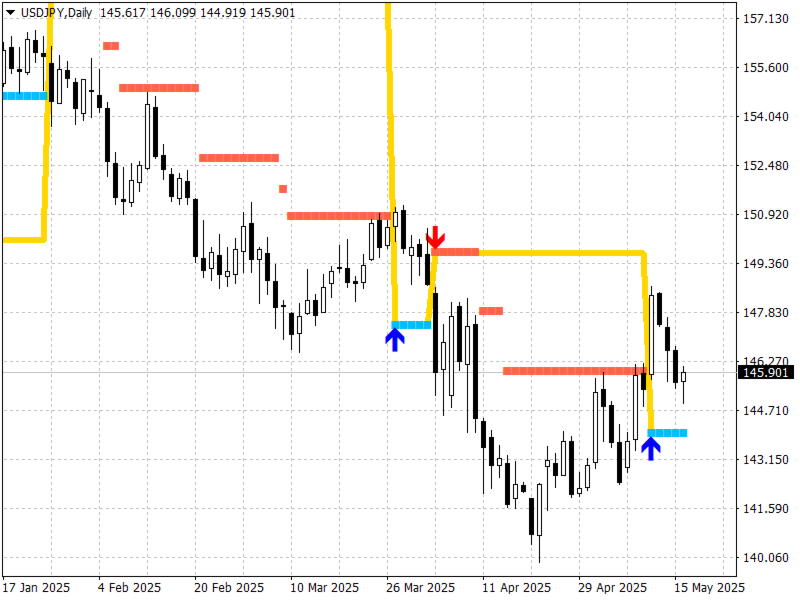
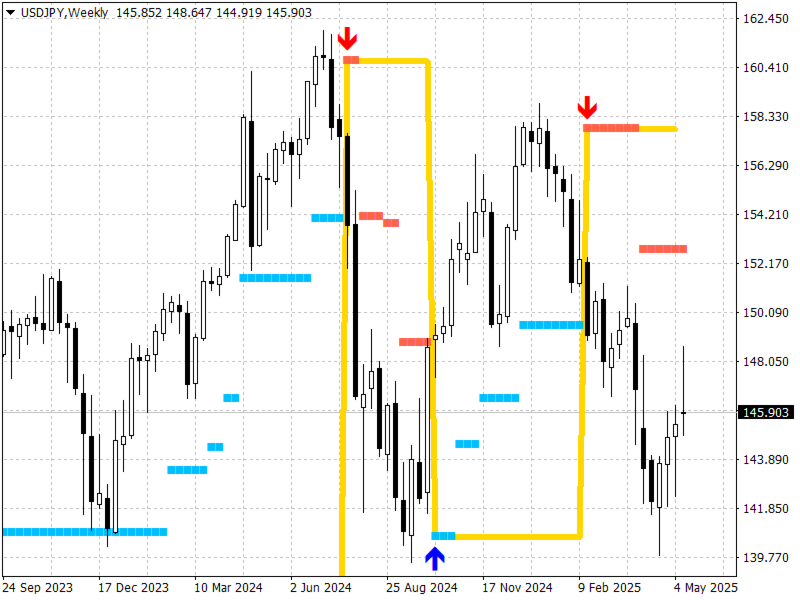
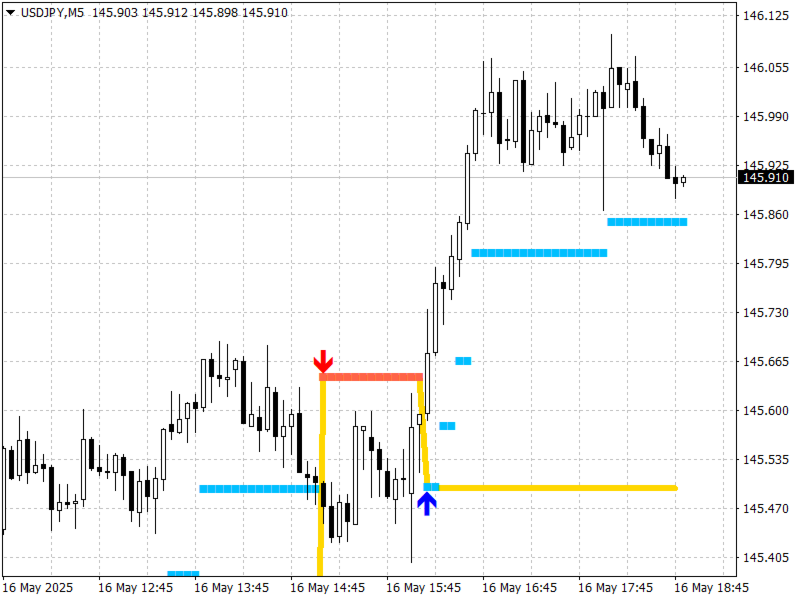
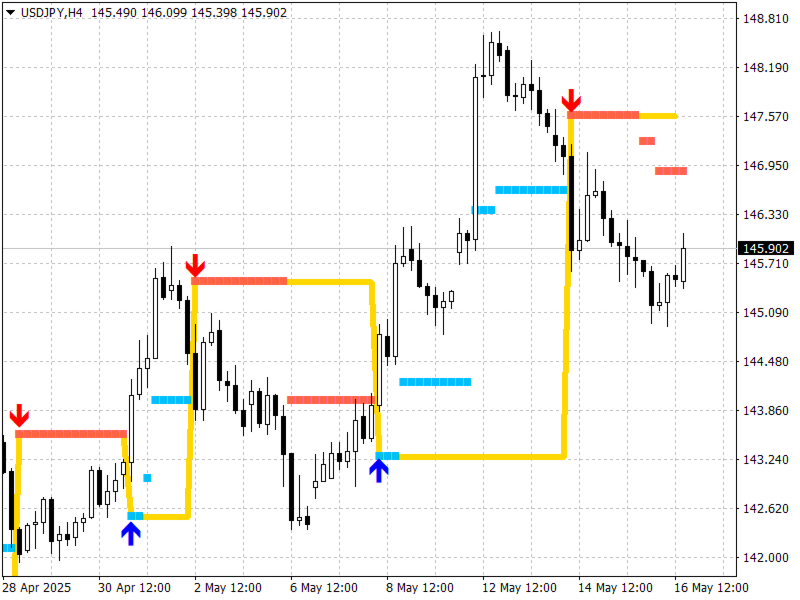
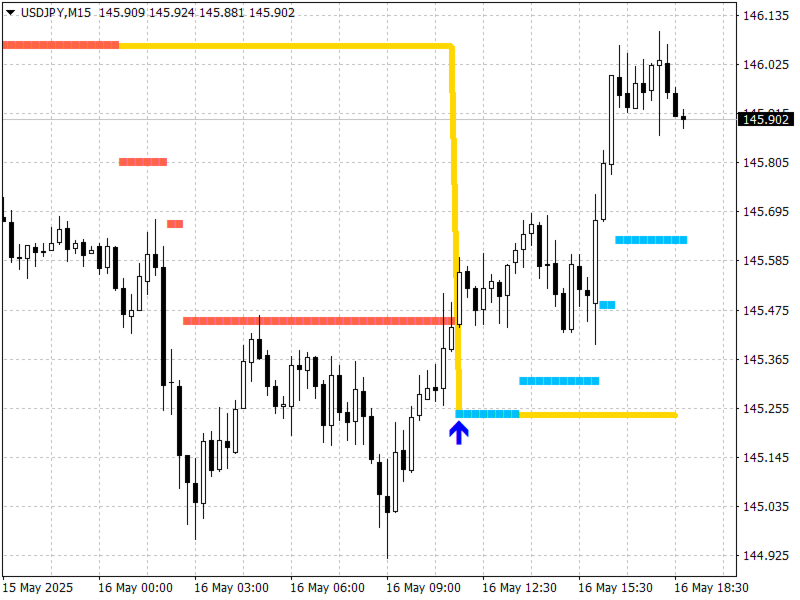
The presented indicator, based on the volatility readings of a financial instrument plots dynamic S/R levels on the price chart.

The indicator determines the trend and points to possible entry points formed by local highs/lows.

The indicator allows you to notify the user of its signals by sending messages to the terminal and e-mail.

The indicator does not repaint or recalculate.

Signals when working with the indicator:

  • The appearance of a red arrow above the price chart is a possible start of a downward trend;
  • The appearance of a green arrow below the price chart is a possible start of an upward trend;
  • Line - S/R levels.
Configurable indicator parameters:
  • Period_ATR - the chart period for which the volatility of the financial instrument is taken to set the indicator filter; 
  • Factor_ATR - the indicator sensitivity to the volatility of the financial instrument; 
  • Number_of_bars_calculated - the number of bars on which the indicator will be calculated and displayed (> 300); 
  • Alerts - the indicator displays a dialog box containing information about the indicator signal;
  • Send_Notification - the indicator sends a notification to mobile terminals whose MetaQuotes ID is specified in the settings window on the "Notifications" tab;
  • Send_Mail - the indicator sends an email to the address specified in the settings window on the "Mail" tab.

    Attention:

    Please note that any market is constantly changing and there is no guarantee that methods that have been effective in the past will show the same results in the future.

    To minimize potential losses, you should regularly optimize the product parameters, study the results of its work and withdraw part of the profit received.

    It is recommended that before using the product on a real account, you test its work on a demo account in the same market and with the same broker where you plan to trade.

    With respect and best wishes,

    Andriy Matviyevs'kyy


    P.S.

    If you liked this product, I would be grateful for a fair assessment - positive user reviews motivate the author, and reasonable criticism allows us to make products better.

    I suggest visiting my page where you will find many unique author's works that are the result of many years of studying exchange trading and FOREX trading.


    Produtos recomendados
    DSS Candles AM
    Andriy Matviyevs'kyy
    5 (1)
    This indicator colors the price chart candles according to the data of the DSS Oscillator AM indicator. DSS Oscillator AM is the author's implementation of the Double Smoothed Stochastic oscillator developed by William Blau and Walter Bressert. The calculation of values ​​is largely similar to the calculation of the classic stochastic oscillator. The indicator takes into account the location of the current price relative to local highs/lows. The signal about the change in the direction of price
    FREE
    Heiken Ashi Smoothed Indicator MT4 Introduction The  Heiken Ashi Smoothed Indicator  accurately identifies trends and reduces price noise. This indicator for the MetaTrader 4 platform is an updated and improved version of the standard  Heiken Ashi  candles. This indicator is formed as a moving average (composed of Heiken Ashi candles) around the price, and the position of the price relative to the moving average determines whether the trend is  upward (Uptrend)  or  downward (Downtrend) . «Indi
    FREE
    CISD and Price Gap Openings Indicator MT4 The CISD CSD + Price Gap Openings Indicator is designed to highlight price gaps while marking the CISD level, providing insights into potential market reversals. This MetaTrader 4 tool, based on ICT principles, utilizes arrow markers to assist traders in recognizing fresh price gaps and possible retracement zones.   CISD – CSD + Price Gap Openings Indicator Specifications The following table outlines the features of the CISD – CSD + Price Gap Openings In
    FREE
    Free automatic Fibonacci is an indicator that automatically plots a Fibonacci retracement based on the number of bars you select on the BarsToScan setting in the indicator. The Fibonacci is automatically updated in real time as new highest and lowest values appears amongst the selected bars. You can select which level values to be displayed in the indicator settings. You can also select the color of the levels thus enabling the trader to be able to attach the indicator several times with differe
    FREE
    Extremum Reverse Bar
    Yurij Izyumov
    2.8 (5)
    This indicator has been created for finding the probable reversal points of the symbol price. A small candlestick reversal pattern is used it its operation in conjunction with a filter of extremums. The indicator is not redrawn! If the extremum filter is disabled, the indicator shows all points that have a pattern. If the extremum filter is enabled, the condition works – if the history Previous bars 1 candles back contains higher candles and they are farther than the Previous bars 2 candle, such
    FREE
    O Captador de Tendências: A Estratégia do Captador de Tendências com Indicador de Alerta é uma ferramenta versátil de análise técnica que auxilia os traders na identificação de tendências de mercado e potenciais pontos de entrada e saída. Apresenta uma Estratégia dinâmica do Captador de Tendências, adaptando-se às condições do mercado para uma representação visual clara da direção da tendência. Os traders podem personalizar os parâmetros de acordo com suas preferências e tolerância ao risco. O
    FREE
    Supply Demand MT4
    Agus Santoso
    4 (1)
    INDICADOR MT4 GRATUITO: https://www.mql5.com/en/market/product/125434 ASSISTENTE MT4 GRATUITO: https://www.mql5.com/en/market/product/107986 Por favor, deixe uma avaliação de 5 estrelas se gosta desta ferramenta gratuita! Muito obrigada :) RALLY BASE RALLY (RBR), DROP BASE RALLY (DBR), DROP BASE DROP (DBD), RALLY BASE DROP (RBD), FAIR VALUE GAP (FVG) / IMBALANCE, HIDDEN BASE Apresentamos o Indicador "Supply Demand MT4" - a sua ferramenta definitiva para navegar no mundo dinâmico dos mercados
    FREE
    TrendPlus
    Sivakumar Subbaiya
    4.07 (14)
    Trend Plus   Trendplus  Indicator   Time Frame: Suitable for any time frame.  Purpose: Trend Prediction. Blue and red candle indicate the buy and sell call respectively. Buy: When the blue candle is formed buy call is initiated. close the buy trades when the next red candle will formed.   Sell: When the Red candle is formed Sell call is initiated. close the Sell trades when the next blue candle will formed.   Happy trade!!
    FREE
    TrendBox Indicator
    Ivan Grachev
    2.5 (6)
    The indicator looks for consolidation (flat) in the market at a certain time, builds a box-channel and marks levels indented from it for a breakdawn. After crossing one of the levels, the indicator marks the zone for take profit and calculates the corresponding profit or loss in the direction of this entry on the panel. Thus, the indicator, adjusting to the market, finds a flat area of the market, with the beginning of a trend movement to enter it. Version for MT5: https://www.mql5.com/en/market
    FREE
    Follow The Line
    Oliver Gideon Amofa Appiah
    3.94 (16)
    FOLLOW THE LINE GET THE FULL VERSION HERE: https://www.mql5.com/en/market/product/36024 This indicator obeys the popular maxim that: "THE TREND IS YOUR FRIEND" It paints a GREEN line for BUY and also paints a RED line for SELL.  It gives alarms and alerts of all kinds. IT DOES NOT REPAINT and can be used for all currency pairs and timeframes. Yes, as easy and simple as that. Even a newbie can use it to make great and reliable trades. NB: For best results, get my other premium indicators for more
    FREE
    Scalping indicator. It takes into account volatility, price movement in the local interval and the direction of the current trend. Recommended timeframe - M5. Advantages: Low volatility when a signal appears ensures minimal movement against an open position. The indicator does not redraw its signals. There are alert signals. It is a great tool for day trading. Settings: Name Description Period Indicator period Range of each bar in the period (pp.) The maximum size of each candle in the indicato
    FREE
    Forex Market Profile and Vwap
    Lorentzos Roussos
    4.75 (4)
    Perfil do mercado Forex (FMP para breve) O que isso não é: O FMP não é a exibição TPO clássica codificada por letras, não exibe o cálculo geral do perfil de dados do gráfico e não segmenta o gráfico em períodos e os calcula. O que faz : Mais importante ainda, o indicador FMP processará dados que residem entre a borda esquerda do espectro definido pelo usuário e a borda direita do espectro definido pelo usuário. O usuário pode definir o espectro apenas puxando cada extremidade do indicador co
    FREE
    OrderBlock TS Roman
    Vladislav Vlastovskii
    3.8 (5)
    Индикатор строит блоки заказов (БЗ) по торговой системе (ТС) Романа. Поиск блоков осуществляется одновременно на двух таймфремах: текущем и старшем (определяемым в настройках). Для оптимизации и игнорирования устаревших блоков в настройках задается ограничение количества дней в пределах которых осуществляется поиск блоков. Блоки строятся по правилам ТС состоящем из трех шагов: какую свечу вынесли (что?); какой свечой вынесли (чем?); правило отрисовки (как?).
    FREE
    Donchian channels are a tool in technical analysis used to determine the relative volatility of a market and the potential for price breakouts. Can help identify potential breakouts and reversals in price, which are the moments when traders are called on to make strategic decisions. These strategies can help you capitalize on price trends while having pre-defined entry and exit points to secure gains or limit losses. Using the Donchian channel can thus be part of a disciplined approach to managi
    FREE
    BoxInside MT4
    Evgeny Shevtsov
    4.83 (6)
    This indicator calculates the volume profile and places labels that correspond to the VAH, VAL and POC levels, for each candle individually. Indicator operation features The indicator works on the timeframes from M5 to MN, but it uses the history data of smaller periods: M1 - for periods from M5 to H1, M5 - for the H4 period, M30 - for the D1 period, H4 - for the W1 period, D1 - for the MN period. The color and location of the VAL, VAH and POC labels on the current candle are considered to be c
    FREE
    Sideway Trend Indicator for MetaTrader 4 The Sideway Trend Indicator for MetaTrader 4 is a practical analytical tool designed to detect consolidation phases where the market lacks directional movement. During such periods of reduced volatility, the indicator visualizes the range-bound behavior. Once the price breaks out of this sideways phase, the tool issues clear entry signals, enabling traders to act with improved timing and accuracy. «Indicator Installation & User Guide» MT4 Indicator Insta
    FREE
    GS spread
    Aleksander Gladkov
    The indicator calculates the current spread for each tick using the formula Spread=(ASK-BID)/Point. Schedule of changes in the boundaries spread over the timeframe displayed in a separate window from the date of accession of the indicator. Two lines corresponding to the minimum and maximum spread values are displayed. The indicator window is self-adjusted according to the minimum and maximum values from the moment of launch. The minimum and maximum values for the entire period of the indicator o
    FREE
    This is a regression tree indicator for MT4/MT5. This indicator classificate nodes on the time period so that the deviation becomes smaller, and displays regression line and channel for each node. It's free! Attached CartDemo.ex4 and CartDemo.ex5 is a Demo version and has the following limitations: Can't use HighSpeed method (default method is RandomForest) Maximum number of bars is 260 (increase from 200) There is no expiration date and can be started many times, but it stops after an hour.
    FREE
    AUD INDEX The Currency Index Project is ONE part of a thorough Forex study. Many people do not know the theoretical basis that drives currency exchange rates to move on the market. With this set of tools you will be able to have a more complete view of the entire market by analyzing not only the single currency of an exchange, but all the exchange rates that make up that currency by looking at a single window! The indicator faithfully represents the real index of a single currency present in a
    FREE
    Traditional MACD MT4
    Daniel Lewis
    4.58 (55)
    Indicador MACD em MetaTrader 4/5 parece diferente do que o MACD faz na maioria dos outros softwares gráficos. Isso é porque a versão MetaTrader 4/5 de MACD mostra a linha MACD como um histograma quando é tradicionalmente apresentado como uma linha. Além disso, a versão MetaTrader 4/5 calcula a linha de sinal usando uma SMA, no entanto de acordo com a definição, o indicador MACD supostamente é calculado com uma EMA. A versão MetaTrader 4/5 também não computa um verdadeiro Histograma MACD (a difer
    FREE
    The Adaptive Moving Average (AMA), created by Perry Kaufman, is a moving average variation designed to have low sensitivity to market noise and volatility combined with minimal lag for trend detection. These characteristics make it ideal for identifying the overall market trend, time turning points and filtering price movements. A detailed analysis of the calculations to determine the AMA can be found in MetaTrader 5 Help ( https://www.metatrader5.com/en/terminal/help/indicators/trend_indicators
    FREE
    SMT Divergence ICT Oil Indicator MT4 The SMT Divergence Oil Indicator is a specialized MetaTrader 4 tool designed to identify divergence patterns between correlated assets. It assists traders in detecting price discrepancies across Crude Oil (XTIUSD), Brent Crude (XBRUSD), and the USD/CAD pair , offering insights into possible trend shifts or reversals. This indicator visually marks divergence areas on the chart, making it easier to recognize opportunities for buying or selling based on institut
    FREE
    Non-Repainting Supertrend Indicator for MT4 The Non-Repainting Supertrend Indicator is a powerful tool for detecting market trends and breakout points. Specifically designed for the MetaTrader 4 (MT4) platform, this support and resistance indicator uses a dynamic trendline and signal arrows to accurately reflect the direction and potential reversal of price movements. «Indicator Installation & User Guide» MT4 Indicator Installation  | Non Repainting Supertrend Indicator for MT5   | ALL Product
    FREE
    Updates 9/12/2023 - If you are looking for the Spock EA, I don't sell it anymore. DM me for more info. 24/10/2023  -  Check out my other products. Starting to roll out some EAs & indicators based on this range. Currently there is no MT5 version. I am using MT4 myself. So I will spend my time mostly to develop more extensive stats for the Stats version and maybe even an EA. But I might  develop a MT5 version. All depends on the demand. Meaning, the more people request it, the bigger the chan
    FREE
    With this system you can spot high-probability trades in direction of strong trends. You can profit from stop hunt moves initiated by the smart money! Important Information How you can maximize the potential of the scanner, please read here: www.mql5.com/en/blogs/post/718109 Please read also the blog about the usage of the indicator: Professional Trading With Strong Momentum This FREE Version of the indicator works only on EURUSD and GBPUSD. The full version of the indicator can be found here:
    FREE
    ZigZag Support Resistance MT4
    Emmanuel Tshepang Mosweu
    4.5 (2)
    This indicator uses the Zigzag indicator to identify swing highs and swing lows in the price chart.    Once it has identified the swing highs and swing lows, it can use them to determine potential support and resistance levels. A support level is formed when the price drops and bounces back up from a swing low, indicating that there is buying pressure at that level. A resistance level is formed when the price rises and reverses downward from a swing high, suggesting selling pressure at that leve
    FREE
    The StochasticDivergence   is a custom indicator for the MetaTrader 4 (MT4) platform, designed to analyze the divergence between the Stochastic Oscillator (%K line) values of two currency pairs. It compares the Stochastic %K of the chart’s symbol (first symbol) with a user-defined second symbol, displaying both %K values and their absolute difference (divergence) in a separate subwindow. The indicator provides visual and alert-based feedback to highlight significant divergence levels, with custo
    FREE
    Padrões Harmônicos são mais bem utilizados para prever pontos de virada no mercado. Esses padrões oferecem uma alta taxa de vitória e diversas oportunidades de negociação em um único dia de negociação. Nosso indicador identifica os Padrões Harmônicos mais populares com base nos princípios descritos na literatura de Negociação Harmônica. NOTAS IMPORTANTES: O indicador não repinta, não atrasa (detecta um padrão no ponto D) e não REDRAW (o padrão é válido ou cancelado). COMO USAR: Arraste e solte o
    FREE
    Wave Reversal Indicator - determina a direção e as reversões de preço em torno da linha de equilíbrio. O indicador mostra os movimentos das ondas e os picos de tendência. Dá recomendações sobre onde seguir o trader, ajuda a seguir a estratégia de trading. É um complemento a uma estratégia intradiária ou de médio prazo. Quase todos os parâmetros são selecionados para cada intervalo de tempo e mudam automaticamente; Prazos ideais para utilizar M5, M15, M30, H1, H4. Funciona em vários instrumentos
    FREE
    Está grátis por tempo limitado. A estratégia usa principalmente o indicador técnico MACD e sempre segue a direção da tendência principal. Abra uma posição quando a sinal de início aparecer no intervalo de tempo M1. O gráfico adequado para o comércio é o XAU/USD (ouro), e também é aplicável a outros produtos com tendência aparente. Na versão 1.0, há 4 algoritmos incorporados. Recomenda-se principalmente o primeiro algoritmo, o algoritmo MACD, e os outros três são auxiliares. Antes de usá-lo, po
    FREE
    Os compradores deste produto também adquirem
    Gann Made Easy
    Oleg Rodin
    4.81 (132)
    Gann Made Easy é um sistema de negociação Forex profissional e fácil de usar, baseado nos melhores princípios de negociação usando a teoria do sr. W. D. Gann. O indicador fornece sinais precisos de COMPRA e VENDA, incluindo níveis de Stop Loss e Take Profit. Você pode negociar mesmo em movimento usando notificações PUSH. Entre em contato comigo após a compra! Vou compartilhar minhas dicas de negociação com você e ótimos indicadores de bônus de graça! Provavelmente você já ouviu muitas vezes sobr
    M1 Sniper
    Oleg Rodin
    5 (4)
    O M1 SNIPER é um sistema indicador de negociação fácil de usar. É um indicador de seta projetado para o período M1. O indicador pode ser usado como um sistema independente para scalping no período M1 e pode ser usado como parte do seu sistema de negociação existente. Embora este sistema de negociação tenha sido projetado especificamente para negociação no M1, ele também pode ser usado em outros períodos. Originalmente, desenvolvi este método para negociar XAUUSD e BTCUSD. Mas considero-o útil ta
    Cycle Maestro
    Stefano Frisetti
    NEGOCIAÇÃO com CYCLEMAESTRO O sinal é simples e imediato: assim que o fundo de uma área fica verde ou vermelho, significa que um sinal de NEGOCIAÇÃO está ativo: VERDE = COMPRA e VERMELHO = VENDA. O TRADER pode abrir a NEGOCIAÇÃO e seguir as próximas instruções.  OBSERVAÇÃO: O CYCLEMAESTRO é distribuído apenas neste site, não há outros distribuidores. A versão DEMO é apenas para referência e não é suportada. A versão final é suportada e funciona perfeitamente. CYCLEMAESTRO, o primeiro e únic
    Algo Pumping MT4
    Ihor Otkydach
    4.92 (12)
    PUMPING STATION – Sua estratégia pessoal “tudo incluído” Apresentamos o PUMPING STATION — um indicador revolucionário para Forex que vai transformar sua maneira de operar em uma experiência empolgante e eficaz. Este não é apenas um assistente, mas sim um sistema de trading completo com algoritmos poderosos que vão te ajudar a operar de forma mais estável. Ao adquirir este produto, você recebe GRATUITAMENTE: Arquivos de configuração exclusivos: para uma configuração automática e desempenho máximo
    Scalper Inside PRO
    Alexey Minkov
    4.74 (66)
    An exclusive indicator that utilizes an innovative algorithm to swiftly and accurately determine the market trend. The indicator automatically calculates opening, closing, and profit levels, providing detailed trading statistics. With these features, you can choose the most appropriate trading instrument for the current market conditions. Additionally, you can easily integrate your own arrow indicators into Scalper Inside Pro to quickly evaluate their statistics and profitability. Scalper Inside
    Dynamic Forex28 Navigator
    Bernhard Schweigert
    5 (5)
    Dynamic Forex28 Navigator - A ferramenta de negociação Forex de última geração. ATUALMENTE 49% DE DESCONTO. Dynamic Forex28 Navigator é a evolução dos nossos indicadores populares de longa data, combinando o poder de três em um: Indicador Advanced Currency Strength28 (695 avaliações) + Advanced Currency IMPULSE com ALERTA (520 avaliações) + Sinais CS28 Combo (Bônus). Detalhes sobre o indicador https://www.mql5.com/en/blogs/post/758844 O que o Next-Generation Strength Indicator oferece?  Tudo
    Currency Strength Exotics
    Bernhard Schweigert
    4.88 (32)
    ACTUALMENTE 20% DE DESCONTO ! A melhor solução para qualquer novato ou comerciante especializado! Este Indicador é especializado para mostrar a força da moeda para quaisquer símbolos como Pares Exóticos de Commodities, Índices ou Futuros. É o primeiro do seu género, qualquer símbolo pode ser adicionado à 9ª linha para mostrar a verdadeira força da moeda de Ouro, Prata, Petróleo, DAX, US30, MXN, TRY, CNH etc. Esta é uma ferramenta de negociação única, de alta qualidade e acessível, porque inco
    Trend Screener
    STE S.S.COMPANY
    4.78 (93)
    Indicador de tendência, solução única inovadora para negociação e filtragem de tendências com todos os recursos de tendências importantes construídos dentro de uma ferramenta! É um indicador multi-timeframe e multi-moedas 100% sem repintura que pode ser usado em todos os símbolos/instrumentos: forex, commodities, criptomoedas, índices e ações. OFERTA POR TEMPO LIMITADO: O indicador Support and Resistance Screener está disponível por apenas US$ 50e vitalício. (Preço original US$ 250) (oferta este
    Gold Stuff
    Vasiliy Strukov
    4.85 (262)
    Gold Stuff-um indicador de tendência projetado especificamente para o ouro, também pode ser usado em qualquer instrumento financeiro. O indicador não é redesenhado ou atrasado. O timeframe recomendado é H1. O EA Gold Stuff Expert Advisor está escrito neste indicador, você pode encontrá-lo no meu perfil. Importante! Entre em contato comigo imediatamente após a compra para obter instruções e bônus!  Você pode obter uma cópia gratuita do nosso indicador Strong Support e Trend Scanner, envie uma
    IQ Gold Gann Levels a non-repainting, precision tool designed exclusively for XAUUSD/Gold intraday trading. It uses W.D. Gann’s square root method to plot real-time support and resistance levels, helping traders spot high-probability entries with confidence and clarity. William Delbert Gann (W.D. Gann) was an exceptional market analyst, whose trading technique was based on a complex blend of mathematics, geometry, astrology, and ancient mathematics which proved to be extremely accurate. Download
    PZ Trend Trading
    PZ TRADING SLU
    4.8 (5)
    O Trend Trading é um indicador projetado para lucrar o máximo possível com as tendências que ocorrem no mercado, cronometrando retrocessos e rupturas. Ele encontra oportunidades de negociação analisando o que o preço está fazendo durante as tendências estabelecidas. [ Guia de instalação | Guia de atualização | Solução de problemas | FAQ | Todos os produtos ] Negocie mercados financeiros com confiança e eficiência Lucre com as tendências estabelecidas sem ser chicoteado Reconhecer retrocessos
    O Gold Buster M1 System é um sistema de negociação profissional para gráficos M1 no par XAUUSD. Mas, apesar de o sistema ter sido originalmente desenvolvido exclusivamente para negociar ouro, o sistema também pode ser usado com alguns outros pares de moedas. Após a compra, fornecerei uma lista de pares de negociação que podem ser usados ​​com o sistema além do XAUUSD, o que ampliará suas possibilidades de uso deste sistema. TODOS OS INDICADORES DO SISTEMA NÃO SE REPETEM! Este sistema é um conjun
    MBFX Timing
    Mohamed Hassan
    5 (2)
    After purchase, contact me in private to get 7 days of FREE testing with EA Forex Proton where the robot automatically takes the trade alerts from MBFX Timing! MBFX Timing is an indicator that was developed and created by Mostafa Belkhayate, one of the best traders in the world. We decided to create a modified version that takes inspiration from the Stochastic Oscillator and the Relative Strength Quality Index indicators to improve your trading.  One of the main reasons we released MBFX Timing
    Hydra Trend Rider is a non-repainting, multi-timeframe trend indicator that delivers precise buy/sell signals and real-time alerts for high-probability trade setups. With its color-coded trend line, customizable dashboard, and mobile notifications, it's perfect for traders seeking clarity, confidence, and consistency in trend trading. Download the Metatrader 5 Version Message us here after purchase to get the Indicator Manual. Download Now! Offer valid only for next 10 Buyers. Price will increas
    Este painel mostra os últimos padrões harmónicos disponíveis para os símbolos seleccionados, pelo que poupará tempo e será mais eficiente / versão MT5 . Indicador gratuito: Basic Harmonic Pattern Colunas do indicador Symbol : aparecem os símbolos seleccionados Trend : de alta ou de baixa Pattern : tipo de padrão (gartley, borboleta, morcego, caranguejo, tubarão, cifra ou ABCD) Entry : preço de entrada SL: preço de paragem de perda TP1: preço do 1º take profit TP2: preço do 2º take profit TP3:
    Support Resistance screnner
    STE S.S.COMPANY
    4.94 (36)
    O Support And Resistance Screener está em um indicador de nível para MetaTrader que fornece várias ferramentas dentro de um indicador. As ferramentas disponíveis são: 1. Screener de estrutura de mercado. 2. Zona de retração de alta. 3. Zona de retração de baixa. 4. Pontos de Pivô Diários 5. Pontos Pivot semanais 6. Pontos Pivot mensais 7. Forte suporte e resistência com base no padrão harmônico e volume. 8. Zonas de nível de banco. OFERTA POR TEMPO LIMITADO: O indicador de suporte e resistência
    ACTUALMENTE 31% DE DESCONTO!! A melhor solução para qualquer novato ou comerciante especializado! Este indicador é uma ferramenta comercial única, de alta qualidade e acessível, porque incorporámos uma série de características proprietárias e uma fórmula secreta. Com apenas UM gráfico, dá alertas para todos os 28 pares de moedas. Imagine como a sua negociação irá melhorar porque é capaz de identificar o ponto exacto de desencadeamento de uma nova tendência ou oportunidade de escalada! Constr
    IQ FX Gann Levels a precision trading indicator based on W.D. Gann’s square root methods. It plots real-time, non-repainting support and resistance levels to help traders confidently spot intraday and scalping opportunities with high accuracy. William Delbert Gann (W.D. Gann) was an exceptional market analyst, whose trading technique was based on a complex blend of mathematics, geometry, astrology, and ancient mathematics which proved to be extremely accurate. Download the Metatrader 5 Version M
    Enigmera
    Ivan Stefanov
    5 (7)
    ENIGMERA: O núcleo do mercado Importante: A demonstração do MQL5.com funciona no Strategy Tester e pode não refletir completamente a funcionalidade do Enigmera. Verifique a descrição, as capturas de tela e o vídeo para mais detalhes. Fique à vontade para me enviar uma mensagem com qualquer dúvida! O código do indicador foi completamente reescrito. A versão 3.0 adiciona novas funcionalidades e corrige erros acumulados desde o início do indicador. Introdução Este indicador e sistema de negociação
    Special offer : ALL TOOLS , just $35 each! New tools   will be   $30   for the   first week   or the   first 3 purchases !  Trading Tools Channel on MQL5 : Join my MQL5 channel to update the latest news from me Apresentamos o revolucionário RSI Kernel Optimized com Scanner, uma ferramenta inovadora que redefine a análise tradicional do RSI ao integrar o poderoso algoritmo de Estimativa de Densidade Kernel (KDE). Este indicador avançado não apenas fornece informações em tempo real sobre as tendê
    ACB Breakout Arrows
    KEENBASE SOFTWARE SOLUTIONS
    4.15 (34)
    O indicador ACB Breakout Arrows fornece um sinal de entrada essencial no mercado ao detectar um padrão especial de rompimento. Ele monitora constantemente o gráfico em busca de um momento de estabilização direcional e oferece um sinal preciso pouco antes de um grande movimento.  Obtenha o scanner multissímbolo e multitemporal aqui - Scanner para ACB Breakout Arrows MT4 Principais recursos O indicador fornece níveis de Stop Loss e Take Profit. Acompanha um painel de Scanner MTF que monitora sina
    O TPX Dash Agulhada é tudo o que você precisa para encontrar em vários timesframes e em diversos pares ao mesmo tempo as famosas Agulhadas do Didi, que é o encontro simultâneo das médias 3, 8 e 20 que alinhado com o indicador ADX, são sinônimo de grandes e fortes movimentos no mercado. Sem mensalidades, você leva por um valor justo uma ferramenta que colocada em uma VPS te envia a mensagem na hora para o seu celular, fazendo você ter mais tempo livre e não ter que ficar colado na tela o dia int
    Scalper Vault
    Oleg Rodin
    5 (32)
    Scalper Vault é um sistema profissional de escalpelamento que fornece tudo o que você precisa para um escalpelamento bem-sucedido. Este indicador é um sistema de negociação completo que pode ser usado por comerciantes de forex e opções binárias. O período de tempo recomendado é M5. O sistema fornece sinais de seta precisos na direção da tendência. Ele também fornece sinais superiores e inferiores e níveis de mercado Gann. Os indicadores fornecem todos os tipos de alertas, incluindo notificações
    Gold Venamax MT4
    Sergei Linskii
    2 (1)
    Gold Venamax   - este é o melhor indicador técnico de ações. O algoritmo do indicador analisa o movimento do preço de um ativo e reflete a volatilidade e as zonas de entrada potenciais. Recursos do indicador: Este é um super indicador com Magic e dois blocos de setas de tendência para uma negociação confortável e lucrativa. O botão vermelho para alternar blocos é exibido no gráfico. Magic é definido nas configurações do indicador, para que você possa instalar o indicador em dois gráficos exibin
    ACTUALMENTE COM 26% DE DESCONTO A melhor solução para qualquer novato ou comerciante especializado! Este Indicador é uma ferramenta comercial única, de alta qualidade e acessível, porque incorporámos uma série de características proprietárias e uma nova fórmula. Com apenas UM gráfico, pode ler a força da moeda para 28 pares de Forex! Imagine como a sua negociação irá melhorar porque é capaz de apontar o ponto exacto do gatilho de uma nova tendência ou oportunidade de escalada? Manual do util
    Stratos Pali
    Michela Russo
    5 (3)
    Stratos Pali Indicator   is a revolutionary tool designed to enhance your trading strategy by accurately identifying market trends. This sophisticated indicator uses a unique algorithm to generate a complete histogram, which records when the trend is Long or Short. When a trend reversal occurs, an arrow appears, indicating the new direction of the trend. Important Information Revealed Leave a review and contact me via mql5 message to receive My Top 5 set files for Stratos Pali at no cost! Dow
    Quantum Profile System  —   is a comprehensive professional trading system with advanced algorithms. It combines trend direction analysis, volume concentration at key levels, dynamic adaptation to market volatility, and signal generation without delays or repainting. Quantum Profile System integrates the functionality of a volume profile based on linear regression with an adaptive trend channel using ATR. It features volume profiles with construction and display in two directions. Multi-level v
    TPSproTREND PrO
    Roman Podpora
    4.65 (23)
    VERSION MT5        —        ИНСТРУКЦИЯ RUS           —        INSTRUCTIONS  ENG Principais funções: Sinais de entrada precisos SEM RENDERIZAÇÃO! Se aparecer um sinal, ele permanece relevante! Esta é uma diferença importante em relação aos indicadores de redesenho, que podem fornecer um sinal e depois alterá-lo, o que pode levar à perda de fundos depositados. Agora você pode entrar no mercado com maior probabilidade e precisão. Também existe a função de colorir as velas após o aparecimento da se
    FX Gunslinger
    Oleg Rodin
    5 (3)
    Forex Gunslinger é um indicador de sinais de reversão de COMPRA/VENDA projetado em torno da ideia de combinar suporte/resistência, cruzamentos e osciladores no modo MTF. Quando tudo está alinhado, o indicador gera um sinal de COMPRA ou VENDA. Embora o indicador seja baseado na ideia do MTF, o algoritmo é muito estável e gera sinais de reversão confiáveis. Este é um indicador do tipo MTF onde pode usar um período de tempo maior ou menor para calcular os sinais para o seu gráfico atual. Mas também
    Market Structure Break Out
    Ashkan Hazegh Nikrou
    5 (5)
    O Market Structure Break Out (MSB) é uma ferramenta avançada desenvolvida para MT4 e MT5 , projetada para ajudar os traders a visualizar o movimento do mercado como uma estrutura. Ele identifica e mostra sinais de trading importantes por meio de setas e alertas , tanto na direção da tendência quanto na direção contrária . Uma das funcionalidades principais é o desenho de zonas de oferta e demanda contínuas , fornecendo uma visão clara dos níveis importantes de preço. Além disso, o recurso de ba
    Mais do autor
    Fine Trade AM
    Andriy Matviyevs'kyy
    5 (1)
    O indicador apresentado avalia a volatilidade de um instrumento financeiro e com elevada eficiência emite sinais sobre momentos de alterações significativas na direção do movimento dos preços. O indicador é intuitivo e fácil de utilizar. O sinal indicador é gerado após a conclusão da formação da barra, na qual o indicador muda a sua posição em relação a zero. O indicador nunca redesenha o sinal. Os sinais do indicador devem ser confirmados pelo preço que excede o máximo/mínimo da barra na qual o
    FREE
    Step RSI AM
    Andriy Matviyevs'kyy
    5 (2)
    O indicador apresentado é um desenvolvimento original baseado no indicador clássico de análise técnica - RSI. Para suavizar as flutuações bruscas nos valores dos indicadores, é utilizado um filtro que corta as mudanças fracas e concentra a atenção do trader nas flutuações fortes dos valores. O indicador não repinta em barras formadas. Para uma maior eficácia deste indicador, deve ser utilizado em conjunto com indicadores que identifiquem a direção da tendência, bem como os níveis de suporte/resi
    FREE
    ADX Line AM
    Andriy Matviyevs'kyy
    4.75 (4)
    This indicator, interpreting ADX and ATR data, clearly and accurately identifies the current trend, allowing the trader to get the most out of strong price movements. The indicator is intuitive to use: a change in line direction means a change in trend direction; a change in line color warns of an imminent change in direction. The indicator does not repaint and allows you to send notifications about its signals to a mobile terminal and email. Configurable parameters: ADX_Medium_Coefficient - the
    FREE
    Limit Levels AM
    Andriy Matviyevs'kyy
    The presented indicator sets dynamic support/resistance levels on the price chart. The indicator is easy to use and can be useful for both beginners and professional traders. The middle line of the indicator (Central level) helps to identify the current trend: If the closing price is above the central line - the trend is ascending. If the closing price is below the central line - the trend is descending. The presented indicator allows implementing another version of the trading strategy, which w
    FREE
    Double PSAR AM
    Andriy Matviyevs'kyy
    5 (1)
    This indicator is the author's implementation of the classic indicator Parabolic Support and Resist (PSAR). A time-tested product that allows you to not only determine entry/exit points but also reasonable levels for setting protective stop orders. The indicator has two customizable ranges, which allows you to identify long-term and short-term trends. The indicator does not repaint on the data history. The indicator has the ability to give signals and send notifications about them to e-mail and
    FREE
    RSI Cross Signal AM
    Andriy Matviyevs'kyy
    The indicator gives signals to open/close a position and marks them on the price chart of the financial instrument. The signals differ in their potential, which allows you to decide on the amount of risk in each transaction. The principle of operation is to compare the current RSI value with the RSI value whose period is multiplied by the Cross_Factor value. The signal is confirmed when the price overcomes the maximum/minimum of the bar on which the indicator gave the signal. The open position i
    FREE
    MFI Signal AM
    Andriy Matviyevs'kyy
    5 (1)
    This indicator displays signals on the price chart based on the data of the classic indicator - the Money Flow Index (MFI). The volume is taken into account when calculating the MFI values. MFI can be used to determine overbought or oversold zones in the market. This indicator allows you to display three types of signals on the price chart: MFI exit from the overbought or oversold zone; MFI entry into the overbought or oversold zone; MFI crossing the middle between the overbought and oversold zo
    FREE
    ADX Signal AM
    Andriy Matviyevs'kyy
    4.67 (3)
    This indicator is an interpretation of the Average Directional Movement Index (ADX), which helps to determine the presence of a price trend. It was developed and described in detail in the book "New Concepts in Technical Trading Systems" by Welles Wilder. The presented indicator displays signals on the price chart when +DI and -DI cross and signals when the ADX value falls or rises in relation to the mutual arrangement of +DI and -DI. The indicator's buy signals also work as a support level, whi
    FREE
    Fractal Levels AM
    Andriy Matviyevs'kyy
    The presented indicator is an original development based on the idea embedded in the classic technical analysis indicator - Fractals. The Fractals indicator allows you to determine a significant trough or peak for analysis on the price chart of the financial instrument in question. The fractal itself on the price chart consists of candles, the middle of which is either the highest (up fractal) or the lowest (down fractal) of all the candles taken for analysis. The original indicator uses five ca
    FREE
    EasyTrend AM
    Andriy Matviyevs'kyy
    5 (1)
    The presented product is a trend indicator of technical analysis that allows you to open a position at the very beginning of a significant price movement. The most important qualities of the presented indicator are: The ability to follow the trend for as long as possible to get all the potential profit; Minimization of potential losses in case of a trend reversal or significant correction. The indicator has a wide range of customizable parameters allowing it to be used effectively in any market
    FREE
    TTF Candles AM
    Andriy Matviyevs'kyy
    The presented indicator is an original development based on the TTF (Trend Trigger Factors) indicator. The indicator colors the price chart candles according to the TTF indicator data and its smoothed value (Signal line). The indicator does not repaint. The following thesis is used: The intersection of the TTF oscillator with the zero value is a buy/sell signal. The intersection of the TTF oscillator with its smoothed value is a signal of a change in trend. Thus: If the TTF indicator is greater
    FREE
    SuperTrend AM
    Andriy Matviyevs'kyy
    5 (1)
    The presented product is a trend indicator of technical analysis that builds dynamic support/resistance levels based on the volatility of a financial instrument. The indicator allows you to determine the entry points into the market at the moment the price overcomes dynamic support/resistance level and to set a reasonable level for fixing a loss/profit. The indicator is a simple and effective tool that (depending on the parameter settings) can be used in almost any market and for any trading st
    FREE
    ADX Trigger AM
    Andriy Matviyevs'kyy
    5 (1)
    This indicator is an interpretation of the Average Directional Movement Index (ADX), which helps to determine the presence of a price trend. It was developed and described in detail in the book "New Concepts in Technical Trading Systems" by Welles Wilder. The indicator determines entry points into the market, using the intersection of the +/- lines of the ADX indicator as a signal, as well as the rise or fall of the main line of the ADX indicator. Crossing the zero line by the indicator indicate
    FREE
    HyperSignal AM
    Andriy Matviyevs'kyy
    The presented indicator is an original development. The indicator is designed for high-frequency short-term trading with maximum reinvestment of funds. The indicator gives signals to open/close a position. The indicator sensitivity can be adjusted in a literally infinite range, which allows it to be used for trading in any market. The indicator signals vary in strength depending on their consistency with the trend over three different time periods. The above indicator feature allows you to esti
    FREE
    DSS Oscillator AM
    Andriy Matviyevs'kyy
    The presented indicator is the author's implementation of the Double Smoothed Stochastic oscillator developed by William Blau and Walter Bressert. The calculation of values ​​is in many ways similar to the calculation of the classic stochastic oscillator. The indicator takes into account the location of the current price relative to local highs/lows. The indicator gives signals about changing its direction and/or about entering/exiting the overbought/oversold zone. The signal is given after the
    FREE
    TTF Line AM
    Andriy Matviyevs'kyy
    The presented indicator draws a trend line and points of change in its direction on the price chart based on the TTF (Trend Trigger Factors) and ATR indicators. The indicator advantageously combines ease of use, speed of reaction to a change in trend direction and reliability of signals. The indicator is intuitive to use: Change in line direction - change in trend direction; Change in line color warns of an imminent change in direction. The indicator does not repaint and allows you to send notif
    FREE
    ASC Signal AM
    Andriy Matviyevs'kyy
    A signal indicator marking buy/sell points. In this version, it is supplemented with optimal SL points. Recommended for use in conjunction with a trend indicator to filter signals. The indicator has only one adjustable parameter that determines its sensitivity, which greatly simplifies setting the indicator to the current market and the user's trading style. Indicator signals are given only after the full formation of the bar. The indicator can be used to trade any market. Its basic parameters p
    FREE
    REI Oscillator AM
    Andriy Matviyevs'kyy
    The presented product is the author's implementation of the REI (Range Expansion Index) indicator developed by Thomas DeMark. REI Oscillator AM is an indicator that measures the rate of price change and signals overbought/oversold conditions if the price shows weakness or strength. The indicator value changes within the range from -100 to +100. Thomas DeMark suggests using the default period of 8 and the following algorithm for using the indicator: When the price rises above level 60 and then fa
    FREE
    Simple Trend AM
    Andriy Matviyevs'kyy
    The trend is your friend. A simple truth known to every trader. The presented indicator allows you to visualize the current trend. The indicator identifies the trend using the following definition as an algorithm: A trend is a situation when each subsequent maximum price rise is higher/lower than the previous one, and similarly each subsequent maximum price fall is higher/lower than the previous one; The beginning of a new trend is considered to be when the current maximum/minimum overcomes all
    FREE
    Deep River AM
    Andriy Matviyevs'kyy
    The presented indicator is the author's implementation of the classic trading idea: Moving averages of different periods diverge over time on a strengthening trend and converge on a weakening trend. The proposed product allows you to clearly demonstrate: The direction of price movement; Temporary price rollbacks; Zones of multidirectional price movement. Namely: The indicator lines go up and diverge from each other - a strong bullish trend; The indicator lines go down and diverge from each othe
    FREE
    DSS Candles AM
    Andriy Matviyevs'kyy
    5 (1)
    This indicator colors the price chart candles according to the data of the DSS Oscillator AM indicator. DSS Oscillator AM is the author's implementation of the Double Smoothed Stochastic oscillator developed by William Blau and Walter Bressert. The calculation of values ​​is largely similar to the calculation of the classic stochastic oscillator. The indicator takes into account the location of the current price relative to local highs/lows. The signal about the change in the direction of price
    FREE
    RSI 4x Candles AM
    Andriy Matviyevs'kyy
    The presented indicator displays in the form of colored candles the signals of the intersections of four RSI indicators of different periods. The candle turns red when the values ​​of the first indicator are less than the values ​​of the second indicator and the values ​​of the third indicator are less than the values ​​of the fourth indicator. The candle turns blue when the values ​​of the first indicator are greater than the values ​​of the second indicator and the values ​​of the third indica
    FREE
    Bulls or Bears AM
    Andriy Matviyevs'kyy
    5 (1)
    The presented indicator implements the idea embedded in the classic technical analysis indicators - "Bulls" / "Bears" at a new level. The "Bulls or Bears AM" indicator displays the difference between the maximum and minimum prices for the current period of time and the values ​​of the channel built on the maximum and minimum prices for a longer period. The growth of the indicator values ​​above zero indicates that the maximum price for the current period is greater than the average value of maxi
    Market Pulse AM
    Andriy Matviyevs'kyy
    5 (1)
    The presented indicator analyzes the direction of the short-term and long-term trend for specified periods, taking into account the volatility of the market. This approach allows combining high sensitivity of the indicator with a high probability of execution of its signals. The principle of use is extremely simple: the indicator histogram is greater than 0 - a buy signal / the indicator histogram is less than 0 - a sell signal. The indicator allows you to configure two types of parameters: fast
    Digital Arrows AM
    Andriy Matviyevs'kyy
    The presented technical analysis indicator marks the points on the price chart of a financial instrument at which the short-term/long-term trend has changed its direction. The indicator identifies the trend direction by analyzing the divergence of the price series with the data of the digital filter selected by the user. The ability of the applied digital filters to adapt to sharp price fluctuations allows achieving high efficiency of the indicator signals in most markets. The indicator signals
    Filtro:
    Sem comentários
    Responder ao comentário
    Versão 30.65 2025.05.16
    Update. Rework.
    Versão 30.60 2025.05.11
    Updated.
    Versão 30.55 2025.04.12
    Updated.
    Versão 30.50 2025.03.20
    Updated.
    Versão 30.0 2025.03.20
    Updated to version 30+.
    Versão 28.10 2024.11.04
    Updated to version 28.10.
    Versão 28.5 2024.11.03
    Updated to version 28.05.
    Versão 28.0 2024.11.03
    Updated to version 28+.
    Versão 27.0 2024.09.17
    Updated to version 27+.
    Versão 26.30 2024.06.06
    Updated to version 26.30
    Versão 26.20 2024.05.15
    Updated to version 26.2
    Versão 26.10 2024.05.13
    Fixed bug. Updated to version 26.1.